ANNEE: 2012 THESE N °: 2
THESE DE DOCTORAT
CONTRIBUTION AU DEVELOPEMENT DU CONTROLE DE QUALITE DES PRODUITS PHARMACEUTIQUES: VALIDATION ET TRANSFERT DES
PROCEDURES ANALYTIQUES SELON DIFFERENTES APPROCHES Sciences du Médicament
Equipe de Recherche d’Analyse Pharmaceutiques et Toxicologiques
Présentée et soutenue par
Mr. AMOOD EL KAMARANY MOHAMMED ALI QASEM
Le 19 Juillet 2012
JURY
Pr. Yahia Cherrah Président
Faculté de Médecine et de Pharmacie - Rabat Université Mohammed V – Souissi
Pr. Abdelaziz Bouklouze Directeur de Thèse Faculté de Médecine et de Pharmacie - Rabat
Université Mohammed V – Souissi
Pr. Mustapha Draoui
Faculté de Médecine et de Pharmacie - Rabat Université Mohammed V – Souissi
Pr. Brahim Benaji
Faculté des Sciences - Ain Chock Rapporteurs Université Hassan II – Casablanca
Pr. Khalid Digua
Faculté des Sciences et Techniques – Mohammedia Université Hassan II – Mohammedia
Pr. Abdlakader Laatiris
Faculté de Médecine et de Pharmacie - Rabat Université Mohammed V – Souissi
Pr. Mohammed Hassar Examinateurs
Faculté de Médecine et de Pharmacie - Rabat Université Mohammed V – Souissi
Faculté de Médecine et de Pharmacie de Rabat Centre d'Etudes Doctorales Sciences de la Vie et de la Santé
Year: 2012 N ° of Thesis: 2
Ph D Thesis
CONTRIBUTION IN DEVELOPMENT QUALITY CONTROL FOR PHARMACEUTICAL PRODUCTS: DIFFERENT APPROACHES FOR VALIDATION AND TRANSFER OF ANALYTICAL PROCEDURES
Presented by
Mr. Mohammed Ali Qasem Amood AL-Kamarany Born on 05 / 07 / 1980 in Jeddah KSA
Drugs sciences: Team research of pharmaceutical and toxicological
Professor Yahia Cherrah President
Faculty of medicine and pharmacy – Rabat University Mohammed V – Souissi
Professor Abdelaziz Bouklouze Director of Thesis Faculty of medicine and pharmacy – Rabat
University Mohammed V – Souissi
Professor Mustapha Draoui
Faculty of medicine and pharmacy – Rabat University Mohammed V – Souissi
Professor Brahim Benaji
Faculty of Sciences – Ain Chock Reporters
University Hassan II – Casablanca
Professor Khalid Digua
Faculty of Sciences and Techniques University Hassan II – Mohammedia
Professor Abdlakader Laatiris
Faculty of medicine and pharmacy – Rabat University Mohammed V – Souissi
Pr. Mohammed Hassar Examiners
Faculty of medicine and pharmacy – Rabat University Mohammed V – Souissi
Faculty of Medicine and Pharmacy of Rabat PhD Studies Center: Biological sciences and Health
ِ
ميِحَّرلا ِنَمْحَّرلا الله مسب
The results presented here are the summary of 4 years of hard work. However, much of the real learning experience has come through experiments which can be reproduced and published.
I would like to thank Prof. Yahia Cherrah, Professor of pharmacology, Vice Dean of the Faculty of Medicine and Pharmacy of Rabat and director of the pharmacology and toxicology laboratory. His remarkable ability to see the essence of the problems was the compass leading the way out. He has an astonishing memory and in discussions often comes up with detailed information from articles or conferences from decades ago.
I would like to thank my supervisor for 4 years, Professor of pharmaceutical applied sciences Abdelaziz Bouklouze . His trust has been a great encouragement and made me set out on many new paths seeking answers. I am very grateful for the kindness, he showed in makingmy stay in Morocco socially very enjoyable, bureaucratically easy and intellectually challenging. He is also the head of the research team of pharmaceutical and toxicological analysis - laboratory of pharmacology and toxicology – Faculty of medicine and pharmacy – Rabat .
Thanks also to my colleague Mr. Miloud EL Karbane in Rabat , Morocco . He is working in pharmaceutical analysis. I am very grateful for the extraordinary effort he made in teaching me all the practicalities of pharmaceutical quality control, He was as technical supervisor at the National Laboratory of Drugs Quality Control – Direction of Medicaments and Pharmacy – Ministry of health – Morocco. I am very grateful for the kindness he showed in making the stay in Morocco socially very enjoyable, bureaucratically easy and intellectually challenging.
I would like to thank Professor Fars Alanazi from the Department of Pharmaceutics - College of Pharmacy – King Saud University – Riyad. He is one of the foremost in Pharmaceutical Industries and I was honored to be accepted to work with his research team of pharmaceutical and toxicological analysis based on cooperation with my supervisor . He is not only a great intellectual, but quickly turned into a good friend through his youthful mindset.
I would like to thank Pr. Khalid Digua – Faculty of Sciences and Techniques – University Hassan II – Mohammedia who accepted as to be rapporteur for this thesis . I would like to thank Pr. Mustapha Draoui – Faculty of Medicine and Pharmacy - University Mohammede V – Souissi – Rabat who accepted as to be rapporteur for this thesis. I would like to thank Pr. Brahim Benaji – Faculty of Sciences – Ain Chock – University Hassan II – Casablanca who accepted as to be rapporteur for this thesis. I would like to thank Pr. Mohammed Hassar and Pr. Abdelkader Laatiris – Faculty of Medicine and Pharmacy - University Mohammede V – Souissi – Rabat whose accepted as to be examiner in this thesis.
Thanks also to my colleague Ms . Houda Bouchafra in Rabat , Morocco . She is a PhD student at the National Laboratory of Drugs Quality Control .
I would like to thank Dr. Mohammed Azougagh, one of the foremost in pharmaceutical analysis and chief of physico-chemical service in National Laboratory of Drugs Quality Control of Rabat . He played an important role in supporting this thesis. Dr. Youssef Ramli in National Laboratory of Drugs Quality Control of Rabat, Morocco . He always motivates me in development of research. Dr. AL Saadia Ismaili , Mustapha ELalami , Aziz Alalmi , Yousfi Elbakay , Dr. Kamal Belafia in National Laboratory of
Drugs Quality Control of Rabat, Morocco . They helped me in this research. Dr. Mohammed Radi in National Laboratory of Drugs Quality Control of Rabat, Morocco . responsible of pharmaco – technique tests in laboratory. He played an important role in allowing me to acquire skills in this field. Dr. Mohammed Mahli , head of National Laboratory of Drugs Quality Control of Rabat, Morocco . He gave me the authorization to do the research in the laborator . Dr. Omar Bouaza , Director of Pharmacy and Medicament - Ministry of Health of Morocco . He played an important role in supporting my research .
Finally , I would like to thank the director and staff of the Drugs Quality Control Laboratory of Rabat, Morocco, for their fruitful assistance. Also I would like to thank the College of Pharmacy , KSU of Riyad for supporting this wok .
Finally, I want to thank my friends and my family for support and for helping me to have at least a minimum of a social life outside the department. My greatest gratitude goes to my wife and my son. She made great sacrifices, especially during the last four years. My wife has supported me through good and bad days and without her efforts I would never have been able to bring this to a conclusion.
Contents
Abbreviation
--- iList of Tables
--- iiList of Figures
--- iiIntroduction
--- 1Part I : Review of literature ---
7Chapter I : Pharmaceutical quality control --- 8
I.1. Introduction--- 9
I.2 The assay methods in quality control of bulk pharmaceuticals --- 9
I.2.1.Definition --- 9
I.2.2. Aim --- 9
I.2.3. Regulatory expectations and guidelines --- 9
I.2.4. Pharmaceutical analytical methods --- 10
I.2.4.1. Chromatography --- 10
I.2.4.2. Spectroscopy --- 11
I.2.4.3. Combination methods --- 12
I.5. The role of assay methods in characterizing the quality of bulk pharmaceuticals ---13
I.5.1. For assaying of API --- 13
I.5.2. For impurities profile --- 13
I.5.3. For bioequivalence In vitro (dissolution test) --- 14
Chapter II : Validation of analytical methods --- 15
II.1. Definition --- 16
II.2. Role of the analytical method validation --- 16
II.3. Regulatory expectations and guidelines --- 16
II.4. Analytical method validation steps --- 17
II.4.1. Specificity --- 17
II.4.2. Response function --- 17
II.4.3. Trueness --- 17
II.4.4. Precision --- 17
II.4.7. Detection limit --- 19
II.4.8. Quantification limit --- 19
II.4.9. Robustness --- 19
II.4.10. Ruggedness --- 19
II.5. Types --- 20
II.5.1. Classical --- 22
II.5.2. Accuracy profile (total error ) --- 22
Chapter III : Transfer of analytical methods --- 24
III.1. Definition --- 25
III.2. Objective of the analytical method transfer --- 26
III.3. Regulatory expectations and guidelines --- 26
III.5. Types --- 26
III.5.1. Comparative testing --- 26
III.5.2. Covalidation between laboratories --- 26
III.5.3. Verification and revalidation Comparative testing --- 27
III.5.4. Transfer wavier Comparative testing --- 27
Chapter IV : Statistical approaches for pharmaceutical quality control --- 28
IV.1. Introduction --- 29
IV.2. Approaches for validation of analytical procedures --- 29
IV.2.1. Classical approach based on SFPST 1992 --- 29
IV.2.2. Total error approaches ( accuracy profile) based on SFPST 2003 --- 35
IV.3. Approaches for transfer of analytical procedure --- 37
IV.3.1. United States Pharmacopoeia Concept (1010) --- 37
IV.3.2. Classical approaches --- 37
IV.3.3. Experimental designs and acceptance limits --- 39
IV..4. Approaches in drugs dissolution testing --- 41
IV.4.1. Similarity and difference tests --- 41
IV.4.2. Mechanism of drugs release --- 41
IV.4..3. R - chart control --- 42
IV.5. Conclusion --- 43
Part II : Experimental ---
53Chapter I : Development and validation of LC method for the diclofenac sodium release determination and impurities profile using different approaches --- 53
I.1. Introduction --- 54
I.2. Materials and methods --- 57
I.1 Standard and placebo --- 57
I.2. Reagent --- 57
I.3. Apparatus --- 57
I.4. Chromatographic conditions --- 58
I.5. Validation of the analytical method at the sending laboratory --- 58
I.5.1. Preparation of assay validation --- 58
I.5.2. Robustness study --- 59
I.5.3. Validation of RP – HPLC method for impurities profile --- 60
I.5.4. Computation Analysis --- 61
I.2.5 Real content and dissolution test --- 61
I.2.5.1. Real content in tablets --- 61
I.2.5.2. Dissolution test --- 61
I.2.5.3. Comparative between Validated and USP Methods test --- 62
I.3. Results and discussion --- 62
I.3.1. Method validation based on accuracy profile --- 62
I.3.1.1. Selection of the chromatographic conditions --- 62
I.3.1.2. Selectivity --- 62
I.3.1.3. System suitability --- 65
I.3.1.4. Analysis of the response functions --- 65
I.3.1.5. Trueness --- 66
I.3.1.6. Precision --- 67
I.3.1.7. Accuracy --- 67
I.3.1.8. Linearity --- 68
I.3.1.9. Detection and quantitation limits --- 69
I.3.1.10. Risk profiles --- 69
I.3.1.12. Robustness --- 69
I.3.1.8. Linearity --- 72
I.3.1.8. Accuracy --- 72
I.3.1.8. Precision --- 72
I.3.1.8. LOQ and LOQ --- 73
I.3.2. Assay and dissolution test --- 73
I.3.2.1.Real content of API in tablet --- 73
I.3.2.1. Dissolution profile --- 74
I.4. Conclusion --- 77
Appendix I --- 78
Chapter II : Transfer of drug dissolution kinetic and analytical procedure for impurities assay by using statistical approaches : Case study --- 85
II.1. Introduction --- 86
II.2. Materials and methods --- 88
II.2.1. Chemicals --- 88
II.2.2. Apparatus --- 88
II.2.3. Chromatographic conditions --- 88
II.2..4. Validation of the analytical method at the sending laboratory --- 88
II.2.5. Transfer of dissolution drugs kinetic and impurities assay --- 88
II.2.5.1. Experimental design of drug dissolution kinetic --- 88
II.2.5.2. Experimental design for transfer of impurities assay --- 88
II.2.5.3. Statistical approaches for transfer of drugs dissolution testing --- 88
II.2.5.4. Statistical approaches for transfer of impurities assay --- 89
II.3. Results and Discussion --- 90
II.3.1. Transfer of dissolution profile --- 90
II.3.1.1. Descriptive approach --- 90
II.3.1.2. Bioequivalence in vitro approach --- 92
II.3.1.3. Precision approach --- 93
II.3.1.4. Drugs mechanism in vitro approach --- 93
II.3.1.5. R - Chart control approach --- 94
II.3.2. Transfer of impurities assay --- 97
II.3.2.1. Trueness --- 97
II.3.2.2.. Precision --- 97
Appendix II --- 100
Chapter III : Partial validation of analytical procedures of based on different compendial concepts --- ---101 III.1. Introduction --- 102
III.2. Materials and Methods --- 103
III.2.1. Chemical and standard --- 103
III.2.2. Apparatus --- 104
III.2.3. Partial validation of method's compendial --- 104
III.2.3.1. Chromatographic condition --- 104
III.2.3.2. Assaying of API in in dosage form --- 105
III.2.3.3.Impurities profile in dosage form --- 105
III.2.3.4. Assaying of drug dissolution testing --- 106
III.2.4. Application --- 106
III.2.5. Statistical analysis --- 107
III.2.5.1. EDQM concept --- 107
III.2.5.2. USP concept --- 107
III.3. Results and discussion --- 108
III.3.1. Partial validation --- 108
III.3.1.1. System suitability --- 108
III.3.1.2. Assay --- 109
III.3.1.3. Impurities profile --- 110
III.3.1.3. Drugs dissolution testing --- 111
III.3.2. Application --- 112
III.4. Conclusion --- 116
Appendix III --- 117
Chapter IV : Comparative studies of dissolution profile of pharmaceutical products based on different compendial procedures --- 118
IV.1. Introduction --- 119
IV.2. Materials and methods --- 120
IV.2.1. Chemicals --- 120
IV.2.4. Procedure of Dissolution Profiles --- 121
IV.2.4.1. Dissolution Profiles of Paracetamol (Class I) --- 122
IV.2.4.1.1 USP condition --- 122
IV.2.4.1.2. EP condition --- 122
IV.2.4.2. Dissolution Profiles of Diclofenac Sodium (Class II) --- 122
IV.2.4.2.1 USP condition --- 122
IV.2.4.2.2. EP condition --- 123
IV.2.4.3. Dissolution Profiles of Ranitidine (Class III) --- 123
IV.2.4.3.1 USP condition --- 123
IV.2.4.3.2. EP condition --- 123
IV.2.4.4. Dissolution Profiles of Azithromycin (Class IV ) --- 124
IV.2.4.4.1 USP condition --- 124
IV.2.4.4.2. EP condition --- 124
IV.2.5. Statistical Analysis --- 126
IV.2.5.1. Statistical Descriptive --- 126
IV.2.5.2. Similarity and difference tests --- 126
IV.2.5.3. Analysis of drugs release mechanism --- 126
IV.3. Results and discussion --- 126
IV.3.1. Paracetamol (Class I) --- 126
IV.3.2. Diclofenac Sodium (Class II) --- 128
IV.3.3. Ranitidine (Class III) --- 130
IV.3.4. Azithromycin (Class IV) --- 131
IV.4. Conclusion --- 137
Appendix IV --- 138
General Conclusion --- 141
References --- 145
List of Papers – Oral Speaker and Poster Communications --- 155
Abbreviations
BCS Biopharmaceutical Classification System CSs Calibration Standards
DS RF Diclofenac Sodium Reference Standard
EP European Pharmacopeia
EDQM European Directorate for the Quality of Medicines & HealthCare FDA Food and Drugs Administration of USA
GMP Good Manufacturing Practice
ICH International Conference Hominization
IR Immediate Release
ISO International Standard Organization
ISPE International Society Pharmaceutical Engineering
JP Japanese Pharmacopeias
PDA Photo – Array Detector
RP HPLC Reversed Phase – High Performance Liquid Chromatography
RF Reference Standard
SFSTP Société Française des Sciences et Techniques Pharmaceutiques
UV Ultraviolet
USP United State Pharmacopeia
VSs Validation Standards
a The Korsmeyer’s dissolution rate constant Ab Absolut bias AF Asymmetry Factor a Slope b Intercept α apha risk β beta risk
CI σ The confidence interval of a standard deviation
CI CV IP The confidence interval of a coefficient of variation of intermediate precision
CVIP Coefficient of variation of intermediate precision or (RSDIP) Relative Standard Deviation of intermediate precision
k' Capacity
LCL Lower Limit Control LOD Limit of Detection LOQ Limit of Quantification
Mt The amount of drug releases at time
M ∞ The amount of drug released after infinite time
n The number of repetition per series or the releases exponent p The number of series
Q Acceptance limit of drug release
R Resolution
R (%) Recovery percent Rb Relative bias
RT Retention time
rpm rotation per minutes σˆ² B Variance of between series σˆ ² W Variance within – series
σ2 Variance
Sd Standard deviation
SdR Standard deviation of recovery
µT True value
V Satterthwaite’s approximation of degree of freedom ULC Upper Limit Control
λ Acceptance limit xi Individual result
X Introduced Concentration
Y Back – calculated concentration (mg/ml)
y- Mean of response (area or absorbance) in level ý Mean of response (area or absorbance) in series ¥ Mean of mean for recoveries
Yij Individual recovery at each level
R Rang
r² Correlation coefficient R¯ Rang of Inter – days
CIRm Confidence interval for recoveries mean
List of Tables
I Analytical methods available in major pharmacopeias in general chapters II Pharmaceuticals analysis
III Validation of analytical method based on ICH and SFSTP as Full validation IV Summary for comparison between Types of validation of analytical methods
V Test of the existence of a significant slope VI Test of validity of the regression line
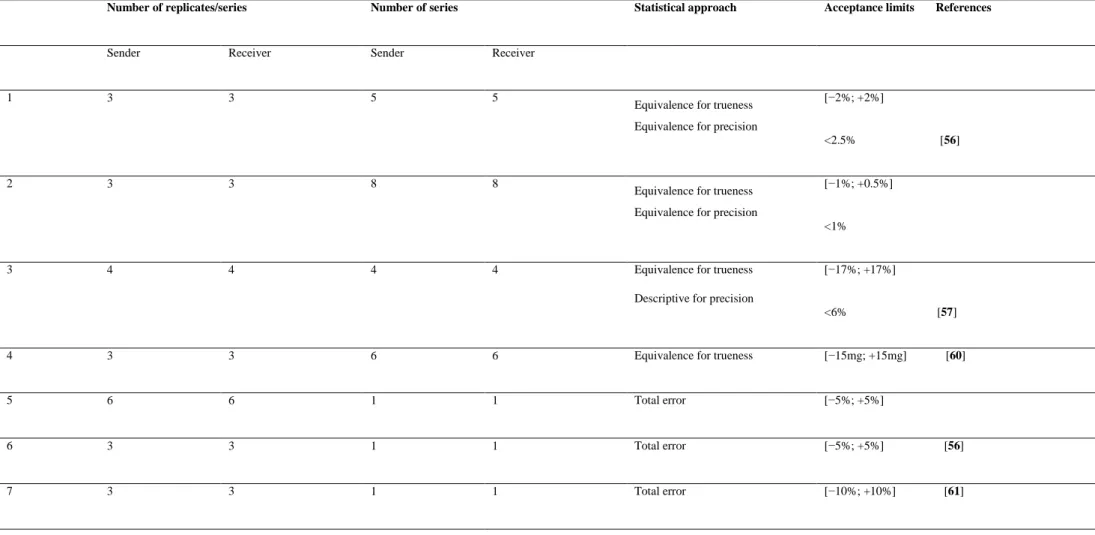
VII The statistical approaches, experimental designs and acceptance limits used in analytical methods transfer from the scientific literature.
VIII Results of the validation of the method dedicated to the determination of DS percent release in tablets form using the linear regression model through 0 fitted with high concentration
IX Results of robustness study
X Results of validation of LC method for impurities profile based on classical approaches .
XI Results of real content of API in tablet
XII Release of DS in buffer stage namely phosphate buffer pH: 6.8. (N = 18) XIII Comparative between Validated and USP Methods
XIV Comparative between Validated and USP Methods XV Descriptive approaches at 45 minutes
XVI Bioequivalence In vitro Approach of Receiver versus Sender XVII Intermediate Precision
XVIII R - Chart Control to accept the transfer XIX Drug release mechanism
XX Results of transfer of analytical method for impurities assay
XXI Summary of partial validation of analytical method’s compendial based on EDQM
XXII System suitability of compendial method
XXIII Partial validation of HPLC method for assay of API based on USP and EDQM
XXIV Partial validation of HPLC method for impurities profile based on USP and EDQM
XXV Partial validation of UV spectrophotometric method for assay of drug dissolution testing based on USP and EDQM
XXVI Application of compendial method
XXVII Pharmaceutical Products List based on BCS
XXVIII Procedure and apparatus of dissolution profiles
XXIX Results dissolution profiles of reference and generic of pharmaceutical products based on USP and Method dependent EP condition
List of Figure
1 Life cycle of analytical development
2 Flowchart of the steps used to evaluate the response function using the classical validation methodology.
3 Accuracy profiles
4 Chromatogram A: Standard of DS (0.054 mg/ml) in acid stage medium (HCl 0.1N) 5 Chromatogram B: Standard of DS (0.054 mg/ml) buffer stage medium pH: 6.8 6 Chromatogram C : DS product A (reference) in acid stage medium (HCl 0.1 N)
7 Chromatogram D: DS product B (generic 1); less than 10 % released in acid medium (HCl 0.1 N)
8 Chromatogram E: DS product C (generic 2) in acid stage medium (HCl 0.1 N) 9 Accuracy profile obtained for the validation of the HPLC – UV analytical method 10 The models of accuracy profile
11 Risk profile 12 Linear profile
13 Dissolution profile of DS product A as reference. product B as generic 1 and product C as generic 2.
14 Dissolution profile of product A at sender and receiver laboratories 15 Dissolution profile of product B at sender and receiver laboratories
16 R - chart control of dissolution data of sender and receiver laboratory of product A, respectively
17 R - chart control of dissolution data of sender and receiver laboratory of product B , respectively.
18 Chromatogram of compendial method for assay of DS (750 µg/ml) and its impurity A (100 µg/ml) in diluent (70:30 methanol : water ; v:v)
19 Linearity of HPLC method to assay of DS in tablet 20 Chromatogram of HPLC “ LOQ” (5.62 μg/ml)
22 Linearity of spectrophotometric method to assay of dissolution test of DS tablet
23 Chromatograms for application for assay and impurities of DS tables (Product A) as reference and (Product B and C ) as generics
24 Paracetamol release based on USP and EP conditions 25 Diclofenac sodium release based on USP and EP conditions 26 Ranitidine release based on USP and EP conditions
Quality control is necessary in every phase of drug development. The most important purpose of quality control in drug manufacturing is to make sure that the public can avail of safe and therapeutically effective medicines [1]. Drug manufacturing control requires high level and intensive analytical and chemical support of all stages to ensure the drug quality, efficacy and safety. These criteria for pharmaceutical products are also very important to obtain the marketing authorization of the drugs (L'autorisation de Mise sur le Marché or AMM). The number of pharmaceutical products introduced into the market by the pharmaceutical industry is increasing every year . Therefore, the development of analytical methods is essential.
Part I is a review of the literature. It shows the assay methods that may be employed in characterizing the quality of pharmaceutical products. Also this review aims to present the life cycle development of analytical methods, namely the selection of techniques , their validation , transfer , different statistical approaches for validation and transfer of analytical procedure and drugs dissolution testing .
Chapter I describes the concept of pharmaceutical quality control, the analytical methods in this domain and their role in characterizing the quality of pharmaceutical products namely assay of API, impurities profile and dissolution test.
Chapter II describes the concept and requirements of the analytical method validation. This validation is built in during its development, required specificity, required sensitivity, required accuracy, required range of analysis, required precision and required robustness to the analyst. These requirements have been described by the International Conference Harmonization (ICH).
Chapter III presents the concept, objective and type of transfer of analytical method between laboratories where the receiving laboratory should demonstrate that it can successfully perform the method.
Chapter IV describes the statistical approaches for pharmaceutical quality control. Classical and total error approaches (accuracy profile) are used in validation of analytical method , approaches are used to accept the transfer of analytical method and approaches for evaluation the drugs dissolution testing .
Figure 1. Life cycle of analytical development
I : Development of analytical procedure
- Chromatography
- Spectroscopy - miscellaneous
For - Assaying of API in dosage form - Impurities profile
- Dissolution test
II : Validation of analytical procedure Approaches: - Classical approach - Accuracy profile Criteria - Specificity - Rang - Linearity - Trueness - Precision - Accuracy - LOD and LOQ - Robustness - Ruggedness
III : Transfer of analytical procedure Approach: - Comparative testing
- Co validation between two laboratories - Verification and revalidation
- Transfer wavier
- IV : Pharmaceutical quality control - Assaying of API in dosage form - Impurities profile
- Dissolution test
Part II (experimental part) : The first main objective of my thesis is to enhance the reliability of decisions made using the results obtained from quantitative analytical methods during different steps of their life cycle, namely analytical method validation and transfer . The second main objective is to describe the partial validation of analytical methods and drug dissolution testing based on different compendia concepts.
Chapter I will be to propose an improvement of USP method for quality control of diclofenac sodium in tablet form . HPLC method will be developed and validated for determination of diclofenac sodium release (dissolution test) based on an accuracy profile (total error approach) (SFTSP 2003). This approach is used to select the most appropriate regression model with highest accuracy within well-defined acceptance limits (± 5) that this interval represents the location where % of the future results is expected to lie. On the other hand, HPLC method for impurities profile of diclofenac sodium will be developed and validated based on classical approach (SFTSP 1992). Where the development in the field of chromatographic method in the last decades has led to changes in the philosophy, structure and requirements in the monographs of drug materials in the principal pharmacopoeias: spectrophotometric method is still widely used, since the results do not contribute to the safety , quality and efficacy issues . In other means , the impact of poor quality of analytical method in drug laboratory quality control will be low quality drugs or below standard quality medicines. The high quality of pharmaceutical analytical procedure is to design a quality product and its manufacturing process to consistently deliver the intended performance of the product [2,3]
Chapter II is an experimental part due to the lack of official formal guidance or regulatory requirements in transfer of validated method where analytical methods transfer are now fully integrated into the life cycle of an analytical method in the pharmaceutical industry. Protocol, several approaches and accepted limits will be presented in thesis, namely in transfer of drugs dissolution kinetic and transfer of analytical method for impurities profile [4]. Chapter III is related to partial validation for method’s compendia
“pharmacopoeias” based on different concepts namely United State Pharmacopeia and European Directorate for the Quality of Medicines (USP , & EDQM ) concepts. The partial validation by using both concepts will be applyed for assaying of API , impurities profile and drug dissolution testing [5,6].
Chapter IV aims to present dissolution profile of pharmaceutical products based on different compendia procedures . It begins with a review of the regulatory guidelines related to drugs dissolution testing , Next , the dissolution condition for some pharmaceutical products are carried out according to USP monograph and European Pharmacopoeia recommendation (EP) [5,7].
I.1. Introduction
Quality control is an essential operation of the pharmaceutical industry. Drugs must be marketed as safe and therapeutically active formulations whose performance is consistent and predictable. New and better medicinal agents are being produced at an accelerated rate. At the same time more exacting and sophisticated analytical methods are being developed for their evaluation[1,8] . For this purpose, National Drug quality control laboratories are an assurance check that all drugs being manufacture pass quality standards set by different drug regulatory boards.
Also quality control is that part of Good Manufacturing Practice (GMP) concerned with sampling, specification testing, documentation and release procedures which ensure that the necessary relevant tests are performed and the product is released for use only after ascertaining it’s quality [9] .
Activities extend to the area of quality control laboratories (good laboratory management practices, models, e.g. for certificate of analysis and lists of laboratory equipment, and an external assessment . On other hand , globalisation and expansion in international trade present a growing need to develop global quality standards for medicines. As standards are a vital instrument for registration, market surveillance, and free movement and trade of medicines among as many countries as possible, harmonisation among the world's four major pharmacopoeias, the European Pharmacopoeias (EP) , the Japanese Pharmacopoeias (JP) , the British Pharmacopoeias (BP) and the United Standard Pharmacopoeias (USA)
I.2.The assay methods in quality control of bulk pharmaceuticals I.1.2. Definition
Analytical method is an essential operation of the pharmaceutical industry. The analytical procedure refers to the way of performing the analysis. Pharmaceutical analysis may be defined as a process or a sequences of processes to identify and/or quantify a substance or drug, the components of a pharmaceutical solution or mixture or the determination of the structures of chemical compounds used in the formulation of pharmaceutical product [1] .
I.2.2. Aim
The aim of drug quality control (with emphasis on industrial drug analysis) is the analytical investigation of bulk drug materials, the intermediates of their syntheses, products of drug research (potential pharmacons), drug formulations, the impurities and degradation products of drugs, biological samples containing the drugs and their metabolites. With the aim of obtaining data which can contribute to the high quality, the maximum efficacy , maximum safety of drug therapy and the maximum economy of the production of drugs [10,1] .
I.2.3. Regulatory expectations and guidelines
Pharmaceutical manufactures utilize USP , EP , JP , B, Food and drugs administration (FDA) guidelines , International pharmacopeias , Society French for Science and Techniques of Pharmaceuticals (SFSTP) and International Conference Humanization (ICH) for testing of raw material and final product . The analytical methods available in majors pharmacopeias as generals chapters were summarized in Table I [6,7] .
Table I : Analytical methods available in major pharmacopeias in general chapters Techniques USP EP Chromatography Liquid chromatography Gas chromatography Thin-layer chromatography 621 621 621 2.2.29 2.2.28 2.2.27 Spectroscopy Infrared spectrophotometry Near infrared spectrometry
Visible and ultraviolet spectrophotometry Mass spectrometry Raman spectrometry Plasma spectrochemistry 197 1119 851 736 1120 730 2.2.24 2.2.40 2.2.25 2.2.43 2.2.48 2.2.58
I.4. Pharmaceutical analytical methods I.4.1. Chromatography
The most characteristic feature of the development in the methodology in pharmaceutical and biomedical analysis in the past years is that various forms of high performance liquid chromatography (HPLC) became undoubtedly the most important method. This technique will continue to dominate assay of active pharmaceutical ingredient, its impurities in drugs matrix, drug deliveries and assay of drugs dissolution testing [11,12] .
Gas chromatograph-based procedures will continue to dominate residual solvents (impurities) in drugs substance and drugs products because of its specificity for identification of the solvent, but the use of alternative sample introduction techniques into a gas chromatograph will continue to expand in the near future [6] .
Ultra Performance Liquid Chromatography (UPLC) is a relatively new technique giving new possibilities in liquid chromatography, especially concerning decrease of time and solvent consumption , high sensitivity and resolution , also is used to assay of active pharmaceutical ingredient , its impurities in drugs matrix, biological fluid and assay of drugs dissolution testing [13,14] .
Among other chromatographic methods the important application field of modern TLC is the separation of the components of complex mixtures, for example, impurities and degradation products of drug materials . The speed and the resolution could be greatly improved by the introduction of special techniques, such as high-performance thin-layer chromatography (HPTLC) [15,16].
I.4.2. Spectroscopy
Direct spectrophotometric method determination such as colorimetric analysis or ultraviolet determination is widely used in pharmaceutical analysis but usually lacks selectivity . Also direct UV/VIS spectrophotometric determination of absorbance has been the traditional analytical method for dissolution testing [17].
In addition , near-infrared (NIR) spectroscopy is fast and nondestructive analytical techniques that provide chemical and physical information of virtually any matrix. In combination with multivariate data analysis these two methods open many interesting perspectives for both qualitative and
quantitative analysis [18 , 19 , 20] . On other hand dissolution behaviour of sustained release drug substance matrix tablets using near infrareds was recorded [21].
Also fourier transform infrared (FTIR), near infrared (NIR), and Raman spectroscopic techniques have been reported as the direct detection method of choice for pharmaceutical products[22,23]
Atomic absorption spectrometry can be applied for impurity tests for trace metals as well as for assay of various commonly occurring elements in pharmaceuticals [24,25].
The current state-of–the-art of Inductively coupled plasma mass spectroscopy (ICP-MS) for determination of various trace elements as impurities profile (heavy metals) present in drug and pharmaceuticals has been recorded. [26].
I.4.3. Combination techniques
In modern pharmaceutical analysis the most important application of chromatography techniques , coupled with many detectors such as fluorimetry , UV , ionic and refraction . In addition , development of HPLC and other chtromatographic techniques, coupled with mass spectrometry, is also useful in the determination of drugs and their metabolites in biological samples[27,15].
I.5 The role of assay methods in characterizing the quality of bulk pharmaceuticals The role of chromatographic and spectroscopic in pharmaceutical analysis is summarized in Table III . In brief , these analytical methods play important role in the following :
I.5.1. For assaying of API
Any substance or combination of substances used in a finished pharmaceutical product (FPP), intended to furnish pharmacological activity or to otherwise have direct effect in the diagnosis, cure, mitigation, treatment or prevention of disease, or to have direct effect in restoring, correcting or modifying physiological functions in human beings. API is controlled by analytical technique as drugs substance and drugs products .
I.5.2. For impurities profile
Impurity profile is the description of identified and unidentified impurities present in new drug substances.. According to ICH guidelines, impurities associated with APIs are classified into the following categories: (a) Organic impurities " Organic impurities may arise during the manufacturing process and or storage of the drug substance may be identified or unidentified " (b) Inorganic impurities " They can result from the manufacturing process (e.g., residual metals, inorganic salts, filter aids, etc.) " and (c) Residual solvents " Residual solvents are organic volatile chemicals used during the manufacturing process or generated during the production. " . Stability indicating method - One of the major characteristics for a quality analytic method for pharmaceuticals is its ability to determine distinctively the parent compound from the degradation products [28,29] .
I.5.3. Bioequivalence In vitro (Dissolution test)
In the drug dissolution testing area, a reference to “quality” of a product (table/capsule) is frequently made. For example, a drug dissolution test may be considered as a quality assurance and/or control test. Dissolution rate is a critical parameter of pharmaceutical dosage forms because the API needs to be dissolved before it can be absorbed. In vitro dissolution testing is important to screen formulations during development and to ensure batch-to-batch quality control during production [30, 31]. Different analytical methods were described to assay of drug dissolution testing (Table II) .
Table II : Pharmaceuticals analysis
Characterizing the quality of pharmaceuticals product Techniques used Active pharmaceutical ingredient and excepeints
Raw materials Drug product HPLC – UV spectrophotometer – Potentiometer HPLC – UPLC – CE – HPTLC – NIR Impurities Organic
Inorganic (Heavy metals ) Residual solvent
HPLC – CE – UPLC
ICP Spectroscopy, AA Spectroscopy and X-Ray
Fluorescence (XRF) Spectroscopy GC
Bioequivalence
II. Validation of Analytical Method II.1. Definition
The of validation analytical procedures is to establish that the analytical method is suitable for its intended use and consequently to prove the reliability of the results obtained within well defined limits (i.e. the proof of its suitability for the intended purpose, is an important part of the registration application for a new drug) . [32] .
II.2. Role of the analytical method validation
The terms validation and quality assurance (QA) are widely used. However, a lot of analysts and laboratories do know the exact meaning neither the difference nor the relationship between the two terms. Validating a method is investigating whether the analytical purpose of the method is achieved, which is obtaining analytical results with an acceptable uncertainty level . Analytical method validation forms the first level of QA in the laboratory.
II.3. Regulatory expectations and guidelines
The international Conference on Harmonization (ICH) of Technical Requirements for the Registration of Pharmaceuticals for Human Use which has been on the forefront of developing the harmonized tripartite guidelines for adoption in the US, Japan and EC where ICH has developed a text on the validation of analytical procedures namely Q2(R1) [32] The Food and Drug Administration (FDA) have proposed guidelines on submitting samples and analytical data for methods validation[33] . Also the United States Pharmacopoeia (USP) has published specific guidelines for method validation for compound evaluation that carries a section which describes requirements of validation of compendial methods , this document includes definitions for eight validation characteristics [6] . ISO/IEC 17025 is the most relevant ISO Standard for chemical analytical laboratories . It specifies general requirements for the competence to carry out tests or calibrations or both , The most important ones can be
found in Chapter 5.4.5 [34] . Society French for Science and Technical for Pharmaceutical described the statistical approaches for validation of analytical method [2].
The WHO published a guidelines under the title, ‘Validation of analytical procedures used in the examination of pharmaceutical materials’. It appeared in the 32nd report of the WHO expert committee on ‘specifications for pharmaceutical preparations [35] and the validation was implied according to GMP guideline[36,9].
II.4. Analytical method validation steps
The steps of methods development and method validation depend upon the type of method being developed. Several widely recognized validation criteria should be tested in order to ensure the reliability of the developed method. However the following steps are common to most types of developed method: The parameters, as defined by the ICH and other organizations. These are summarized in Table III and are described briefly in the following points
II.4.1. Specificity
It is the ability to assess unequivocally the analyte in the presence of components which may be expected to be present. Typically these might include impurities, degradants, matrix, etc. Otherwise, this is described as the ability of a method to discriminate the analyte from all potential interfering substances.
II.4.2. Response function
The response function of an analytical method is, within the range, the existing relationship between the response (signal) and the concentration (quantity) of the analyte sample [37, 38].
II.4.3. Trueness
It refers to the closeness of agreement between a conventionally accepted value or reference value and a mean experimental one. It gives information on systematic error [37, 38]. This term is called accuracy in ICH [32].
II.4.4. Precision
It is the closeness of agreement among measurements from multiple sampling of a homogeneous sample under the recommended conditions. It gives some information on random errors and it can be evaluated at two levels: repeatability and intermediate precision [39, 40] .
Repeatability expresses the precision under the same operating conditions over a short interval of time. Repeatability is also termed intra-assay precision. Intermediate precision expresses variations within laboratories, such as
different days, different analysts and different equipment.
Reproducibility expresses the precision between laboratories (collaborative studies usually applied to standardization of methodology).
II.4.5. Accuracy
It refers to the closeness of agreement between the test result and the accepted reference value, namely the conventionally true value. The Accuracy takes into account the total error, i.e. systematic and random errors, related to the test result [41, 42, 3].
II.4.6. Linearity
The linearity of the response as a function of analyte concentration (or amount) should be assessed in the range of interest. The linearity of an analytical procedure is its ability to obtain test results which are directly proportional to the concentration (amount) of analyte in the sample [33].
II.4.7. Range
The range of an analytical method is the interval between the upper and lower levels (including these levels) that have been demonstrated to be determined with precision, accuracy and linearity using the method as written. The range is normally expressed in the
same units as the test results (e.g., percentage, parts per million) obtained by the analytical method[32, 2].
II.4.8. Detection limit
The limit of detection is the point at which a measured value is larger than the uncertainty associated with it. It is the lowest concentration of analyte in a sample that can be detected but not necessarily quantified [32] .
II.4.9. Quantitation limit
The quantitation limit of an individual analytical procedure is the lowest amount of analyte in a sample which can be quantitatively determined with suitable precision and accuracy [32] .
II.4.9. Robustness
The robustness of an analytical procedure is a measure of its capacity to remain unaffected by small, but deliberate variations in method parameters and provides an indication of its reliability during normal usage. This parameter is described by classical approach and experimental design[43].
II.4.10. Ruggedness
Ruggedness is not addressed in the ICH documents. Its definition has been replaced by reproducibility, which has the same meaning. Ruggedness is defined by the USP as the degree of reproducibility of results obtained under a variety of conditions, such as different laboratories, analysts, instruments, environmental conditions, operators and materials[6].
Table III : Validation of analytical method based on ICH and SFSTP as Full validation
Characteristics Identification
Impurities Assay
Quantitative Limit Content Dissolution Accuracy Precision Repeatability Intermediate Precision Specificity Detection limit Quantization Limit Linearity Rang - - - - + - - - - + + + + + - + + + - - - - + + - - - + + + + + - - + + + + + + + + - - + (-) Signifies that this characteristic is not normally evaluated
(+) Signifies that this characteristic is normally evaluated
II.5. Types of analytical procedure validation II.5.1. Classical
All the classical validation methodologies start by the evaluation of the response function. The steps commonly performed are depicted in Figure 2 and Table IV. By means of the responses or signals obtained for each calibration standards a regression model is fitted, in general a simple linear curve (Y = aX + b). Then different steps are most often carried out, the first one is the evaluation of the homoscedasticity of the variances through all the concentration levels of the calibration standards. The linearity was measured in standard calibrations (API only ) and standard validation (API with excipient ) according to Y = ax + b the slope (a) and intercept (b) of solution of API and solution of API in matrix are compared. The next step , the random error is estimated by precision parameter according to calculation of relative standard deviation (RSD % ) and also the systemic error is estimated by trueness parameter based on calculation of recovery (R %) [2].
Figure 2. Flowchart of the steps used to evaluate the response function using the classical validation methodology (s: statistically significant; ns: not significant) [2].
2.5.1. Accuracy profile
Accuracy profile is a decision-making graphical tool aiming to help the analyst in deciding whether an analytical procedure is valid. It is based on the combination in the same graphic of the tolerance interval and the acceptability interval. Whereas, validation must cover up the complete application domain of he method, the accuracy profile combines several tolerance intervals computed at several levels of concentration.
The accuracy profile methodology is based on the concept of total measurement error, i.e. the simultaneous combination of the systematic error (measured by biases, i.e. method trueness) and of the random error (measured by RSDs, i.e. method precision) .The criterion related to total error is the result accuracy. What is needed is to give at the end of the validation step guarantees that each of the future results that the laboratory will obtain during routine analyses will be accurate enough. Therefore to reach this objective, instead of a whole set of statistical tests, the accuracy profile methodology uses only one statistical decision methodology, namely a ß-expectation tolerance interval computed at each concentration level of the validation standards. Several response functions (standard curves) are fitted by this type of validation namely the weighted (1/X²) quadratic regression , weighted (1/X²) linear regression , weighted (1/X) linear regression , linear regression after square-root transformed data , weighted (1/X) quadratic regression , linear regression after log transformed data , quadratic regression , linear regression through 0 Fitted using level 1.0 only and linear regression through 0 Fitted using the highest level only [44, 45,46, 3].
Figure 3. Accuracy profiles of the analytical method for the determination of API in dosage form for the spiked
validation standards with the linear regression model. The plain line is the relative bias ( ) the dashed lines are the 95% β-expectation tolerance limits ( ) and the dotted curves (---) represent the
acceptance limits (±5%) . The dots ( ) represent the relative back-calculated concentrations of
the validation standards.
Types IV : Summary for comparison between Types of validation of analytical methods Criteria Classical SFSTP 1992 Total error SFSTP 2003
Linearity Trueness Precision Accuracy One model Systemic error Random error Unavailable Multi – models Systemic error Random error
Systemic and random error (Total) Characteristics of validation and their accept criteria
Rang ICH (80 % – 120 %) SFSTP (60 % – 140 %) Others (1.0 % – 140 %) Trueness (Bias %) Drug substance (± 1 % ) Drug product (± 5 % ) Precision (RSD % ) Drug substance ( 1 % ) Drug product ( 2 % ) Impurities ( 5 % )
III. Transfer of analytical methods III.1. Definition
The analytical transfer is a complete process that consists in transferring an analytical procedure from a sending laboratory to a receiving laboratory. The transfer of an analytical method from a laboratory, where it was originally developed and validated, to another laboratory, which is close to an additional production site, as well as the transfer for outsourcing purposes became an important issue during the life cycle of a product . A method development process is commonly finalized by a method transfer from the developing to the routine laboratory [4]. An analytical method transfer consists in transferring a previously validated analytical method from a sending laboratory (called “sender”) mastering this method, to a receiving laboratory (called “receiver”). Experiments are made in both laboratory in order to demonstrate the acceptability of the transfer
III.2. Objective of the analytical method transfer
The transfer of analytical method is the last step before the routine use of the method at the receiving laboratory. The receiver must therefore give guarantees that he has the capacity to implement the method and, above all, that he is able to obtain reliable results. The main aim of analytical method transfers is thus to give guarantees to the laboratories as well as to regulatory bodies that each future result that will be obtained during routine analysis by the receiving laboratory will be close enough to the unknown true quantity of analyte present in the assayed sample . Other connected objectives linked to the method transfer can be to provide training and expertise to the receiving laboratory [47,4].
III.3. Regulatory expectations and guidelines
The chapter 1224 of USP represents an important facet in the lifecycle of an analytical procedure, which spans from development and gaining method understanding through validation to method transfer, incorporation into a compendium and subsequent verification [6] . The FDA has released an official guidance on how to conduct and document method
transfer [48] , In addition , the ISPE (The International Society for Pharmaceutical Engineering) design provides adequate probabilities to accept successful method transfers correctly only for relatively small error amounts [49 ,50] . In general, no detailed official guideline exists for a transfer methodology in pharmaceutical or biopharmaceutical analysis but based on ICH Q9 guideline [51], risk analysis and management should be integrated into a transfer process. ICH Q 10 describes diagram that illustrates the major features of the ICH Q10 Pharmaceutical Quality System (PQS) model. The PQS covers the entire lifecycle of a product including pharmaceutical development, technology transfer, commercial manufacturing, and product discontinuation [52].
III.4. Types of analytical method transfer
Transfer of Analytical Procedures can be performed and demonstrated by several approaches based on USP chapter (1224) [53 ,6] .
III.4.1. Comparative testing
The most common is comparative testing performed on homogeneous lots of the target material from standard production batches or samples intentionally prepared for the test (e.g., by spiking relevant accurate amounts of known impurities into samples). Such analysis is based on an agreed and preapproved transfer protocol that provides the details of the procedure, the samples that will be used, and the predetermined acceptance criteria. The data generated by both parties are compared to the acceptance criteria in order to assess the equivalence of results between the transferring and the receiving units.
II.4.2. Covalidation between laboratories
It is another approach that includes the complete or partial validation of the analytical procedures by the receiving unit . The laboratory that performs the validation of an analytical procedure is, by definition, qualified to run that method. Manufacturers can involve the
receiving unit in an interlaboratory qualification, including them as a part of the validation team and thereby obtaining data for the assessment of reproducibility.
III.4.3. Method verification or revalidation
Method verification or revalidation is another acceptable approach for transfer of a validated procedure. Transfer of analytical procedure is conceptually similar to (1226), although the Chapters ’ objectives reflect some differences in the process and documentation. General Information Chapter (1226) deals with the transfer of a pharmacopeial procedure from the compendia to a receiving unit.
III.4.4. The transfer waiver
It is an appropriately justified omission of the transfer process. It is possible to initiate and even finalize the transfer before the validation process is completed. However, the lack of complete knowledge about the variables of the procedure and particularly its robustness may complicate the transfer process by adding more variables to a system that should be as simple as possible.
Chapter IV: Statistical approaches for
pharmaceutical quality control
IV.1. Introduction
Statistical quality control has been defined as the monitoring of quality by application of statistical methods in all stages of production . Statistical methods of investigation based on the theory of probability may be used for estimating parameters , for performing tests of significance , for determining the relationship between factors , and for making meaningful decisions on the basis of experimental evidence . The selection of an appropriate method essentially depends on the type of measurement , the sampling techniques , the design of the experiment and the type of sample distribution .
IV.2. Approaches for validation of analytical procedure
SFSTP has deeply contributed to the development of validation procedures for pharmaceutical industry since 1992
IV.2.1. Classical approach based on SFSTP 1992
IV.2.1.1. Linearity : Most analytical methods are based on processes where the method produces a response that is linear and which increases or decreases linearly with analyte concentration. The equation of a straight line takes the form:
y ax b (1)
where b is the intercept of the straight line , a is the slope of the line , y is the response (ex , area , absorbance ) and x is the introduced concentration .
a. Homogeneity of variance : The homoscedasticity of the variances through all the concentration levels of the calibration and validation standards by using Cochran's C test. C calculated must be less than C tabulated (α ; 0.05 , n , p ) .
2 max 2 1 p j S C S
(2) Where , S2max: maximum of variance . 21 p j S
: Sum of variances.If the homogeneity isn’t available , we use Dixon's Q test. Considered is the probability of having an extremely high or extremely low value in the data set. To apply a Q test for bad data, The n values comprising the set of observations under examination are arranged in ascending order:
y1 <y2<…< yn
Then , y is individual value such as peak area , the statistic experimental Q-value (Q exp) is calculated. This is a ratio defined as the difference of the suspect value from its nearest one divided by the range of the values. The obtained Q exp value is compared to a critical Q-value (Q crit) found in Dixon table (α ; 0.05, n)
1 2 1 Q n y y y y (3) 1 1 Q n n n y y y y (4) .
b. Test of the existence of a significant slope: The test is to compare the variations due to regression and errors (experimental and adjustment).
Table V : Test of the existence of a significant slope (H0: a = 0)
Variations DF Sum of squares Variance F calculated
Regression 1 2 2 ( ij ) L ý y
(5) 2 2 1 L L S
(6) 2 2 l Calculated r S F S (10) Residual N– 2 2 2 2 R T I
(7) 2 2 2 R R S N
(8) Total N–1 2 2 ( ij ) T y y
(9)if F calculated > F tabulated (H0 is rejected at risk 5 % )
c. Test of validity of the regression line
Table VI : Test of validity of the regression line (H0: regression error = experimental error)
Variations DF Sum of squares Variance F calculated
Experimental Error N – p 2 2 ( ij ) E
y y (11) 2 2 E E S N p
(12) 2 2 L Calculated E S F S (15) Regression Error P – 2 2 2 2 L R E
(13) 2 2 2 L L S p
(14)if F calculated < F tabulated (H0 is accepted at risk 5% ).
d. Comparison between two slopes and intercepts ;
1 2 2 2 1 2 - a a a a t S S (16)
1 2 2 2 1 2 - b b b b t S S (17)
where , a1 is a slope for solution standards (API only) , a2 is a slope for validation solution matrix (API with excepient ) , b1 is an intercept of API , b2 is an intercept of API with excepient , S2a1 is a slope variance for API , S2a2 is a slope variance for API with excepient . S2 b1 is an intercept variance for API , S2b2 is an intercept variance for API with excepient . The comparison between two slopes and intercepts is estimated based on test student (α 0.05 , N-4) . If t calculated < t tabulated can conclude with 95 % confidence that there is no significant difference (the "null hypothesis" that a1= a2 and b1= b2 are accepted).
e. Comparison of intercepts with zero :
1
b
b S
t (18)
The comparison between two slopes and intercepts is estimated based on test student (α ; 0.05 % , N-2) . if the intercept is significantly different from 0, the adequate regression , Sb : variance of intercept , model is the simple linear regression model, whereas if not, a single point. calibration curve going through 0 can be considered as the adequate response function (y = ax).
IV.2.1.2. Accuracy : The accuracy (trueness) in classical approach is estimated by using the recovery (R%) . Also the homogeneity of recoveries variance between each level is performed. The analysis of variance for recoveries mean is estimated , In addition , the confidence interval is estimated .
% 100. ^^ ij x R µ (19) where, µ^ is the mean of the introduced concentrations and x^ is the estimate of themean concentration obtained.
The homoscedasticity of the recoveries variances through all the concentration levels of the validation standards by using Cochran's C test. C calculated must be less than C tabulated (α , n , p ) . Also , if F calculated < F tabulated can conclude with 95% confidence that there is no significant difference .
1 1 1 ¥ . p nj ij i i i Y pn
(20) ¥ (95%, 1). R Rm Sd CI t N N (21)SdR, Standard deviation of recovery , Yij is individual of recovery per each level , ¥ is a mean of recovery , N (n × p) , n is the number of repetitions per series , p is the number of series . CIRm is Confidence interval for recoveries mean [2].
IV.2.1.3. Precision: The precision in this approach is estimated based on relative standard deviation (%RSD ) . The repeatability is expressed by % RSDr in intra-series and the intermediate precision is expressed RSD IP in inter-series on [54]:
![Figure 2. Flowchart of the steps used to evaluate the response function using the classical validation methodology (s: statistically significant; ns: not significant) [2]](https://thumb-eu.123doks.com/thumbv2/123doknet/15042030.691930/41.892.209.743.95.997/flowchart-evaluate-classical-validation-methodology-statistically-significant-significant.webp)