Short Communication
AlleleCoder: a PERL script for coding
co-dominant polymorphism data for PCA
Angela M. Baldo
1*, David M. Francis
2, Martina Caramante
3,
Larry D. Robertson
1and Joanne A. Labate
11USDA, ARS, Plant Genetic Resources Unit, 630 W. North St., Geneva, NY 14456, USA, 2Department of Horticulture and Crop Science, The Ohio State University, Ohio Agricultural Research and Development Center, 1680 Madison Ave., Wooster, OH 44691, USA and3Dipartimento di Scienze del Suolo, della Pianta, dell’Ambiente e delle Produzioni Animali, Universita` degli Studi di Napoli ‘Federico II’, 80055 Portici, Napoli, Italy
Received 15 April 2011; Accepted 29 June 2011 – First published online 22 July 2011
Abstract
A useful biological interpretation of diploid heterozygotes is in terms of the dose of the common allele (0, 1 or 2 copies). We have developed a PERL script that converts FASTA files into coded spreadsheets suitable for principal component analysis. In combination with R and R Commander, two- and three-dimensional plots can be generated for visualizing genetic relationships. Such plots are useful for characterizing plant genetic resources. This method nicely illustrated the spectrum of genetic diversity in tomato landraces and the varieties categorized according to human-mediated dispersal.
Keywords:
genetic diversity; principal component analysis; single nucleotide polymorphism; SNPIntroduction
Visualizing genetic relationships among individuals is a valuable tool for germplasm characterization and man-agement. Many existing systems, e.g. multi-dimensional scaling (NTSYS; Rohlf, 2002) or principal component analysis (PCA) (GENALEX; Peakall and Smouse, 2006) accomplish this by estimating pair-wise genetic distances between individuals and plotting approximate positions in two- or three-dimensional space. A more desirable method would have a direct connection between the data points and the visualization. PCA directly plots the differences among the samples, and diagnostic
differences can be traced back to specific polymorphisms (Horne and Camp, 2004; Lin and Altman, 2004). We independently developed a similar system for visually exploring crop plant germplasm genotypic diversity. This was developed for diploid DNA sequence data, and can also be applied to diploid single nucleotide polymorphism (SNP) data.
Process
The PERL script ‘AlleleCoder.pl’ is available in Supple-mental material S1 (available online at http://journals. cambridge.org). System requirements are a computer with PERL, BioPerl, R, R Commander (including Tcl/Tk) (Stajich et al., 2002; Fox, 2005; R Development Core Team, 2011) installed; a two-button mouse is helpful
* Corresponding author. E-mail: [email protected]
qNIAB 2011
ISSN 1479-2621
Plant Genetic Resources: Characterization and Utilization (2011) 9(4); 528–530 doi:10.1017/S1479262111000839
https://www.cambridge.org/core/terms. https://doi.org/10.1017/S1479262111000839
for interacting with the 3D plot. We used versions 5.10.1 (PERL), 1.6.1 (BioPerl), 2.10.1 (R) and 1.5-4 (R commander).
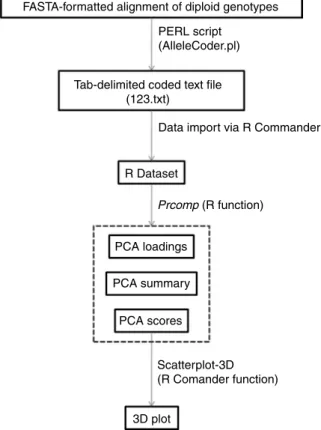
An overview of the process is shown in Fig. 1. Sup-plemental material S2 (available online at http:// journals.cambridge.org) explains software installation and use. For the input file, diploid genotypic data are represented as single unphased aligned nucleotide sequences in FASTA format (Pearson and Lipman, 1988). In unphased data, for heterozygotes the diploid genotype is known but constituent haplotypes are unknown. Alleles consist of five possible characters A, C, G, T or – (deletion). Homozygous states of the alleles are indicated in exactly that way. Heterozygous positions are specified by the appropriate IUPAC code (e.g., M R, W, . . .). Heterozygous deletions are indicated as lower-case a, c, g, t. Characters other than heterozygous indels must be uppercase. A missing data point is coded as N. The PERL script is used to convert aligned nucleotides into a text file containing columns with coded genotype relationships (see Supplemental material S2 for command line format, available online at http:// journals.cambridge.org). Genotypes are coded as
fol-lows: the homozygous state of the major (more frequent allele in the sample) allele is ‘1’, the homozygous state of any minor (less frequent allele in the sample) allele is ‘3’, the heterozygous state with one major allele is ‘2’, any heterozygous state with no major allele is ‘3’. This results in a heterozygote value (2) numerically intermediate between the two homozgotes (1, 3). Columns identical after they are coded are only represented once in the coded text file. This conserves space and reflects the fact that PCA only considers unique columns.
This 123.txt file (Fig. 1) is imported into R using R Commander (see Supplemental material S2 for menu functions, available online at http://journals.cambridge. org). A combination of the commands prncomp and prcomp are then used to perform the PCA. A summary can be generated, which shows what proportion of the variation is explained by each axis. A table with load-ings can be generated to show the contribution of each column to each principal component. The PCA scores are generated for each sample, which can then be plotted. Samples can be visualized along PCA axes in two or three dimensions. Scatterplot-3D, a part of the R Commander package, is convenient for 3D visualization. We have used this method to illustrate genetic diversity and divergence of tomato germplasm accessions held at the USDA-ARS Plant Genetic Resources Unit, Geneva, NY. Cultivated tomato (Solanum lycopersicum L.) dispersed out of Latin America beginning in the 16th century. Worldwide patterns of genetic diversity in tomato are of interest for purposes of conservation, characterization, and utilization. A sample of 50 Plant Genetic Resources Unit (PGRU) accessions (unique populations) was assembled to survey the primary centres of diversity: Chile, Ecuador and Peru (14 acces-sions), countries contiguous with the primary centres (six accessions), and secondary centres of diversity (30 accessions). The original year of seed collection ranged from 1905 to 2002. Based on SNP alleles of 67 markers (Supplemental material S3, available online at http:// journals.cambridge.org) the first three principal com-ponents explained 20, 10 and 6.6% of the variation, respectively. Genotypes from primary and secondary centres of diversity were spread along axis PC1, while samples from countries contiguous with the primary centres were distributed along axis PC3 (Supplemental Figure S1, available online at http://journals.cambridge. org). Ten percent of accessions were outliers that fell outside the three ellipsoids encompassing 90% of the variation for each group. These highly diverged geno-types originated from Peru, Ecuador, USA, Europe and Asia. None of the three a priori defined groups should be viewed as a poor source of tomato genetic diversity in PGRU’s collection. Results for major outliers (AVRDC #6, Peto 460 and PI 258478) were similar to PCA via a
FASTA-formatted alignment of diploid genotypes PERL script
(AlleleCoder.pl)
Tab-delimited coded text file (123.txt)
Data import via R Commander
R Dataset Prcomp (R function) PCA loadings PCA summary PCA scores Scatterplot-3D (R Comander function) 3D plot
Fig. 1. Flow diagram of process used to implement and dis-play PCA of genetic diversity. Output files generated by R are enclosed in the hatched box (PCA loadings, PCA sum-mary, PCA scores). ‘PCA scores’ is the file used to display a scatter plot of relationships.
AlleleCoder: a PERL script for PCA 529
https://www.cambridge.org/core/terms. https://doi.org/10.1017/S1479262111000839
covariance matrix using an independent set of 49 DNA sequences (Labate et al., 2011).
Conclusion
AlleleCoder in conjunction with PCA is a useful tool for characterizing diversity among closely related genetic resources, including individuals, populations and species. One advantage of this method is that if a particular axis (i.e. for any of the principal components) separates the data in a biologically meaningful way, those poly-morphisms that contribute to that principal component can be identified from the table of PC loadings and used as diagnostic markers. Another advantage of this method is that it accepts unphased polymorphisms, which is helpful when analyzing small sample sizes or data sets comprising species rather than populations.
Acknowledgements
We thank Susan M. Sheffer, Paul W. Kisly and Warren F. Lamboy for excellent technical assistance. This research was supported by the Tomato Crop Germplasm Committee (CGC), CRIS Project no. 1910-21 000-019-00D and by the Agriculture and Food Research Initiative Applied Plant Genomics CAP Program of USDA’s National Institute of Food and Agriculture Grant no. 2009-85 606-05 673. Proposal no. 2010-03 613. Solanaceae Coordinated Agricultural Project (SolCAP), ‘Translating Solanaceae sequence diversity and trait variation into
applied outcomes through integrative research, edu-cation, and extension’. USDA is an equal opportunity provider and employer.
References
Fox J (2005) The R commander: a basic statistics graphical user interface to R. Journal of Statistical Software 14: 1 – 44. Horne BD and Camp NJ (2004) Principal component analysis for
selection of optimal SNP-sets that capture intragenic genetic variation. Genetic Epidimiology 26: 11 – 21. Labate JA, Sheffer SM, Balch T and Robertson LD (2011)
Diversity and population structure in a geographic sample of tomato accessions. Crop Science. doi:10.2135/ cropsci2010.05.0305 (in press).
Lin Z and Altman RB (2004) Finding haplotype tagging SNPs by use of principal components analysis. American Journal of Human Genetics 75: 850 – 861.
Peakall R and Smouse PE (2006) GENALEX 6: genetic analysis in Excel. Population genetic software for teaching and research. Molecular Ecology Notes 6: 288 – 295.
Pearson WR and Lipman DJ (1988) Improved tools for biological sequence comparison. Proceedings of the National Academic Sciences USA 85: 2444 – 2448.
R Development Core Team (2011) A Language and Environment for Statistical Computing. Vienna, Austria. R Foundation for Statistical Computing. http://www.R-project.org.
Rohlf FJ (2002) NTSYSpc: Numerical Taxonomy System, Version 2.1. Setauket, NY: Exeter Publishing, Ltd. Stajich JE, Block D, Boulez K, Brenner SE, Chervitz SA,
Dagdigian C, Fuellen G, Gilbert JG, Korf I, Lapp H, Lehva¨slaiho H, Matsalla C, Mungall CJ, Osborne BI, Pocock MR, Schattner P, Senger M, Stein LD, Stupka E, Wilkinson MD and Birney E (2002) The Bioperl toolkit: Perl modules for the life sciences. Genome Research 12: 1611 – 1618.
A. M. Baldo et al. 530
https://www.cambridge.org/core/terms. https://doi.org/10.1017/S1479262111000839