HAL Id: hal-00298082
https://hal.archives-ouvertes.fr/hal-00298082
Submitted on 13 Jul 2007
HAL is a multi-disciplinary open access
archive for the deposit and dissemination of
sci-entific research documents, whether they are
pub-lished or not. The documents may come from
teaching and research institutions in France or
abroad, or from public or private research centers.
L’archive ouverte pluridisciplinaire HAL, est
destinée au dépôt et à la diffusion de documents
scientifiques de niveau recherche, publiés ou non,
émanant des établissements d’enseignement et de
recherche français ou étrangers, des laboratoires
publics ou privés.
recorded in a raised bog in south-west Sweden during
the past 1700 years
R. de Jong, K. Schoning, Siwan Björck
To cite this version:
R. de Jong, K. Schoning, Siwan Björck. Increased aeolian activity during humidity shifts as recorded
in a raised bog in south-west Sweden during the past 1700 years. Climate of the Past, European
Geosciences Union (EGU), 2007, 3 (3), pp.411-422. �hal-00298082�
www.clim-past.net/3/411/2007/
© Author(s) 2007. This work is licensed under a Creative Commons License.
of the Past
Increased aeolian activity during humidity shifts as recorded in a
raised bog in south-west Sweden during the past 1700 years
R. de Jong1, K. Schoning2, and S. Bj¨orck1
1Geobiosphere Science Centre, Quaternary Sciences, Lund University, Sweden
2Department of Physical Geography and Quaternary Geology, Stockholm University, Sweden
Received: 19 February 2007 – Published in Clim. Past Discuss.: 27 February 2007 Revised: 25 June 2007 – Accepted: 5 July 2007 – Published: 13 July 2007
Abstract. Analyses of testate amoebae and aeolian
sedi-ment influx (ASI) were used to reconstruct effective humid-ity changes and aeolian activhumid-ity in the coastal zone of south-west Sweden. Cores were taken from an ombrotrophic peat sequence from the Undarsmosse bog. Since both types of analysis were carried out on the same core, a direct com-parison between humidity fluctuations in the bog and aeo-lian activity was possible, potentially providing detailed in-formation on atmospheric circulation changes in this region. Relatively wet bog surface conditions occurred from around 1500 to 1230 and 770 to 380 cal. yrs BP, whereas dry con-ditions dominated from ca. 1630 to 1530, 1160 to 830 and 300 to 50 cal. yrs BP. The transitions between these phases occurred within 60–100 years and are characterised by a ma-jor change in the testate amoebae assemblages. A watertable reconstruction was used to study the hydrological changes at the bog surface in more detail. ASI peak events were re-constructed around 1450, 1150, 850 and after 370 cal. yrs BP. Most interestingly, these aeolian activity peaks started during the recorded hydrological transitions, regardless of the direc-tion of these shifts. Our results therefore suggest that humid-ity shifts in this region were associated with temporary in-tensifications of atmospheric circulation during the past 1700 years. Several ASI peaks apparently coincide with reduced solar activity, possibly suggesting a solar related cause for some of the observed events.
1 Introduction
Storm frequency and intensity in the coastal regions of south-ern Scandinavia are mainly controlled by the position of the westerly storm tracks in the North Atlantic and the frequency of atmospheric blocking. Since cyclones exert an important control on summer and winter temperatures (J¨onsson and
Correspondence to: R. de Jong
(rixt.de [email protected])
Fortuniak, 1995) and precipitation, the proximity of cyclone tracks and the intensity and frequency of generated storms form a major control on the climate in south-west Sweden. To explain climatic changes occurring in this region there-fore, information is needed on parameters that are related to climate, such as precipitation and evaporation and storm frequency and intensity. Knowledge on these climatic pa-rameters could lead to increased understanding of changes in atmospheric circulation in the North Atlantic region.
Study sites along the south-west coast of Sweden are ide-ally placed to register changes in atmospheric circulation pat-terns. Changes in effective humidity in north-west Europe have been reconstructed from peat bogs (e.g. Van Geel et al., 1996; Hughes, 2000; Mauquoy et al., 2002a; Barber et al., 2003; Borgmark, 2005; Charman et al., 2006). Om-brotrophic peat bogs in particular appear to be good archives for humidity changes, since their water supply is entirely dependent on precipitation and therefore reflect changes in this parameter (Barber, 2003). Furthermore, lake studies in south-central Sweden using isotope analysis (Hammarlund et al., 2003; Sepp¨a et al., 2005) or stratigraphically based lake level reconstructions (Digerfeldt, 1988; Almquist-Jacobson, 1995) also provide estimates of effective humidity through time.
Storm frequency and intensity in Scandinavia have been reconstructed indirectly by studying the development of dune areas, in particular the timing of the onset of dune forma-tion. However, other factors such as human impact and sea level variations have also been mentioned as causes for dune formation (Clemmensen et al., 2001a, b; Clarke and Ren-dell, 2006). Dune development studies have been carried out along the western European coastline (e.g. Clemmensen et al, 2001a, b; Wilson et al., 2001, 2004; Clarke et al., 2002; Clarke and Rendell, 2006) and show broad agreement on the timing of dune development phases. A different approach to reconstruct aeolian activity has been shown by Bj¨orck and Clemmensen (2004), who studied two raised bog sites in south-west Sweden. They reconstructed the sand content of
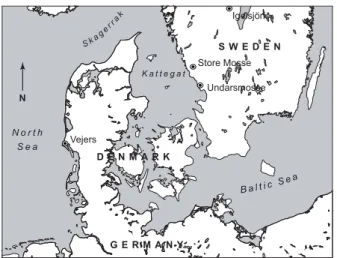
K a t t e g a t S ka g er r ak N o r t h S e a B a l t ic S e a S W E D E N D E N M A R K G E R M A N Y N Igelsjön Store Mosse Undarsmosse Vejers
Fig. 1. map showing the location of the Undarsmosse and Store Mosse bogs on the south-west coast of Sweden. The locations of two other sites mentioned in the text (Vejers dunefield, lake Igelsj¨on) are also shown.
peat samples and interpreted these as a proxy for aeolian sed-iment influx (ASI), since minerogenic material could only have been transported to the centre of these bogs by wind. However, apart from climatic factors, human land use may also exert a control on ASI by affecting sediment availability (De Jong et al., 2006).
For the area of north-west Europe there are thus a num-ber of proxy records available on humidity and storminess changes. However, most records available from south Scan-dinavia focus on long term climatic trends. Not much is known about the shorter term fluctuations that occurred dur-ing more recent time. Furthermore, a comparison between the different datasets from dune areas, lakes and peat bogs is difficult due to inherent differences in dating methods and uncertainties in chronology. Therefore it is not easy to de-duce the relation between the reconstructed climatic param-eters directly.
Here we present a study in which bog surface humid-ity fluctuations and aeolian activhumid-ity have been reconstructed from the same core from a raised bog site, the Undarsmosse bog, in south-west Sweden (Fig. 1). Testate amoebae anal-ysis was used to reconstruct relative changes of the bog sur-face wetness status, which reflects the hydrological balance of the bog. ASI analysis was used to reconstruct aeolian sedi-ment influx, a proxy for storm frequency and/or intensity. To study the regional pattern of aeolian activity, the ASI record from the Store Mosse bog, also situated in the coastal zone of Halland, is presented here as well (Fig. 1). We show that during the past 1700 years hydrological shifts have been ac-companied by increased aeolian activity in this region. We discuss the possible causes for this relation and the implica-tions for the characteristics of atmospheric circulation during these shifts.
2 Site description
2.1 Undarsmosse bog
The Undarsmosse bog is situated on the coastal plain of Hal-land at 1.5 km from the present coastline (Fig. 1). The beach areas and the coastal plain are characterised by beach ridges and extensive dune areas, wave reworked tills, moraine ridges and bedrock outcrops (P˚asse, 1987, 1988). The study site is an ombrotrophic bog situated at 20 m above sea level. The areal extent of peat deposits is ca. 120 ha. The mod-ern bog surface is, however, approximately only half that size due to extensive peat cutting which started around AD 1925, when a deep drainage channel was dug along the east-ern margins of the bog. However, historical records indicate that peat cutting had commenced already before that time (Adern, 1973). Cores were taken in the untouched part of the bog in the northern central part of the basin. Vegetation here is dominated by Sphagnum in the bottom layer and Calluna
vulgaris and other Ericaceae in the field layer.
2.2 Store Mosse bog
The Store Mosse bog (Fig. 1) is situated on the eastern limit of the coastal plain at the transition to the higher upland area in the east. The coastal plain is ca. 12 km wide here and is characterised by sandy and silty wave-reworked glacial de-posits (P˚asse, 1989). Active sand dune areas are found at a distance of 6 km to the west and south-west. The total areal extent of fen and peat deposits is ca. 240 ha. The peat bog surface has been subjected to severe peat cutting, so that only narrow ridges of the original peat surface remain. Cores were taken from such a ridge in the northern central part of the peat bog, where the disturbance of the sediment was thought to be relatively small. However, due to the intense drainage and peat cutting, conditions at the coring site are dry. The vege-tation is dense and dominated by Calluna vulgaris and other heath types in the field layer. Tall birch and pine trees grow in the direct vicinity of the coring site. A detailed description of the study sites is provided in De Jong et al. (2006) and De Jong (2007)
2.3 Climatological setting
The province of Halland is strongly affected by westerlies, resulting in a mild oceanic climate with cool summers (16◦C
July average temperature) and relatively mild winters (–4◦C
January average temperature). Annual precipitation near the Undarsmosse bog is around 800–900 mm yr−1, whereas pre-cipitation near the Store Mosse bog is higher, between 1000 and 1200 mm yr−1. The mean number of days with snow cover varies between 75 and 100 days (Raab and Vedin, 1995). The weather is, however, extremely variable being controlled by the frequency, intensity and position of the passing cyclones. Analysis of geostrophic wind speeds in south Sweden from 1881 to 1997 shows that winds from
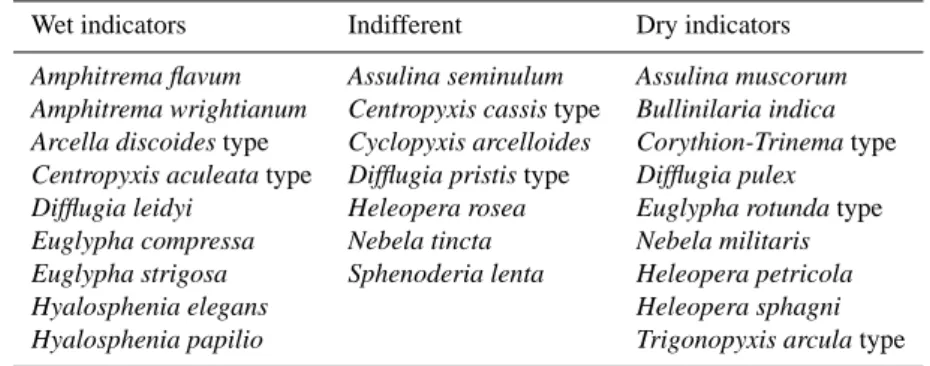
Table 1. The testate amoebae are grouped into three different wetness categories based on their wetness preferences on peat bogs.
Wet indicators Indifferent Dry indicators
Amphitrema flavum Assulina seminulum Assulina muscorum
Amphitrema wrightianum Centropyxis cassis type Bullinilaria indica
Arcella discoides type Cyclopyxis arcelloides Corythion-Trinema type
Centropyxis aculeata type Difflugia pristis type Difflugia pulex
Difflugia leidyi Heleopera rosea Euglypha rotunda type
Euglypha compressa Nebela tincta Nebela militaris
Euglypha strigosa Sphenoderia lenta Heleopera petricola
Hyalosphenia elegans Heleopera sphagni
Hyalosphenia papilio Trigonopyxis arcula type
a westerly direction dominated the wind spectrum entirely and the relative storm frequency was highest between Octo-ber and March (Alexandersson et al., 1998; 2000; Nilsson et al., 2004). These westerly storm winds are caused by cy-clones passing north of Halland towards the east (J¨onsson, 1994). Easterly winds of storm force occasionally occur when cyclones pass south of Halland, and are often associ-ated with a high pressure field situassoci-ated over northern Scandi-navia. However, during the past century easterly storm winds (geostrophic wind speed >20 m s−1)have been rare (Nilsson et al., 2004).
3 Methods and materials
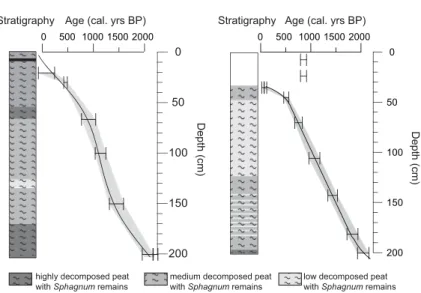
Corings were carried out in the central part of the bogs us-ing a Russian peat sampler (7.5 cm Ø). The cores were taken from two parallel holes with sufficient overlapping to ensure full stratigraphic recovery. The cores were described in detail in the field and stored in a deep freezer. The cores from the Undarsmosse bog were cut into 2 cm segments in the upper meter of the core and 1 cm segments in the lower part. The total depth of organic deposits was 339 cm. The cores from the Store Mosse bog were cut in 1 cm segments throughout the core. At this site the total thickness of the organic de-posits was 350 cm. Details on sediment characteristics for peat representing the last ca. 2000 years are shown in Fig. 2 for both localities.
Each segment was sampled for ash-free organic bulk den-sity, ignition residue and the mineral grain content. Pollen analysis was carried out on samples from both cores fol-lowing standard methods as described by Berglund and Ralska-Jasiewiczowa (1986) and Moore et al. (1991), with an overnight cold HF treatment to ensure that quartz parti-cles were dissolved. Testate amoebae analysis was carried out on samples from the Undarsmosse bog only, at 29 levels in the upper 160 cm of the core. ASI was determined at all levels for both study areas.
3.1 Testate Amoebae analysis
The testate amoebae sample preparation follows Charman et al. (2000) and Lycopodium spores were added to the sam-ples. At least 150 specimens from the 15µm-300µm sieve residues were identified in each sample following the taxon-omy of Grospietsch (1958) and Charman et al. (2000). The testate amoebae were divided in three hydrological groups: dry indicators, wet indicators and indifferent, based on their ecological wetness preferences (Table 1). This division was applied in order to distinguish major changes in the wetness status of the bog surface. The wetness classification is based on ecological information from Bobrov et al. (1999), Char-man et al. (2000) and CharChar-man et al. (2007). Variations in the watertable were reconstructed using the transfer function from Charman et al. (2007), which is based on the relation-ship between the depth below the peat surface and the depth of the water table in modern testate amoebae assemblages from European bogs. The water table was calculated using tolerance downweighted weighted averaging (WA-Tol) and errors were estimated with 1000 bootstrap cycles.
3.2 ASI analysis
Ignition residues from all samples were rinsed in HCl 10% and analysed under a 50x zoom stereomicroscope. All quartz particles >125 µm were counted. In the Store Mosse sam-ples the fraction from 80–125 µm was also counted since fewer grains were found in these samples. However, in the comparison between the ASI records we only used the frac-tion >125 µm. The maximum grain-size was measured at all levels. Mineral grain influx values were calculated us-ing the sample resolution provided by the age-depth models (Fig. 2) and volume measurements from each sample. ASI is expressed as the number of grains cm−2yr−1. A detailed method description is provided in De Jong et al. (2006).
Table 2. Radiocarbon dates from the Undarsmosse and Store Mosse bogs, calibrated ages and error margins. The radiocarbon dates were calibrated with the IntCal04 calibration curve (Reimer et al., 2004).
Depth (cm) 14C age Cal. age BP (+/–2σ ) Lab. No.
Undarsmosse bog 20–22 175+/–50 170+/–160 LuS-5839
30–31 490+/–35 525+/–35 Poz-3593
66–68 1055+/–50 990+/–90 LuS-5840
100–101 1250+/–40 1175+/–105 Poz-3594
150–151 1605+/–60 1490+/–140 LuS-5841
200-201 2150+/–40 2265+/–45 or 2105+/–105 Poz-3595
Store Mosse bog 4–5∗ 990+/–50 882+/–101 LuS 6409
26–27∗ 985+/–40 878+/–83 LuS 6410 35–36 140+/–40 105+/–50 or 225+/–60 LuS 6619 45–46 470+/–40 507+/– 46 LuS 6449 70–71 850+/–40 743+/–60 LuS 6411 105–106 1145+/–40 1070+/– 100 LuS 6412 142–143 1540+/–50 1435+/– 100 LuS 6413 181–182 1905+/–40 1830+/–100 LuS 6414 200–201 2095+/–50 2045+/– 115 LuS 6620 ∗
Dates at these levels were considered to be too old and were disregarded in the age-depth model.
200 150 100 50
0
highly decomposed peat with Sphagnum remains
medium decomposed peat with Sphagnum remains
Depth (cm)
Age (cal. yrs BP) Stratigraphy
200 150 100 50
0
low decomposed peat with Sphagnum remains
0 500 100015002000
0 500 100015002000
Depth (cm)
Stratigraphy Age (cal. yrs BP)
Undarsmosse bog Store Mosse bog
Fig. 2. Stratigraphy and age models for the Undarsmosse and Store Mosse bog. The upper 30 cm in the Store Mosse bog was omitted from the stratigraphy since this layer is though to have been cut from a deeper adjacent peat section, and placed on the surface to dry. This is indicated by the erroneously old ages, as wel as in the pollen assemblage, organic bulk density values and ASI record.
3.3 Pollen analysis
At each analysed level a minimum of 500 pollen grains were counted. In this study, the total percentage of pollen types indicating crop cultivation (Secale, Cerealea) and grassland areas (Poaceae, Taraxacum, Plantago lanceolata, Potentilla,
Rumex acetosa/acetosella) are shown separately, since they
reflect different aspects of land use. Grazing on heath lands is not taken into account here, although this certainly occurred in the area. However, due to the abundant occurrence of
Cal-luna in the bog vegetation, these variations are not only
in-dicative of land use changes. A detailed interpretation and presentation of the complete pollen records can be found in De Jong et al. (2006) and De Jong (2007).
3.4 Chronology
The age-depth model for the Undarsmosse bog is discussed in De Jong et al. (2006), and the part covering the last ca. 2000 years is shown in Fig. 2. Dating of the upper
Arcella discoides 10 Hyalosphenia papilio 10 20 Amphitr ema flavum 20 40 60 Cal. y rs BP 0 100 200 300 400 500 600 700 800 900 1000 1100 1200 1300 1400 1500 1600 Cycl opyxi s arcel loides 10 20 30 Assulina seminulum 10 20 Assul ina m uscorum 10 20 30 40 Cor ythion-Trinema type 10 20 30 Trigonopyxi s arcul a type 10 20 ye a rs A D 300 400 500 600 700 800 900 1000 1100 1200 1300 1400 1500 1600 1700 1800 1900 Difflugia pulex 20 40 60 Amphitr ema wr ightianum 10 % of total assemblage
Wet indicators Indifferent Dry indicators
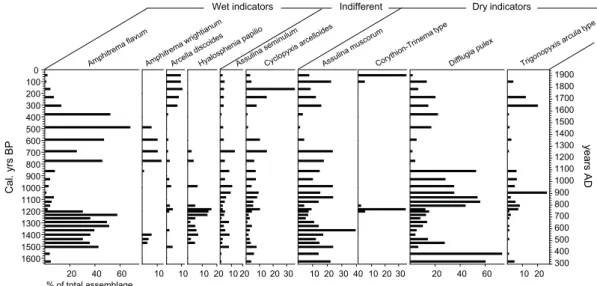
Fig. 3. The most common testate amoebae at Undarsmosse shown as the percentage of total testate amoebae plotted on common timescale (right y-axis) and cal. yrs BP (left y-axis). The testate amoebae are grouped according to their ecological wetness preferences.
160 cm of the core is based on five radiocarbon dates on om-brotrophic peat (Table 2). The model is a combination of a seventh and tenth degree polynomial fit.
For the Store Mosse record nine dates on ombrotrophic peat were available for the past ca. 2000 years (Fig. 2 and Table 2). However, the upper two dates provided ages that were considered too old and these are not included in the age model. We believe that these dates may be too old because the peat from which the samples were taken was cut in the adjacent cutting trench and subsequently placed on the sur-face of the ridge (coring location) to dry. Pollen analysis has shown that the upper ca. 30 cm of the core, where these sam-ples were taken, has a pollen spectrum that is comparable to the spectrum at 80–90 cm depth. The level of the “orig-inal” bog surface was set at 32 cm depth, based on changes in ash-free organic bulk density, ASI and pollen analysis (not shown). The age of this level was set at 20 cal. yrs BP, the time when peat cutting intensified in this region (De Jong, 2007). The true age of this level is not known though.
The age model for the Store Mosse bog is based on a linear function, connected to a ninth degree polynomial function between 50 and 32 cm depth. All radiocarbon dates were calibrated using the IntCal04 calibration curve (Reimer et al., 2004) as implemented in the OxCal 3.10 program Bronk Ramsey, 1995; Bronk Ramsey, 2001). The error margin en-velopes in Fig. 2 are based on linear interpolations of the er-ror bars for the 95.4% confidence level. These erer-ror margins should be considered when events reconstructed at different sites are compared. Ages mentioned in the text refer to calen-dar years before 1950 (cal. yrs BP), unless stated otherwise.
4 Results
4.1 Effective humidity
The reconstructed effective humidity changes (Fig. 3) are in-dicative of the hydrological balance of the bog and its wet-ness status. Three periods with mainly dry conditions, from ca. 1630 to 1530, 1160 to 830 and 300 to 50 cal. yrs BP, are recognised in the investigated record. During these periods the dominating testate amoebae are Difflugia pulex, Assulina
muscorum and Trigonopyxis arcula type (Fig. 3). Two
peri-ods with mainly wetter conditions in between the dry phases are also recognised: from ca. 1500 to 1230 and 770 to 380 cal. yrs BP. During the wet phases the testate amoebae assem-blages are strongly dominated by Amphitrema flavum with
Amphitrema wrightianum and Hyalosphenia papilio as most
common associated species (Fig. 3). The uppermost sample (50 cal. yrs BP) is not reliable due to modern drainage of the bog. Testate amoebae concentration and influx values were also calculated, but these did not provide additional informa-tion and are not shown here.
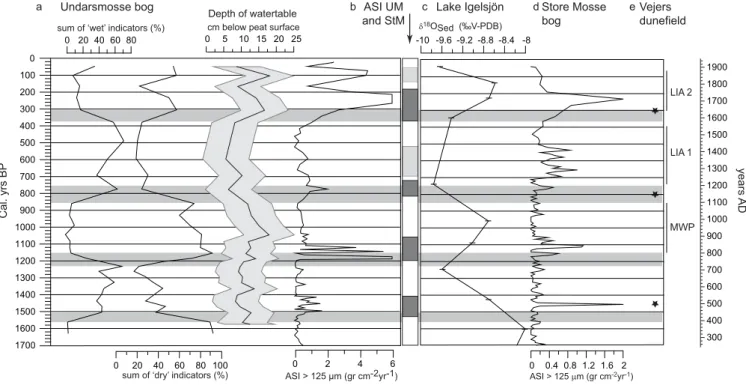
In Fig. 5 the changes in testate amoebae assemblages have been summarized in two curves reflecting the effective hu-midity changes. These show the alternating dominance of wet and dry indicator species. The curves are characterised by periods of 300–400 years of relatively dry/wet conditions, followed by rapid (60–100 years) transitional phases (shaded areas in Fig. 5). In Fig. 5a the watertable reconstruction is also shown, revealing a similar general pattern of alternating wet and dry conditions. However, whereas the testate amoe-bae assemblages can be used to identify major hydrological shifts, the watertable reconstruction provides more detailed information on the character of the shifts and on short-term variability.
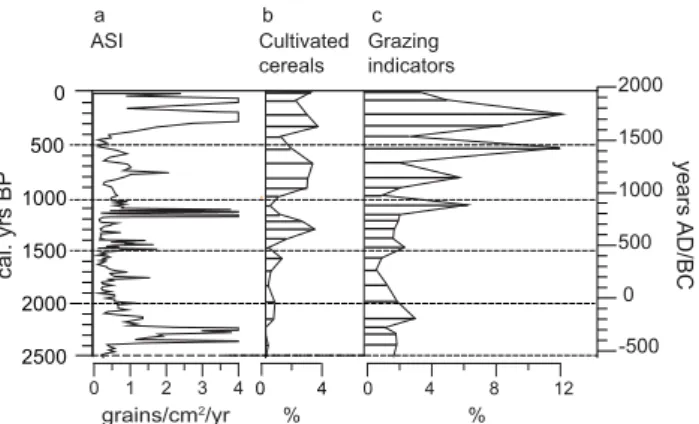
0 4 8 12 2000 1500 1000 500 0 500 1000 1500 2000 2500 0 0 4 -500 grains/cm2 /yr 0 1 2 3 4 Cultivated cereals Grazing indicators cal. yrs BP years AD/BC a b c ASI % %
Fig. 4. Comparison between aeolian sediment influx data (ASI) and pollen types indicating land use. Shown are the total pollen percentage for pollen types indicating (b) crop cultivation (Secale, Cerealea) and (c) grassland areas (Poaceae, Taraxacum, Plantago lanceolata, Potentilla, Rumex acetosa/acetosella).
The effective humidity reconstructions from this study have also been compared to records from Lake Igelsj¨on (Figs. 1, 5c), south central Sweden (Hammarlund et al., 2003; Sepp¨a et al., 2005). Here isotopic variations of
δ18Osedimentwere interpreted as a proxy for the ratio between precipitation and evaporation from the lake basin (Hammar-lund et al., 2003). This reconstruction provides a proxy that is comparable to the testate amoebae wetness indicators from this study. Figure 5 shows that the variations observed at Un-darsmosse bog are reflected at the Igelsj¨on site, although the comparison is complicated by the low resolution in the lake record. Nevertheless, the similarities between the records may indicate that the humidity fluctuations are of a regional character. The timing of transitions to wet periods (1500 and 770 cal. yrs BP) recorded here are also coherent with “wet shifts” recorded in many European bog sites (e.g. Hughes et al., 2000; Barber et al., 2003 and references therein), as well as with the classic recurrence surfaces recognised by Granlund (1932) in south Swedish bogs.
4.2 Aeolian activity
The results from the ASI analysis from the Undarsmosse bog are shown in Figs. 4 and 5. The ASI record is tentatively in-terpreted as a proxy for winter conditions (Bj¨orck and Clem-mensen, 2004). When bogs are frozen and snow covered, sand grains can be transported more easily over the other-wise irregular and vegetated bog surfaces. Flat and open ar-eas such as beaches and elevated arar-eas such as dunes, on the other hand, would lose most of their snow cover dur-ing strong winds, thereby enabldur-ing wind erosion of the min-eral particles underneath. Snow drifting, or niveo-aeolian transport, would greatly facilitate the transport of large sand grains over the bog surface. Since the grainsizes under con-sideration here (>125 µm) are generally transported as
bed-load (Tsoar and Pye, 1987), thus saltating or creeping, it is difficult to explain the occurrence of these grains in the cen-tral part of large bogs otherwise. So, although exceptional wind speeds may transport medium size grains over some distance during all seasons, the majority of the sand grains have most likely been transported under niveo-aeolian con-ditions (cf Dijkmans, 1990; Lewkowicz, 1998).
In Fig. 5 the results are shown for ASI influx at Un-darsmosse bog, including all sand grains >125 µm for the last 1700 years. For comparison the ASI data from the Store Mosse bog (Figs. 1, 5d) and the timing of onset of dune de-velopment at Vejers dunefield, west Denmark (Figs. 1, 5e), are also shown (Clemmensen et al., 2001a, 2006). The tim-ing of ASI peaks at the two bog sites is remarkably similar despite the different settings of each site and the distance be-tween them of ca. 60 km. Small differences in timing of the events are well within the range of dating errors. Peak events are recorded from around 1500–1400, 1180–1100, 850–700 and after 370 cal. yrs BP. The largest peaks occur around 1150 and 250 cal. yrs BP. However, since these peaks take place at a transition to dry conditions (Sect. 5.2) it is not pos-sible to obtain certainty on the precise duration or the ampli-tude of these specific ASI peaks. It is known that the increase in peat humification at the transitions to generally dry condi-tions compacts the peat and also leads to a secondary decom-position (Tipping, 1995; Borgmark and Schoning, 2006). The age-depth model does not reflect such short-term fluc-tuations in peat accumulation, and the duration as well as the amplitude of these peaks may thus be overestimated. In ad-dition, it is important to realise that peak ASI events may be related to a limited number of severe storms.
A comparison to the initiation of dune activity at Ve-jers dunefield shows many apparently simultaneous events (Fig. 5). Together the curves from Halland and the record from Vejers dunefield suggest that the reconstructed peak periods reflect increased aeolian sediment transport on a re-gional scale. This could be related to changing land use, af-fecting sediment availability, or climatic factors controlling winter storm frequency and/or intensity. Unfortunately it is not possible to deduce the dominant wind direction directly during ASI peak events. The mineral composition of the sand is homogenous (quartz) and available in all wind direc-tions. However, the simultaneous onset of dune development in west Denmark during three out of four ASI peak events (Fig. 5) suggests that these ASI peaks are related to westerly wind directions, although dune reactivation phases may be more related to spring and summer storms (Clemmensen and Murray, 2006). However, before a hypothesis on the occur-rence and timing of the ASI peaks and humidity shifts can be formulated, the role of human land use has to be looked at since this potentially exerts a major control on sediment availability (Li et al., 2004).
4.3 Human land use and aeolian sediment transport Pollen analysis at the Undarsmosse site has shown that land-scape opening increased strongly after 2800 cal. yrs BP (de Jong et al., 2006). As a result, both ASI peak amplitudes and the level of “background noise” increased. This sug-gests that after 2800 cal. yrs. BP sediment availability was not a limiting factor for aeolian transport to take place. De-tailed comparisons between the ASI curves from this study and the Store Mosse bog and their respective pollen diagrams (de Jong et al., 2006; De Jong, 2007) do not show a clear link to human land use at the time of ASI peak events; on the con-trary, ASI peaks occur when land use is low (de Jong, 2007). This can also be seen in Fig. 4, where ASI and pollen per-centages indicating cereal cultivation and grassland areas can be compared directly in the Undarsmosse record. In general, ASI peaks during the past 2500 years occurred when pollen indicating crop cultivation are few or absent (De Jong, 2007; Figs. 4a–b). This can clearly be seen at the Undarsmosse site around 2300, 1500 and 1150 cal. yrs BP.
Grassland indicators are more difficult to interpret (see De Jong, 2007), but these do not show a clear relation to ASI peak events either. A detailed comparison between grass-land indicators and ASI (Figs. 4a, c) shows, that some ASI peaks are immediately followed by increases in grassland (e.g. around 2300 and 1150 cal. yrs BP), indicating that in-creased grazing could not have caused these increases of sand influx. Other ASI peaks (around 750 and 300 cal. yrs BP) do coincide with high grassland values. However, the very strong increases of grassland pollen around 1050 and 500 cal. yrs BP can not be linked to increases in the ASI val-ues, as would be expected if a causal link existed. There-fore, increases in crop cultivation or grazing areas can not be causally linked to the timing of ASI peaks. A climatic forcing of the ASI peak events is thus inferred. The strong increase of ploughed and grazed land areas, however, has undoubt-edly contributed to the high amplitude and long duration of the peaks recorded here, in particular after ca. 350 cal. yrs BP.
5 Discussion
In Fig. 5a the ASI data and effective humidity reconstructions from the Undarsmosse bog are compared. Since samples were taken from the same cores a direct comparison between the timing of events is possible. The results show that major shifts in the testate amoebae assemblages were accompanied by increased aeolian activity regardless of the direction of the shift. A possible exception is the ASI maximum recorded af-ter ca. 350 cal. yrs BP. Although the increase of ASI starts at the transition from wet to dry conditions, the largest part of the peak falls within the period after the transition. A com-parison between the watertable reconstructions and ASI fluc-tuations shows, however, that although the ASI shifts occur
during the general shift of testate amoebae assemblages, sev-eral ASI peaks tend to coincide with a temporary increase of the water table. This can be seen around 1500–1400, 1150– 1100 and around 750 cal. yrs BP, but not during the more recent ASI peaks. Although this seems to indicate a short in-crease of bog surface wetness during these three ASI peaks, the error margins of the watertable reconstruction have to be kept in mind and a more detailed interpretation of this poten-tial link is not possible.
5.1 Humidity shifts and atmospheric circulation changes The hydrological balance of the bog and its wetness status mainly depend on evapotranspiration and the amount of pre-cipitation reaching the bog surface. The climate parameters governing the bog surface wetness seem to be different in different geographical regions and climatic settings (Char-man et al., 2004; Schoning et al., 2005). In this coastal set-ting it is likely that the water balance is controlled mainly by precipitation, not summer evaporation. Here, wet conditions are interpreted as a result of wet and cool summers and/or wet winters. Dry conditions indicate a summer water deficit for evaporation, which is not counteracted by precipitation in the other seasons. Cool and wet conditions in this region are related to oceanic conditions with the frequent passage of cyclones, thus a dominance of oceanic westerly air masses. Such a situation indicates that circulation is predominantly zonal (J¨onsson, 1994). Winters may have been mild and wet and possibly dominated by an NAO+type of circulation
(Hurrell, 1995). Dry conditions in south-west Scandinavia dominate when cyclone frequency is low. Such a situation is associated with a general dominance of continental con-ditions and high air pressures over the study area. This may imply that meridional air flow intensified, causing a more fre-quent occurrence of atmospheric blocking situations.
The effective humidity data suggest that throughout the past 1700 years the climatic conditions fluctuated between two dominant types of circulation. Zonal circulation and oceanic conditions dominated between ca. 1500 and 1230 cal. yrs BP and from 770–380 cal. yrs BP. The relatively dry conditions occurring before 1530 and from ca. 1160–830 cal. yrs BP are associated with dry conditions and more fre-quent atmospheric blocking, which may reflect low annual precipitation and warmer summer conditions.
The periods associated with predominantly dry or wet con-ditions reconstructed here can be compared to the timing and characteristics of known –and debated- periods such as the Little Ice Age (LIA) and the Mediaeval Warm Period (MWP) (e.g. Grove, 2001; Maasch et al., 2005; Matthews and Briffa, 2005). In Fig. 5 the local timing and duration of these peri-ods is derived from the changes in the testate amoebae as-semblages as reconstructed in this study. The dry period around 1160–830 cal. yrs BP (AD 790–1120) may be corre-lated to the so-called Mediaeval Warm Period (AD 800-1200; Maasch et al., 2005).
0 20 40 60 80 100 1700 1600 1500 1400 1300 1200 1100 1000 900 800 700 600 500 400 300 200 100 0 0 2 4 6 ASI > 125 μm (gr cm-2yr-1) 0 20 40 60 80
sum of ‘wet’ indicators (%)
sum of ‘dry’ indicators (%) ASI > 125 µm (gr cm-2yr-1)
δ18OSed (‰V-PDB)
Cal. yrs BP
Undarsmosse bog Lake Igelsjön Store Mosse
bog Vejers dunefield a b c d e 0 0.4 0.8 1.2 1.6 2 -10 -9.6 -9.2 -8.8 -8.4 -8 300 400 500 600 700 800 900 1000 1100 1200 1300 1400 1500 1600 1700 1800 1900 years AD ASI UM and StM MWP LIA 1 LIA 2 Depth of watertable 0 5 10 15 20 25
cm below peat surface
Fig. 5. (a) data from Undarsmosse bog, showing humidity fluctuations as reconstructed by testate amoebae analysis, with an alternating dominance of wet and dry indicators. Curves are based on the taxa presented in Fig. 3 and Table 1. Grey shading indicates transitional phases between relatively stable hydrological conditions as reconstructed by testate amoebae assemblage shifts. The watertable variations (in cm below the peat surface) are shown with the error margins (after Charman et al., 2007). Also shown are ASI variations from the Undarmosse core for grainsizes >125 µm. (b) Summary of ASI data from Undarsmosse and Store mosse bogs (curve d). Dark grey boxes indicate the timing and duration of increased aeolian activity at both sites. Light grey boxes represent increased aeolian activity recorded at one of the sites. (c) Effective humidity changes as recorded by Hammarlund et al. (2003) and Sepp¨a et al. (2005). This proxy is comparable to the wetness indicators at this study site (Fig. 3a) and shows a similar pattern. Datapoints are indicated with horizontal bars. (d) ASI results from Store Mosse bog. Comparison to the ASI record from Undarsmosse bog shows that the two records are highly similar. (e) Stars indicate the onset of dune formation at Vejers dunefield (Fig. 1), interpreted as a proxy for westerly storm activity and sand erodibility (Clemmensen et al., 2001; Clemmensen and Murray, 2006). The inferred local timing of the twofold Little Ice Age (LIA) and the Mediaeval Warm Period (MWP), based on the humidity shift recorded in this study, are also shown.
The LIA as shown in Fig. 4 is divided in two main phases; a wet first phase from around 770 until 300 cal. yrs BP (AD 1180–1650) and a dry phase during the most severe part of the LIA from ca. 300–50 cal. yrs BP (AD 1650–1900). This is in broad agreement with e.g. Grove (2001), who showed an early onset of the LIA in Scandinavia and the Swiss Alps near the end of the thirteenth century and Maasch et al. (2005), who also found a two-fold division of the LIA. It is known, however, that the timing, duration and intensity of these cli-matic events differ widely (Jones and Briffa, 2001; Ogilvie and Jonsson, 2001; Bradley et al., 2002).
The most recent dry phase (300 to 50 cal. yrs BP) is represented by a fluctuating but generally dry bog surface, suggesting predominantly continental conditions with low precipitation. Many studies indicate severe conditions with very cold winters but also decreased summer temperatures during parts of this time period (e.g. Lamb, 1982; Briffa, 1992; Bradley et al., 2002; Mauquoy et al., 2002). The cooling of both summer and winter temperatures during this
time period has been associated with processes related to re-duced solar activity (e.g. Shindell et al., 2001; Bond et al., 2001; Mauquoy et al., 2002b), increased volcanic activity (e.g. Briffa et al., 1998; Crowley, 2000) and even reduced greenhouse gas emissions due to a steep population decrease in the Americas (Ruddiman, 2006).
The interpretation of effective humidity in terms of long term changes in dominant atmospheric flow type does not imply that flow patterns were stable during these climatic regimes. Short term atmospheric and climatic changes such as those reconstructed by e.g. tree ring reconstructions from northern Fennoscandia (Briffa et al., 1992; Grudd et al, 2002) and modelling studies (Moberg et al., 2005; Gouirand et al., 2006) certainly took place, but due to the sample resolution in this study short lasting changes are not recorded in our data much. Our data indicate, however, that long term changes in the dominant circulation mode occurred and that the changes from predominantly wet to dry and dry to wet conditions took place within 100 years.
5.2 Aeolian activity peaks and atmospheric circulation changes
Humidity variations recorded at the Undarsmosse site thus appear to be related to long term fluctuations of the dominant atmospheric circulation mode. Most interestingly, ASI peak events start during these shifts and continue for some decades into the next climatic regime (Fig. 5), indicating that the con-ditions during these transitions were exceptional in several ways; storms were more frequent, stronger and/or more ero-sive than storms associated with the more stable dry or wet conditions in between. This relation was also noted in his-torical records, which show an increase in severe sea floods along the coastlines of the North Sea and the English Chan-nel after AD 1000, at the transition to a cooler and wetter climate which began to affect Europe soon after, during the 13th and 14th century (Lamb, 1982).
Because the majority of ASI peaks occurs during or im-mediately after a climatic shift, a causal relation between the two types of records is suggested. A tentative hypothesis for the occurrence of ASI peaks during climatic shifts is that the intensification of atmospheric circulation could be a result of the regime shift itself. A large scale alteration of the general atmospheric set-up may cause increased atmospheric mix-ing, since air pressure contrasts could be large during a pe-riod of atmospheric reorganization. This hypothesis implies that climatic shifts could lead to temporarily increased ae-olian activity in our study area regardless of the direction of the change. If correct, this hypothesis may also imply that the increased stormy conditions in the North Sea region between AD 1960 - 1990 could be directly related to the rapid climatic warming that is observed during the last few decades (Fure-vik and Nilsen, 2005). However, the relatively long duration of the ASI peaks (c. 30 to 100 yrs) could be used as an argu-ment against this hypothesis, since atmospheric circulation changes are known to be among the most rapid processes in the climate system. In a detailed GISP2 ice core record of the last 1000 years a conspicuous peak of Na+concentration is
recorded between AD 1921 and 1925 (Dawson et al., 2003), reflecting strongly increased storm activity at a climatic tran-sition from very cold conditions to the post AD 1927 amelio-ration at the GISP2 site. The authors suggest that this “termi-nation” may represent the end of the atmospheric circulation associated with the LIA. Although these results thus point to a similar link as hypothesized here, the Na+peak only lasted
for four years. However, if the analogue to present day con-ditions is valid, it is also possible that the duration of periods with increased westerlies (c. three to four decades; Alexan-dersson et al., 1998; Siegismund and Schrum, 2001; Furevik and Nilsen, 2005) is longer at lower latitudes than in Green-land.
An alternative and possibly more plausible explanation is based on the assumption that climatic shifts are not causally related to ASI peaks. Decadal scale atmospheric circulation changes in north-west Europe could be related to the extent
of sea ice in the Greenland Sea (e.g. Dawson et al., 2002; Smith et al., 2003). Oceanic processes are also related to sea ice extent, and possibly act as a slow mechanism affecting atmospheric circulation on longer time scales. As a conse-quence of extensive sea ice cover in the Greenland Sea, a southward shift of the Polar front occurs, since high air pres-sures develop over an ice covered sea. This southward shift of the Polar Front would lead to strongly increased tempera-ture and pressure gradients over the North Atlantic, causing a southward shift of the cyclone track (Dawson et al., 2002) and increased snowfall over Scandinavia (Smith et al., 2003). A modelling study of cyclones during the Maunder Min-imum (MM, AD 1640–1715) shows that fewer cyclones oc-curred in northern Europe during this time period, but the intensity of the extreme cyclones increased (Raible et al., 2006). These authors suggest that the temperature gradient was higher, particularly in the North Atlantic region where sea-ice extended further south. Increased cyclone intensity may thus be the cause of the reconstructed ASI peak values during the MM. The extent of the sea ice in the Greenland Sea and the associated position of the Polar Front appear to have been important factors determining winter storminess at our study site during the second phase of the Little Ice Age. Unfortunately there are no records on the extent of sea ice covering the entire time period from 1700 cal. yrs BP to present, and therefore it is not known whether the mechanism modelled during the ASI peak in the MM can be applied to earlier ASI peaks.
So, we argue that a southward extension of the Polar Front, possibly due to extended sea ice, would result in increased westerly storm intensities on a regional scale, which could have produced the ASI peaks. As an alternative or additional factor, the change in the dominant atmospheric circulation pattern itself – whether or not accompanied by increased sea ice – may have caused increased storminess. The causes for the climatic shifts are, however, unknown. On a longer time scale, 6500 yrs, ASI peaks in our study area appear to co-incide with periods of low solar irradiance (De Jong et al, 2006). However, many ASI peaks and climatic shifts do not coincide with reduced solar irradiance and therefore solar forcing can not be the only or the main cause for the patterns reconstructed here. An alternative explanation may be that internal climatic oscillations, possibly related to oceanic pro-cesses, are the real cause for the climatic changes we record here. A study by Renssen et al. (2006) shows that shifts in oceanic circulation modes are more likely to occur during periods of reduced solar irradiance, but take place also in the absence of solar forcing. This would explain why not all so-lar irradiance lows are recorded as a climatic change. Our data seem to suggest a two-mode system, with major shifts occurring every 300–400 years, sometimes coinciding with reduced solar irradiance, but also during periods with normal solar forcing.
6 Conclusions
The direct comparison between testate amoebae inferred bog surface wetness changes and ASI has provided detailed infor-mation about the link between two important climatic vari-ables; effective humidity and storminess. The patterns recon-structed from the Undarsmosse bog site are in good agree-ment with studies from the Store Mosse bog, Vejers dune-field and Lake Igelsj¨on, indicating that the patterns reflect re-gional scale changes. Climatic anomalies associated with the e.g. the LIA and MWP are reflected in the Undarsmosse bog as periods with predominantly dry or wet conditions. These are associated with a dominance of continental and oceanic air-masses, respectively. The LIA appears to be divided into two main phases; an early phase dominated by zonal flow and oceanic conditions from ca. 770 to 380 cal. yrs BP (AD 1180–1570), and a later phase dominated by meridional flow and more frequent atmospheric blocking from ca. 300 to 50 cal. yrs BP (AD 1650–1900). Shifts in the dominant circula-tion mode were inferred from relatively rapid changes of the bog surface hydrology, shown by an almost complete transi-tion of the testate amoebae species compositransi-tion.
The climatic causes of the ASI peaks are as of yet not well understood, but indicate strong atmospheric contrasts. We hypothesize that peak events may be related to the position of the Polar Front and sea ice expansion in the Greenland Sea. Furthermore, a causal link between ASI peaks and the hy-drological shifts recorded at Undarsmosse bog is suggested. Solar forcing may have been an indirect forcing factor during some of the peak events, but not all. Human land use changes are thought to not be causally related to ASI peaks, although intense landuse most likely contributed to the high amplitude and long duration of ASI peaks after ca. 350 cal. yrs BP.
Future research should focus on the potential relation be-tween storm activity and climatic changes. Modern measure-ment data as well as modelling studies may help to under-stand the processes causing increased stormy conditions dur-ing periods of climatic change. Such studies are planned for the near future. If climatic shifts are indeed causally related to increased storm activity in this region, extremely severe winter storms such as those recorded in south-west Sweden in January 2005 and January 2007 may become more com-mon as climate continues to change.
Acknowledgements. This study is part of R. de Jong’s PhD thesis
(Lund University). The comments and suggestions from three
reviewers, D. Charman, H. Sepp¨a and J. Birks, were greatly appreciated and helped to improve the manuscript. We also want to thank D. Charman for his help with the application of the testate amoebae transfer function. The interactive comments from I. Unkel as well as discussions with L. Clemmensen (Copenhagen University) and D. Hammarlund (Lund University) were greatly appreciated.
Edited by: H. Goosse
References
Adern, N. E. (Ed): Harplinge hembygds och fornminnesfrening: Harplinge, en bok om hembygden. 2nd edition, Laholm, 1973. Alexandersson, H., Schmith, T., Iden, K. and Tuomenvirta, H.:
Long-term variations of the storm climate over NW Europe, Glob Atmos Ocean Syst, 6, 97–120, 1998.
Alexandersson, H., Tuomenvirta, H., and Iden, K.: Trends of storms in NW Europe derived from an updated pressure data set, Clim. Res., 14, 71–73, 2000.
Almquist-Jacobson, H.: Lake-level fluctuations at Ljustj¨arnen, cen-tral Sweden and their implications for the Holocene climate of Scandinavia, Paleogeogr Paleoclimatol Paleoecol, 118, 269–290, 1995.
Barber, K. E., Chambers, F. M., and Maddy, D.: Holocene
palaeoclimates from peat stratigraphy: macrofossil proxy cli-mate records from three oceanic raised bogs in England and Ire-land, Quat. Sci. Rev., 22, 521–539, 2003.
Berglund, B. E.: Human impact and climate changes – synchronous events and a causal link?, Quat. Int., 105, 7–12, 2003
Berglund, B. E. and Ralska-Jasiewiczowa, M.: Pollen analysis and pollen diagrams, in: Handbook of Holocene palaeoecology and palaeohydrology, edited by: Berglund, B. E., Wiley and Sons, 1986.
Bj¨orck, S. and Clemmensen, L. B.: Aeolian sediment in raised bog deposits, Halland, SW Sweden: a new proxy record for win-ter storminess variation in southern Scandinavia?, Holocene, 14, 677–688, 2004.
Bobrov, A. A., Charman, D. J., and Warner, B. G.: Ecology of tes-tate amoebae from oligotrophic peatlands: Specific features of polytypic and polymorphic species, Biology Bulletin, 29, 605– 617, 1999.
Bond, G., Kromer, B., Beer, J., Muscheler, R., Evans, M. N., Show-ers, W., Hoffmann. S., Lotti-Bond, R., Hajdas, I., and Bonani, G.: Persistent solar influence on North Atlantic climate during the Holocene, Science, 294, 2130–2135, 2001.
Borgmark, A.: Holocene climate variability and periodicities in south-central Sweden, as interpreted from peat humification analysis, Holocene, 15, 387–395, 2005.
Borgmark, A. and Schoning, K.: A comparative study of peat prox-ies from two eastern central Swedish bogs and their relation to meteorological data, J. Quat. Sci., 21, 109–114, 2006.
Bradley, R. S., Briffa, K. R., Cole, J., Hughes, M. K., and Osborn, T. J.: The climate of the last Millennium, in: Paleoclimate, global change and the future, edited by: Alverson, K., Springer, 2002. Briffa, K. R., Jones, P. D., Schweingruber, F. H., and Osborn, T. J.:
Influence of volcanic eruptions on Northern Hemisphere summer temperature over the past 600 years, Nature, 393, 450–455, 1998. Briffa, K. R., Jones, P. D., Bartholin, T. S., Eckstein, D., Schwe-ingruber, F. H., Karlen, W., Zetterberg, P., and Eronen, M.: Fennoscandian summers from AD 500: temperature changes on short and long timescales, Clim. Dyn., 7, 111–119, 1992. Bronk Ramsey, C.: Radiocarbon calibration and analysis of
stratig-raphy: the OxCal program, Radiocarbon, 37, 425–430, 1995. Bronk Ramsey, C.: Development of the radiocarbon calibration
pro-gram, Radiocarbon ,43, 355–363, 2001.
Charman, D. J. and Blundell, A.: Accrotelm members: A new Eu-ropean testate amoebae transfer function for palaeohydrological reconstruction on ombrotrophic peatlands. J. Quat. Sci, 2007. Charman, D. J., Blundell, A., Chiverell, R. C., Hendon, D., and
Langdon, P.G.: Compilation of non-annually resolved Holocene proxy climate records: stacked Holocene peatland palaeo-water table reconstructions from northern Britain, Quat. Sci. Rev., 25, 336–350, 2006.
Charman, D. J., Brown, A. D., Hendon, D., and Karofeld, E.: Testing the relationship between Holocene peatland palaeocli-mate reconstructions and instrumental data at two European sites, Quat. Sci. Rev., 23, 137–143, 2004.
Charman, D. J., Hendon, D., and Woodland, W. A.: The identifi-cation of testate amoebae (Protozoa: Rhizopoda) in peats, QRA Technical Guide No. 9, Quaternary Research Association, Lon-don. 147 pp, 2000.
Clarke, M. L., Rendell, H., Tastet, J. P., Clave, B., and Masse, L.: Late-Holocene sand invasion and North Atlantic storminess along the Aquitaine coast, south-west France, Holocene, 12, 231–238, 2002.
Clarke, M. L. and Rendell, H. M.: Effects of storminess, sand supply and the North Atlantic Oscillation on sand invasion and coastal dune accretion in western Portugal, Holocene, 16, 341– 355, 2006.
Clemmensen, L. B., Pye, K., Murray, A., and Heinemeier, J.: Sed-imentology, stratigraphy and landscape evolution of a Holocene coastal dune system, Lodbjerg, NW Jutland, Denmark, Sedimen-tology, 48, 3–27, 2001a.
Clemmensen, L. B., Murray, A. S., Bech, J.-J., and Clausen, A.: Large-scale aeolian sand movement on the west coast of Jutland, Denmark in late Subboreal to early Subatlantic time – a record of climate change or cultural impact?, GFF, 123, 193–220, 2001b. Clemmensen, L. B., Pedersen, K., Murray, A., and Heinemeier, J.:
A 7000-year record of coastal evolution, Vejers, SW Jutland. B Geol Soc Denmark, 53, 1–22, 2006.
Clemmensen, L. B. and Murray, A.: The termination of the last major phase of aeolian sand movement, coastal dunefields, Den-mark. Earth surf. Process. Landforms 31, 795–808, 2006. Crowley, T. J.: Causes of climate change over the past 1000 years,
Science, 289, 270–277, 2000.
Dawson, A. G., Hickey, K., Holt, T., Elliott, L., Dawson, S., Foster, I. D. L., Wadhams, P., Jonsdottir, I., Wilkinson, J., McKenna, J., Davis, N. R., and Smith, D. E.: Complex North Atlantic Oscil-lation (NAO) index signal of historic North Atlantic storm-track changes, Holocene, 12, 363–369, 2002.
Dawson, A. G., Elliott, L., Mayewski, P., Lockett, P., Noone, S., Hickey, K., Holt, T., Wadhams, P., and Foster, I.: Late-Holocene North Atlantic climate ‘seesaws’, storminess changes and Green-land ice sheet (GISP2) palaeoclimates, Holocene, 13, 381–392, 2003.
De Jong, R., Bj¨orck, S., Bj¨orkman, L., and Clemmensen, L. B.: Storminess variation during the last 6500 years as reconstructed from an ombrotrophic peat bog in Halland, southwest Sweden, J. Quat. Sci., 21, 905–919, 2006.
De Jong, R.: Stormy records from peat bogs in south-west Sweden -implications for regional climatic variability and and vegetation changes during the past 6500 years, LUNDQUA thesis 58, 2007. Dijkmans, J. W. A.: Niveo-aeolian sedimentation and resulting sed-imentary structures; Sondre Stromfjord area, western Greenland. Permafrost Periglacial process, 83–96, 1990.
Digerfeldt, G.: Reconstruction and regional correlation of Holocene lake-level fluctuations in lake Bysj¨on, south Sweden, Boreas, 17, 165–182, 1988.
Furevik, T. and Nilsen, J. E.Ø.: Large-scale atmospheric circulation variability and its impact on the nordic seas ocean climate – a review, in: The Nordic Seas: an integrated perspective, edited by: Drange, H., Dokken, T., Furevik, T., Gerder, R., and Berger, W., Geophysical monograph, series 158. American Geophysical union, Washington DC, 105–136, 2005.
Granlund, E.: De Svenska h¨ogmossarnas geologi. Deras bildnings-betingelser, utvecklingshistoria och utbredning j¨amte samban-det mellan h¨ogmossebildning och f¨orsumpning. Sveriges Geol-ogiska Unders¨okning , C, 373, 1932.
Grospietsch, Th.: Wechseltierchen (Rhizopodon). Einf¨uhrung in die Kleinlebewelt. Kosmos. Stuttgart, 1958.
Grove, J. M.: The initiation of the “Little Ice Age” in regions round the North Atlantic, Clim. Change, 48, 53–82, 2001
Gouirand, I., Moberg, A., and Zorita, E.: Climate
variabil-ity in Scandinavia for the past millennium simulated by an atmosphere-ocean general circulation model, Tellus, 59A, 30– 49, 2007.
Grudd, H., Briffa, K. R., Karlen, W., Bartholin, T. S., Jones, P. D., and Kromer, B.: A 7400-year tree ring chronology in northern Swedish Lapland: natural climatic variability expressed on an-nual to millennial timescales, Holocene, 12, 657–665, 2002. Hammarlund, D., Bj¨orck, S., Buchardt, B., Israelson, C., and
Thom-sen, C. T.: Rapid hydrological changes during the Holocene re-vealed by stable isotope records of lacustrine carbonates from lake Igelsj¨on, southern Sweden, Quat. Sci. Rev., 22, 353–370, 2003.
Harplinge hembygd och fornminnesf¨orening: Harplinge –en bok om hembygden. Halmstad, 1927.
Hughes, P. D. M., Mauquoy, D., Barber, K. E., and Langdon, P. G.: Mire-development pathways and palaeoclimatic records from a full Holocene peat archive at Walton Moss, Cumbria, England, Holocene, 10, 467–479, 2000.
Hurrell, J. W.: Decadal Trends in the North-Atlantic Oscillation – Regional Temperatures and Precipitation, Science, 269, 676– 679, 1995.
Jiang, H., Eiriksson, J., Schulz, M., Knudsen, M.-L., and Sei-denkrantz, M.-S.: Evidence of solar forcing of sea-surface tem-perature on the North Icelandic shelf during the late Holocene, Geology, 33, 73–76, 2005.
Jones, P. D. and Briffa, K. R.: The “Little Ice Age”: local and global perspectives, Clim. Change, 48, 5–8, 2001.
J¨onsson, P. and B¨arring, L.: Zonal index variations, 1899-1992: links to air temperature in southern Scandinavia. Geogr Ann Ser A-Phys Geogr, 76, 207-219, 1994.
J¨onsson, P. and Fortuniak, K.: Interdecadal variations of surface wind direction in Lund, southern Sweden, 1741–1990. Intern. J. Clim., 15, 447–461, 1995.
Lamb, H. H.: Climate, history and the modern world, Routledge, London, 1982.
Lewkowicz, A. G.: Aeolian sediment transport during winter, Black Top Creek, Fosheim Peninsula, Ellesmere Island, Canadian Arc-tic, Permafrost Periglacial Process, 9, 35–46, 1998.
Li, X. Y., Liu, L. Y., and Wang, J. H.: Wind tunnel simulation of aeolian sandy soil erodibility under human disturbance, Geomor-phology, 59, 3–11, 2004.
Maasch, K. A., Mayewski, P. A., Rohling, E. J., Stager, J. C., Karlen, W., Meeker, L. D., and Meyerson, E. A.: A 2000-year context for modern climate change, Geogr Ann Ser. A-Phys.
Ge-ogr, 87, 7–15, 2005.
Matthews, J. A. and Briffa, K. R.: The “Little Ice Age: re-evaluation of an evolving concept, Geogr. Ann. Ser. A-Phys. Geogr., 87, 17– 36, 2005.
Mauquoy, D., Engelkes, T., Groot, M. H. M., Markesteijn, F., Oude-jans, M. G., van der Plicht, J., and Van Geel, B.: High-resolution records of the late-Holocene climate change and carbon accu-mulation in two north-west European ombrotrophic peat bogs, Paleogeogr Paleoclimatol Paleoecol, 186, 275–310, 2002. Mauquoy, D., Van Geel, B., Blaauw, M., and Van der Plicht, J.:
Evidence from northwest European bogs shows “Little Ice Age” climatic changes driven by variations in solar activity, Holocene, 12, 1–6, 2002.
Moberg, A., Sonechkin, D. M., Holmgren, K., Datsenko, N. M., and Karlen, W.: Highly variable Northern Hemisphere temperatures reconstructed from low – and high-resolution proxy data, Nature, 433, 613–617, 2005.
Moore, P. D., Webb, J. A., and Collinson, M. E.; Pollen analysis. Blackwell Scientific Publications, 1991.
Nilsson, C., Stjernquist, I., B¨arring, L., Schlyter, P., J¨onsson, A. M., and Samuelsson, H.: Recorded storm damage in Swedish forests 1901–2000, For. Ecol. Manage., 199, 165–173, 2004.
Ogilvie, A. E. J. and Jonsson, T.: “Little Ice Age” research: a per-spective from Iceland, Clim. Change, 48, 9–52, 2001.
P˚asse, T.: Jordartskartan Varberg SO/Ullared SV, Serie Ae 86, 1: 50.000 (Quaternary map of Varberg SO/Ullared SV) OffsetCen-ter AB, Uppsala, 1987.
P˚asse, T., Beskrivning till jordartskartan Varberg SO/Ullared SV (Description to the Quaternary map of Varberg SO/Ullared SV), Uppsala, 1988.
P˚asse, T.: Jordartsgeologiska kartblad Varberg NO, 1: 50.000, Sveriges Geologiska Unders¨okning seria Ae 102, Uppsala. Raab, B. and Vedin, H.: Sveriges Nationalatlas. Bokf¨orlaget Bra
B¨ocker, H¨ogan¨as, 1995.
Raible, C. C., Yoshimori, M., Stocker, T. F., and Casty, C.: Extreme midlatitude cyclones and their implications for precipitation and wind speed extremes in simulations of the Maunder Minimum versus present day conditions, Clim. Dyn., 28, 409–423, 2007. Reimer, P., Baillie, M., Bard, E., Bayliss, A., Beck, J., Bertrand,
C., Blackwell, P., Buck, C., Burr, G., Cutler, K., Damon, P., Ed-wards, R., Fairbanks, R., Friedrich, M., Guilderson, T., Hogg, A., Hughen, K., Kromer, B., McCormac, G., Manning, S., Ram-sey, C. B., Reimer, R., Remmele, S., Southon, J., Stuiver, M., Talamo, S., Taylor, F., Van der Plicht, J., and Weyhenmeyer, C.: IntCal04 Terrestrial Radiocarbon Age Calibration, 0–26 cal Kyr BP, Radiocarbon, 46, 1029–1058, 2004.
Renssen, H., Goosse, H., and Muscheler, R.: Coupled climate model simulation of Holocene cooling events; oceanic feedback amplifies solar forcing, Clim. Past, 2, 79–90, 2006,
http://www.clim-past.net/2/79/2006/.
Ruddiman, W. F.: Plows, plagues and petroleum – how humans took control of climate, Princeton University Press, New Jersey, 2005.
Schoning, K., Charman, D. J., and Wasteg˚ard, S.: Reconstructed water tables from two ombrotrophic mires in eastern central Swe-den compared with instrumental meteorological data, Holocene, 15, 111–118, 2005.
Sepp¨a, H., Hammarlund, D., and Antonsson, K.: Low-frequency and high-frequency changes in temperature and effective humid-ity during the Holocene in south-central Sweden: implications for atmospheric and oceanic forcings of climate, Clim. Dyn., 25, 285–297, 2005.
Shindell, D. T., Schmidt, G. A., Mann, M. E., Rind, D., and Waple, A.: Solar Forcing of Regional Climate Change During the Maun-der Minimum, Science, 294, 2149–2152, 2001.
Siegismund, F. and Schrum, C.: Decadal changes in the wind forc-ing over the North Sea, Clim. Res., 18, 39–45, 2001.
Smith, M., Miller, G. H., Otto-Bliesner, B., and Shin, S.-I.: Sen-sitivity of the Northern Hemisphere climate system to extreme changes in Holocene Arctic sea ice, Quat. Sci. Rev., 22, 645– 658, 2003.
Tipping, R.: Holocene evolution of a lowland Scottish landscape: Part 1, peat and pollen-stratigraphic evidence for raised moss de-velopment and climatic change, Holocene, 5, 69–81, 1995. Tsoar, H. and Pye, K.: Dust Transport and the Question of Desert
Loess Formation, Sedimentology, 34, 139–153, 1987.
van Geel, B., Buurman, J., and Waterbolk, H. T.: Archaeologi-cal and palaeoecologiArchaeologi-cal indications of an abrupt climate change in The Netherlands, and evidence for climatic teleconnections around 2650 BP, J. Quat. Sci., 11, 451–460, 1996.
Wilson, P., Orford, J. D., Knight, J., Braley, S. M., and Wintle, A. G.: Late-Holocene (post-4000 years BP) coastal dune develop-ment in Northumberland, northeast England, Holocene, 11, 215– 229, 2001.
Wilson, P., McGourty, J., and Bateman, M. D.: Mid-to late
Holocene coastal dune event stratigraphy for the north coast of Northern Ireland, Holocene, 14, 406–416, 2004.