HAL Id: hal-01088891
https://hal.archives-ouvertes.fr/hal-01088891
Submitted on 29 Nov 2014
HAL is a multi-disciplinary open access
archive for the deposit and dissemination of
sci-entific research documents, whether they are
pub-lished or not. The documents may come from
teaching and research institutions in France or
abroad, or from public or private research centers.
L’archive ouverte pluridisciplinaire HAL, est
destinée au dépôt et à la diffusion de documents
scientifiques de niveau recherche, publiés ou non,
émanant des établissements d’enseignement et de
recherche français ou étrangers, des laboratoires
publics ou privés.
during the last 50 years
M. Butzin, M. Werner, Valérie Masson-Delmotte, C. Risi, C. Frankenberg, K.
Gribanov, Jean Jouzel, V.I. Zakharov
To cite this version:
M. Butzin, M. Werner, Valérie Masson-Delmotte, C. Risi, C. Frankenberg, et al.. Variations of
oxygen-18 in West Siberian precipitation during the last 50 years. Atmospheric Chemistry and Physics,
European Geosciences Union, 2014, 14 (11), pp.5853-5869. �10.5194/acp-14-5853-2014�. �hal-01088891�
www.atmos-chem-phys.net/14/5853/2014/ doi:10.5194/acp-14-5853-2014
© Author(s) 2014. CC Attribution 3.0 License.
Variations of oxygen-18 in West Siberian precipitation during the
last 50 years
M. Butzin1,2, M. Werner1, V. Masson-Delmotte3, C. Risi4, C. Frankenberg5, K. Gribanov2, J. Jouzel3, and
V. I. Zakharov2
1Alfred Wegener Institute, Helmholtz Centre for Polar and Marine Research, Bremerhaven, Germany 2Climate and Environmental Physics Laboratory, Ural Federal University, Yekaterinburg, Russia
3Laboratoire des Sciences du Climat et de l’Environnement, IPSL (CEA, CNRS, UVSQ), Orme des Merisiers,
Gif-sur-Yvette, France
4Laboratoire de Météorologie Dynamique, IPSL, UPMC, CNRS, Paris, France 5Jet Propulsion Laboratory, California Institute of Technology, Pasadena, USA Correspondence to: M. Butzin ([email protected])
Received: 1 October 2013 – Published in Atmos. Chem. Phys. Discuss.: 8 November 2013 Revised: 7 April 2014 – Accepted: 27 April 2014 – Published: 13 June 2014
Abstract. Global warming is associated with large
in-creases in surface air temperature in Siberia. Here, we apply the isotope-enabled atmospheric general circulation model ECHAM5-wiso to explore the potential of water isotope measurements at a recently opened monitoring station in Kourovka (57.04◦N, 59.55◦E) in order to successfully trace
climate change in western Siberia. Our model is constrained to atmospheric reanalysis fields for the period 1957–2013 to facilitate the comparison with observations of δD in to-tal column water vapour from the GOSAT satellite, and with precipitation δ18O measurements from 15 Russian sta-tions of the Global Network of Isotopes in Precipitation. The model captures the observed Russian climate within reason-able error margins, and displays the observed isotopic gradi-ents associated with increasing continentality and decreasing meridional temperatures. The model also reproduces the ob-served seasonal cycle of δ18O, which parallels the seasonal cycle of temperature and ranges from −25 ‰ in winter to
−5 ‰ in summer. Investigating West Siberian climate and precipitation δ18O variability during the last 50 years, we find long-term increasing trends in temperature and δ18O, while
precipitation trends are uncertain. During the last 50 years, winter temperatures have increased by 1.7◦C. The simulated
long-term increase of precipitation δ18O is at the detection limit (< 1 ‰ per 50 years) but significant. West Siberian cli-mate is characterized by strong interannual variability, which in winter is strongly related to the North Atlantic
Oscil-lation. In winter, regional temperature is the predominant factor controlling δ18O variations on interannual to decadal timescales with a slope of about 0.5 ‰◦C−1. In summer, the interannual variability of δ18O can be attributed to short-term, regional-scale processes such as evaporation and con-vective precipitation. This finding suggests that precipitation
δ18O has the potential to reveal hydrometeorological regime shifts in western Siberia which are otherwise difficult to iden-tify. Focusing on Kourovka, the simulated evolution of tem-perature, δ18O and, to a smaller extent, precipitation during the last 50 years is synchronous with model results averaged over all of western Siberia, suggesting that this site will be representative to monitor future isotopic changes in the en-tire region.
1 Introduction
For the last several decades, an unequivocal warming of the climate system has been reported, evident from obser-vations of increasing global average air and ocean tempera-tures, widespread melting of snow and ice and rising global-mean sea level (IPCC, 2013). However, while the rate of global warming averaged over the last 50 years amounts to about 0.1◦C per decade, high-latitude regions of the North-ern Hemisphere, such as Siberia, have been warming at con-siderably higher rates (e.g. Tingley and Huybers, 2013, and
references therein). Positive feedbacks associated with snow and sea-ice albedo, water vapour, clouds, and moisture trans-port as well as complex land surface–atmosphere interactions have been discussed as possible reasons for the observed Arctic amplification (for an overview see Masson-Delmotte et al. (2013), and references therein). While most studies so far have been focussed on the observed present and projected future temperature increase, it is uncertain how much other components of the Arctic climate system (like the hydrolog-ical cycle) will change as a consequence of the temperature rise. Bengtsson et al. (2011) estimated that the strength of the Arctic water cycle, in terms of annual precipitation, may increase by some 25 % by the end of the 21st century.
Since the pioneering work of Dansgaard (1953, 1964), Craig (1961), Merlivat et al. (1973), Sonntag et al. (1976), and others, it is well known that changes in climate and the atmospheric water cycle leave an imprint on the iso-topic composition of different water reservoirs on earth. For meteoric water, Dansgaard (1964) successfully explained (through the atmospheric distillation process) the linear re-lation between the isotopic composition of precipitation and the local temperature at the precipitation site (the so-called “temperature effect”) observed in many mid- to high latitude regions on earth. Assuming that the observed spatial and tem-poral isotope–temperature relationships are equivalent and constant in time (see Jouzel et al., 2000, for a review of this assumption), it is possible to infer past temperatures from stable water isotopes. Given the magnitude of Arctic warm-ing over the past decades, climate change should be recorded in the isotopic composition of meteoric waters (or natural archives) in boreal regions of the Northern Hemisphere. The magnitude of this isotopic response is of interest when it comes to reconstructing past regional climate changes via isotopic data retrieved from various palaeoclimate archives (e.g. Sidorova et al., 2010).
Unfortunately, isotope records of present-day boreal pre-cipitation are sparse and discontinuous. For Russia, Kurita et al. (2004) have reviewed the modern isotope climatology. Data from 13 Russian monitoring sites sampled during the period 1996–2000 depict eastward isotopic depletion over Russia, which is explained by the gradual rain-out of moist, oceanic air masses, which are transported towards and over Russia by westerly winds. This isotopic gradient, established from earlier isotope records, is known as the “continental effect” (e.g. Araguas-Araguas et al. (2000), and further ref-erences therein). The continental effect weakens in summer due to continental moisture recycling. Altogether, Kurita et al. (2004) estimate that 55 % of the summertime isotopic variability in Russian precipitation is linked to temperature changes and variations of the recycling ratio of continental water sources, the latter effect accounts for just 20 % of the signal. Combining simulation results of the isotope-enabled atmospheric general circulation model (AGCM) LMDZiso with satellite-based estimates of the isotopic composition of water vapour, Risi et al. (2013) found that intraseasonal
vari-ations in continental recycling are minor contributions to the isotopic variability of high-latitude summer precipitation.
To study the impact of climate change in western Siberia, the Russian “mega-grant” research project “Impact of cli-mate change on water and carbon cycles of western Siberia” (WSibIso, http://wsibiso.ru) has recently started monitoring the isotopic composition of water vapour and precipitation at two high-latitude sites in western Siberia. At Kourovka Ob-servatory (57.04◦N, 59.55◦E), located approximately 80km west of Yekaterinburg, isotope monitoring started in 2012 (Gribanov et al., 2014), while regular isotope measurements at Labytnangi (66.65◦N, 66.40◦E) began in summer 2013.
Within the WSibIso Project, the understanding of the signals recorded at Kourovka and Labytnangi is supported by state-of-the-art climate simulations with two AGCMs equipped with explicit stable water isotope diagnostics, ECHAM5-wiso (Werner et al., 2011) and LMDZiso (Risi et al., 2010a). Such isotope-enabled AGCMs provide a mech-anistic understanding of the atmospheric processes influenc-ing the isotopic composition of meteoric water. Since the pio-neering work of Joussaume et al. (1984), Jouzel et al. (1987), Hoffmann et al. (1998) and others, about a dozen state-of-the-art GCMs have been equipped with explicit isotope diagnostics (see Sturm et al., 2010, for a detailed model overview). A number of studies have clearly demonstrated their usefulness for an improved climatic interpretation of present and past water isotope variability (e.g. Jouzel et al., 2000; Mathieu et al., 2002; Noone and Simmonds, 2002; Werner and Heimann, 2002; Vuille and Werner, 2005; Lee and Fung, 2008; Tindall et al., 2009; Risi et al., 2010b). A comparison of different models allows for the evaluation of robust features, and the ability to scrutinize each model’s parametrizations.
For Kourovka Observatory, the observed variations of the surface vapour isotopic composition are very similar to the results of the ECHAM5-wiso simulation covering the period April to September 2012 (Gribanov et al., 2014). Both ex-hibit short-term fluctuations on timescales from a few hours to a few days. These variations can be attributed to the pas-sage of synoptic-scale weather systems, advecting air from different source regions with different isotopic signatures to Kourovka (Gribanov et al., 2014). A detailed comparison of the Kourovka data with LMDZiso model results will be pre-sented in an accompanying paper (Gryazin et al., 2014).
Here, we extend the isotope analyses from year 2012 to the last 50 years. As there are no Russian water vapour iso-tope measurements available prior to 2012, the extended time frame implies that we focus on the isotopic composi-tion of precipitacomposi-tion. Our key quescomposi-tions are as follows. (1) How much has the isotopic composition of precipitation var-ied in western Siberia over the last five decades? (2) What are the main mechanisms and processes causing the varia-tions? (3) How well can large-scale West Siberian climate and water cycle variations be observed in the isotopic com-position of precipitation at Kourovka Observatory, one of the
key monitoring sites within the WSibIso project? Our analy-sis is based on a so-called “nudged” ECHAM5-wiso climate simulation performed for the period 1957–2013, covering the entire period of available ECMWF reanalysis data (Uppala et al., 2005; Berrisford et al., 2011; Dee et al., 2011).
The paper is arranged as follows: after a description of the model setup we test the model performance with respect to various observational data sets. In particular, we present a thorough comparison of simulated and observed precipita-tion δ18O in Russia, going beyond the previous global model assessment by Werner et al. (2011). This validation is a pre-requisite for the following discussion of isotopic interannual variability and mechanisms during the last decades and of the representativeness of Kourovka in this context. We finish with conclusions regarding the potential of isotope measure-ments at Kourovka to trace future climate changes in western Siberia.
2 Methods
2.1 Model description
Atmospheric simulations were carried out using ECHAM5-wiso (Werner et al., 2011), which is the isotope-enabled ver-sion of the atmospheric general circulation model ECHAM5 (Roeckner et al., 2003; Hagemann et al., 2006; Roeckner et al., 2006). The model considers both stable water iso-topes H182 O and HDO, which have been explicitly imple-mented into its hydrological cycle, analogous to the iso-tope modelling approach used in the previous model ver-sions ECHAM3 (Hoffmann et al., 1998) and ECHAM4 (e.g. Werner et al., 2001). For each phase of “normal” water (vapour, cloud liquid, cloud ice) being transported indepen-dently in ECHAM5, a corresponding isotopic counterpart is implemented in the model code. Isotopes and “normal” water are described identically in the AGCM as long as no phase transitions take place. Therefore, the transport scheme for all water-related variables is the flux-form semi-Lagrangian transport scheme for positive definite variables implemented in ECHAM5 (Lin and Rood, 1996).
Additional fractionation processes are defined for the wa-ter isotope variables whenever a phase change of the “nor-mal” water occurs in ECHAM5 (considering equilibrium and non-equilibrium fractionation processes). Equilibrium frac-tionation takes place if the corresponding phase change is slow enough to allow full isotopic equilibrium (Merlivat and Jouzel, 1979). On the other hand, non-equilibrium processes even depend on the velocity of the phase change, and there-fore on the molecular diffusivity of the water isotopes (Jouzel and Merlivat, 1984). Processes involving isotopic fractiona-tion include the evaporafractiona-tion from the ocean, condensafractiona-tion either to liquid or to ice, as well as re-evaporation of liq-uid precipitation within the atmosphere. For evapotranspira-tion from land surfaces, possible isotopic fracevapotranspira-tionaevapotranspira-tion is
ne-glected (see Hoffmann et al. (1998) and Haese et al. (2013), for a detailed discussion of this issue).
ECHAM5-wiso has been evaluated against observations of isotope concentrations in precipitation and water vapour, both on a global and on a European scale (Langebroek et al., 2011; Werner et al., 2011). On both scales, annual and sea-sonal ECHAM-5-wiso simulation results are in good agree-ment with available observations from the Global Network of Isotopes in Precipitation, GNIP (IAEA/WMO, 2013).
Werner et al. (2011) have shown that the simulation of wa-ter isotopes in precipitation clearly improves with increased horizontal and vertical model resolution. Thus, for this study, we choose a horizontal model resolution of T63 in spec-tral space (horizontal grid size of approximately 1.9◦×1.9◦), and a vertical resolution of 31 levels on hybrid sigma-pressure coordinates. Local ECHAM5-wiso results for GNIP stations (discussed further below) were obtained by bilinear interpolation to the station coordinates. To ensure a most realistic simulation of present-day climate variability, the model is forced with prescribed yearly values of present-day insolation and greenhouse gas concentrations (IPCC, 2000), as well as with monthly varying fields of sea-surface temper-atures and sea-ice concentrations according to ERA-40 and ERA-Interim reanalysis data (Uppala et al., 2005; Berrisford et al., 2011; Dee et al., 2011). Furthermore, the dynamic– thermodynamic state of the ECHAM model is constrained to reanalysis data by an implicit nudging technique (Kr-ishamurti et al., 1991; the implementation in ECHAM is de-scribed by Rast et al., 2013) – i.e. modelled fields of surface pressure, temperature, divergence and vorticity are relaxed to the corresponding ERA-40 and ERA-Interim reanalysis fields (Uppala et al., 2005; Berrisford et al., 2011; Dee et al., 2011). The nudging interval is 6 hours, ensuring that the sim-ulated large-scale atmospheric flow is modelled in agreement with the ECMWF reanalysis data on all analysed timescales. In contrast to the atmospheric flow, the hydrological cycle and its isotopic variations is still fully prognostic and not nudged to any reanalysis data. Vegetation in the model is prescribed by a time-invariant set of land surface data (vege-tation ratio, leaf area index, forest ratio, background albedo; Hagemann, 2002).
The performed simulation covers the period September 1957 until July 2013. Here we regard the first 28 months as model spin-up and analyse the 51-year period between 1960 and 2010. Unless stated otherwise, we focus on monthly av-eraged model results of the isotopic composition of precipi-tation (typically expressed in a delta-noprecipi-tation as δ18O or δD), covering the full period of available stable water isotope mea-surements in Russia.
2.2 Observations of isotopes in Russian precipitation
In western Siberia (here defined as the region ranging from 55–90◦E and 55–70◦N), monthly precipitation δ18O data are available from 9 GNIP stations operating for different time
Table 1. GNIP δ18O records from Russia considered in this study. Stations located in western Siberia are highlighted in bold. For each station, we report the latitude, longitude and altitude, as well as the sampling period (tobs) and the number of available monthly measurements (Nobs).
Name Lat (◦N) Lon (◦E) Alt (m) tobsδ18O Nobsδ18O
Arkhangelsk 64.58 40.50 13 1981–1990 78 Astrakhan 46.25 48.03 −18 1980–2000 168 Bagdarin 54.47 113.58 903 1996–2000 34 Barabinsk 55.33 78.37 120 1996–2000 37 Cherskiy 68.76 161.34 30 2001–2009 57 Kalinin 56.90 35.90 31 1980–1988 94 Kirov 58.65 49.62 164 1980–2000 102 Moscow 55.75 37.57 157 1970–1979 61 Murmansk 68.97 33.05 46 1980–1990 71 Pechora 61.12 57.10 56 1980–1990 79 Perm 57.95 56.20 161 1980–1990 79 Rostov 47.25 39.82 77 1980–1990 74 Saratov 51.57 46.03 166 1980–1990 74 St. Petersburg 59.97 30.30 4 1980–1990 107 Yakutsk 62.08 129.75 107 1978–2000 46
periods between 1973 and 2000. Individual records range from a few months to up to 10 years. Given the sparseness of these observations, we also include data from 12 other GNIP stations in Russia for an improved model evaluation. Except for Cherskiy (68.76◦N, 161.34◦E), there are no published stable water isotope data for more recent times than the year 2000 (S. Terzer, personal communication, 2014).
To this set of 21 GNIP stations, we apply the following data selection:
(a) We consider only stations where the sampling period of isotopes in precipitation has been at least 5 years. (b) Unrealistic delta values of approximately +50 ‰ for
both HDO and H182 O isotopes from Amderma are ex-cluded.
(c) Five outliers with anomalous positive delta values from Barabinsk and Yakutsk stations are excluded.
(d) We exclude six stations (Kandalaksa, Khanty-Mansiysk, Kursk, Olenek, Salekhard, and Terney) where reported monthly mean temperatures are clearly unrealistic (i.e. reporting winter values for summer months or vice versa) and systematically disagree from WMO measurements and/or ECMWF reanalysis data, indicating issues with data quality control within the GNIP database.
After data filtering, our database consists of results from 15 GNIP stations (comprising 1161 monthly observations of
δ18O between 1970 and 2009; Table 1) used hereafter for further analyses.
2.3 Satellite observations of isotopes in water vapour
Although precipitation and water vapour have a different iso-topic composition due to fractionation processes, a compar-ison of ECHAM5-wiso results for isotopes in water vapour with available data from satellite and ground-based remote sensing techniques is valuable. It will reveal some first-order information if the model correctly simulates the spatial gra-dients of the isotopic signal in atmospheric water vapour (and thus consistently in precipitation) over Russia. Ground-based remote sensing of δ18O in water vapour has been realized recently (Rokotyan et. al., 2014) but so far, only a small number of measurements have been carried out. For this rea-son we consider global observations of deuterium (δD) in total column water vapour retrieved from the GOSAT satel-lite (Boesch et al., 2013; Frankenberg et al., 2013) for the period April 2009 to June 2011. We select only measure-ments which pass a series of quality criteria involving the absence of clouds and the retrieval precision for different species (Frankenberg et al., 2013; Risi et al., 2013).
To rigorously compare ECHAM5-wiso with GOSAT, the model output needs to be processed in two ways. First, we need to take into account the spatio-temporal sampling. GOSAT makes measurements only along its orbit, and not all measurements pass our quality selection. Therefore, we se-lect only the locations and days for which GOSAT has made valid measurements. Such a selection makes sense because ECHAM5-wiso is nudged toward reanalysis, so that the at-mospheric properties simulated by ECHAM5-wiso and ob-served by GOSAT can be compared at the daily scale.
Secondly, we need to take into account the instrument sensitivity. The column-integrated δD value retrieved by GOSAT is not exactly the column-integrated δD value which actually occurred. This is because retrievals are affected by
atmospheric conditions such as the vertical profiles of tem-perature and water vapour or the presence of clouds. The “averaging kernels” describe how a given vertical profile in δD, for given atmospheric conditions, translates into the GOSAT column-integrated δD retrieval values (Rodgers and Connors, 2003). An averaging kernel is produced for each GOSAT measurement. Therefore, for each GOSAT mea-surement, we apply the corresponding averaging kernel to the model outputs. This allows us to compute the column-integrated δD values that GOSAT would retrieve if it was flying in ECHAM5-wiso’s simulated atmosphere (Risi et al., 2012a).
3 Results and discussion
3.1 Present-day mean climate
Gribanov et al. (2014) showed that the ECHAM5-wiso sim-ulation results agree well with observations from Kourovka Observatory and the surrounding area for the year 2012. Since we analyse model results for the period 1960–2010, the period of model validation with meteorological obser-vations has been extended. This section summarizes the re-sults of the updated validation. Surface temperatures and pre-cipitation rates in Yekaterinburg (56.80◦N, 60.60◦E; WMO data for station Sverdlovsk retrieved from the KNMI Cli-mate Explorer, http://climexp.knmi.nl/) were compared to the ECHAM5-wiso model values (calculated as the mean over the period 1960–2004, as more recent observations were not available). Simulated surface temperatures show a small cold bias of less than 1◦C in the annual mean, with larger
deviations (of up to −3◦C) in winter. Precipitation rates
sim-ulated by ECHAM are slightly above observed values in the annual mean (by about 2 mm month−1) and between October and June (by 2–8 mm month−1), but up to −16 mm month−1 lower between July and September.
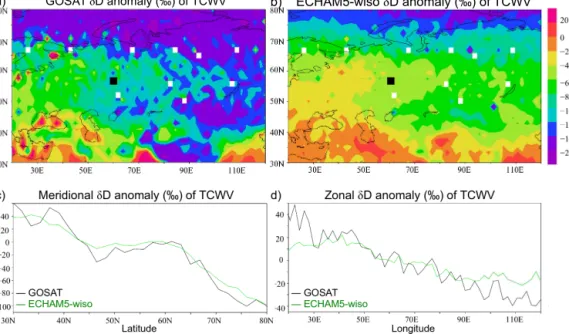
Figure 1 shows annual-mean patterns of simulated surface temperature (T ), total precipitation amount (P), and oxygen-18 content of precipitation (δ18O) for the region 0–160◦E, 40–80◦N, covering central and eastern Europe, Russia and parts of Asia.
Surface temperatures (Fig. 1a) decrease from southwest to northeast. Comparing model temperatures averaged over 1960–2010 with the CRU temperature reconstruction for the same period (University of East Anglia Climatic Research Unit (CRU), Jones and Harris, 2013), we find slightly colder values in the simulations than observed (in the range −0.5–
−1.5◦C) in Eurasia and western Siberia. Conversely, simu-lated temperatures in central and eastern Siberia are higher by ∼ 0.5–1.5◦C than the CRU data, with maximum differ-ences of up to 5◦C found for the Verkhoyansk Range.
Precipitation fields (Fig. 1b) are zonally aligned in the simulated annual mean pattern. Total precipitation decreases from 60 to 80 mm month−1at the East European Plain
east-wards and arrives at minimum values of 20–30 mm month−1
in a zone ranging from the southern part of the West Siberian Plain to northeast Siberia. Precipitation values peak in the Russian Far East in the Stanovoy Range. Compared to the CRU precipitation reconstruction (University of East Anglia Climatic Research Unit (CRU), Jones and Harris, 2013), sim-ulated precipitation is higher by 10–20 mm month−1north of 60◦N, and by up to about 30 mm month−1 in the Russian Far East mountain areas. In the southern part of the West Siberian Plain, ECHAM produces slightly less precipitation than observed. The precipitation deficit increases with in-creasing continentality.
The simulated annual mean δ18O values of precipitation over Russia are plotted in Fig. 1c. Within Russia, δ18O values decrease from southwest to northeast. In contrast to temper-ature and precipitation, no global data set of observed δ18O in precipitation yet exists for comparison. The geographical distribution of GNIP stations shown in Fig. 1c illustrates the large observational gaps in Russia. A more rigorous model-data comparison of δ18O will be presented further below.
Total column water vapour values of δD, according to ECHAM5-wiso and to GOSAT satellite retrievals, are shown in Fig. 2. As there is no absolute calibration for column-integrated δD of GOSAT (Risi et al., 2013), we subtract the global average of δD for both GOSAT and ECHAM to enable an improved comparison focussing on the spatial distributions. The model captures the pattern of total col-umn water vapour δD variations over Russia well (Fig. 2a and b). Even some details such as the regional δD gradient southwest of Kourovka Observatory are resolved. Regarding the meridional δD gradient along the longitude zone includ-ing Kourovka, ECHAM5-wiso captures the northward deple-tion retrieved by GOSAT (Fig. 2c). Considering the zonal
δD variation along the latitude zone including Kourovka (Fig. 2d), we find that ECHAM5-wiso tends to underesti-mate the eastward depletion associated with the continental effect. From 20◦E to 120◦E, δD decreases by about 80 ‰ in GOSAT observations and by only about 40 ‰ in ECHAM5-wiso.
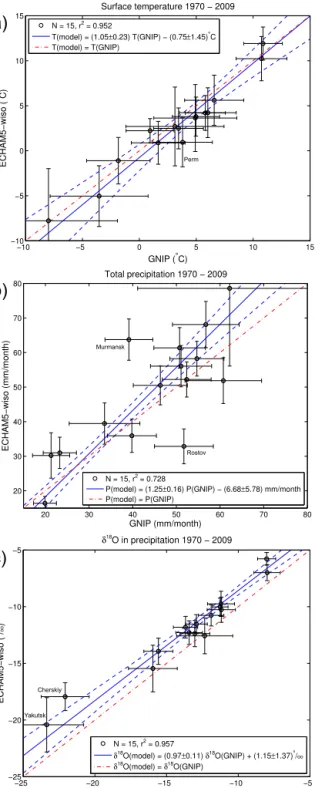
For more quantitative analyses, we compare the climatol-ogy from our ECHAM5-wiso simulation results to available GNIP measurements. For each GNIP location, we restrict the data-model comparison to those months within the period 1960–2010, when measurements have been reported (see Ta-ble 1 for details). Thus, mean values of T , P and δ18O are cal-culated over different periods for each GNIP station and from ECHAM5-wiso. The results of this comparison are shown in Fig. 3. The uncertainty range indicated by the error bars is ± 2 standard errors of the estimated mean values. In the following, uncertainty ranges always refer to the 95 % confi-dence interval.
As expected from our nudging strategy, Fig. 3a shows good agreement between modelled surface temperatures and GNIP observations. Model results and observations are highly correlated (r2∼0.95) and lie close to a line with slope
ECHAM5−wiso total precipitation (mm/mon) <1960−2010 ANM>
0 30E 60E 90E 120E 150E
45N 60N 75N
0 10 20 30 40 50 60 70 80 90 100
δ18O (°/oo) in precipitation <1960−2010 ANM>
0 30E 60E 90E 120E 150E
45N 60N 75N −30 −25 −20 −15 −10 −5 0 Cherskiy Yakutsk Bagdarin Barabinsk Perm Pechora Astrakhan Rostov Arkhangelsk Murmansk St. Petersburg Kalinin Moscow Saratov Kirov Kourovka
CRU total precipitation (mm/min) <1960−2010 ANM>
0 30E 60E 90E 120E 150E
45N 60N 75N
0 10 20 30 40 50 60 70 80 90 100
CRU surface temperature (°C) <1960−2010 ANM>
0 30E 60E 90E 120E 150E
45N 60N 75N
−20 −15 −10 −5 0 5 10 15 20
ECHAM5−wiso surface temperature (°C) <1960−2010 ANM>
0 30E 60E 90E 120E 150E
45N 60N 75N
−20 −15 −10 −5 0 5 10 15 20
a) ECHAM5-wiso Tsurf 〈1960–2010〉 d) CRU Tsurf 〈1960–2010〉
e) CRU Ptotal 〈1960–2010〉 b) ECHAM5-wiso Ptotal 〈1960–2010〉 °C °C mm / month mm / month c) 18 O in precipitation 〈1960–2010〉 ‰
Figure 1. Left column: simulated mean annual values of (a) surface temperature, (b) precipitation, and (c) δ18O in precipitation, averaged
over the period 1960–2010. Right column: CRU data of (d) surface temperature, and (e) precipitation amount, averaged over the same period. The circles in Fig. 1c mark the position of the various GNIP stations used for analyses in this study.
1. A linear fit, applying an algorithm which accounts for the uncertainties in both coordinates (Krystek and Anton, 2007), yields an optimum slope of 1.05 ± 0.23 and an optimum in-tercept of (−0.75 ± 1.45)◦C. The root mean square (RMS) difference between modelled and observed mean temper-atures is 1.13◦C. A comparison of the averages over all stations (ECHAM5-wiso: 2.59◦C, GNIP: 3.30◦C) suggests that the model tends to underestimate the observed tem-peratures. Regarding individual stations, the largest differ-ence is found for Perm, where the model is too cold by 2.9◦C. However, given the uncertainty ranges of observed
and simulated temperatures, the conclusion of an overall cold bias of ECHAM5-wiso is not robust. The average variabil-ity of modelled and observed temperatures (i.e. the average length of the error bars) is virtually the same (± 2.83◦C vs.
±2.88◦C). This indicates that ECHAM5-wiso captures the
temporal variability of observed surface temperatures in Rus-sia (note that the range of model values only reflects tempo-ral variability while the observational range may also include measurement errors).
For precipitation the scatter of model results is larger (Fig. 3b), resulting in a correlation which is weaker than for temperature (r2∼0.73). The RMS difference between sim-ulations and observations is about 10.5 mm month−1, with the largest deviations for Murmansk (+24 mm month−1) and for Rostov (−19 mm month−1). The model results for these stations are clearly beyond the uncertainty range of a linear fit (slope = 1.25 ± 0.16 and inter-cept = (−6.68 ± 5.78) mm month−1). The average
precipita-tion rate according to ECHAM5-wiso is 10 % higher than ob-served (48 mm month−1vs. 44 mm month−1), which points to a moist bias of the model. On the other hand, the model
a) GOSAT D anomaly (‰) of TCWV b) ECHAM5-wiso D anomaly (‰) of TCWV
Figure 2. Distribution of annual-mean δD in total column water vapour, (a) as observed by the GOSAT satellite, (b) as simulated by ECHAM,
after collocation with GOSAT observations and convolution with the corresponding averaging kernels. In (a) and (b) the global average of δD has been subtracted to highlight spatial patterns, and the black squares indicate the location of Kourovka Observatory; white squares are grid cells with low-quality observations. (c) Meridional transects of observed (black) and simulated (green) δD averaged over the longitude band 50–70◦E around Kourovka. The annual-mean δD value averaged over the area 30–80◦N, 50–70◦E has been subtracted to highlight the meridional variations. (d) Zonal transects of observed (black) and simulated (green) δD averaged over the latitude band 50–64◦N around Kourovka. The annual-mean δD value averaged over the area 50–64◦N, 20–120◦E has been subtracted to highlight the zonal variations.
slightly underestimates the variability of observed precipita-tion rates (± 6.55 mm month−1vs. ± 6.99 mm month−1).
Figure 3c indicates that ECHAM5-wiso captures annual mean δ18O records in Russia reasonably well. Model results and GNIP data are highly correlated (r2 ∼0.96) and coa-lesce along a line with a slope close to 1 (0.97 ± 0.11; inter-cept: (1.15 ± 1.37) ‰). The RMS difference between model results and observations amounts to 1.05 ‰. ECHAM5-wiso tends to overestimate observed δ18O. The average over all stations is −12.1 ‰ vs. −13.6 ‰ according to GNIP. Maximum differences of up to +4 ‰ are found for two stations in eastern Siberia (Cherskiy and Yakutsk) where ECHAM5-wiso does not simulate sufficient depletion. Un-certainty ranges of the simulated and observed means are rather the same (± 1.17 ‰ simulated vs. ± 1.16 ‰ ob-served). The model slightly underestimates the spatial gra-dients of δ18O observed in Russia. The meridional isotope gradient (observed slope: −4.2 ‰ per 10◦latitude, simulated slope: −3.6 ‰ per 10◦latitude), reflecting the meridional temperature gradient, is by about a factor of four to five larger than the zonal isotope variation (observed slope: −0.9 ‰ per 10◦longitude, simulated slope: −0.8 ‰ per 10◦longitude)
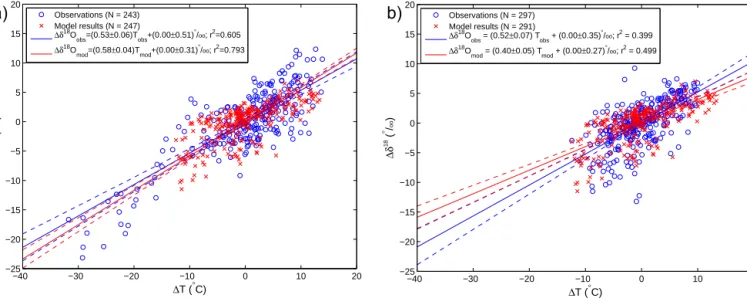
associated with increasing continentality (not shown). Studying anomalies of δ18O (1δ18O) and surface tem-peratures (1T), we find a linear relationship for all seasons with a typical slope of 0.5 ‰◦C−1(Fig. 4). The correlation between GNIP 1T and 1δ18O is most pronounced in
au-tumn (SON, r2= 0.69) and winter (DJF, r2= 0.61). In spring (MAM, r2= 0.50) and summer (JJA, r2= 0.40) the corre-lation is weaker, but still significant (p 0.05 applying a
t test). The weaker coupling indicates that the δ18O signal during the warm season is significantly affected by other pro-cesses such as moisture recycling. ECHAM5-wiso simulates a similar seasonal relationship but the correlation between
1δ18O and 1T is higher than for the observations (r2= 0.50– 0.79). The model overestimates the coupling between 1δ18O and 1T especially in spring (r2= 0.79).
We now compare the simulated and observed seasonal cy-cle of precipitation δ18O in western Siberia (Fig. 5). The data exhibit seasonal variations ranging from −25 ‰ in winter to −5 ‰ in summer, closely following the seasonal cycle of temperature. Peak values of up to −1 ‰ were observed in Perm during the second half of the 1980s. Despite the reported small annual-mean temperature biases, ECHAM5-wiso correctly simulates the timing and magnitude of the seasonal variations of both temperature and δ18O (Fig. 5) in western Siberia. Observations and simulations from Pechora and Perm also show interannual variations, which will be dis-cussed in the next section.
δ18 O in precipitation 1970 − 2009 GNIP (°/oo) ECHAM5 − wiso ( °/oo ) −25 −20 −15 −10 −5 −25 −20 −15 −10 −5 N = 15, r2= 0.957 δ18 O(model) = (0.97±0.11) δ18 O(GNIP) + (1.15±1.37)°/oo δ18O(model) = δ18O(GNIP) Cherskiy Yakutsk Surface temperature 1970 − 2009 GNIP (°C) ECHAM5 − wiso ( °C) −10 −5 0 5 10 15 −10 −5 0 5 10 15 N = 15, r2= 0.952 T(model) = (1.05±0.23) T(GNIP) − (0.75±1.45)°C T(model) = T(GNIP) Perm Total precipitation 1970 − 2009 GNIP (mm/month) ECHAM5 − wiso (mm/month) 20 30 40 50 60 70 80 20 30 40 50 60 70 80 N = 15, r2= 0.728
P(model) = (1.25±0.16) P(GNIP) − (6.68±5.78) mm/month P(model) = P(GNIP) Murmansk Rostov
a)
b)
c)
Figure 3. Comparison of mean values of (a) surface
tempera-ture, (b) precipitation amount, and (c) δ18O in precipitation for a selection of 15 GNIP stations located in Russia and the related ECHAM5-wiso model results (see text for details on station selec-tion and mean value calculaselec-tion at each staselec-tion). Length of the error bars is ± 2 standard errors of the estimated means. Straight lines are obtained from a weighted total least-squares algorithm accounting for uncertainties in both observations and model results (Krystek and Anton, 2007), dashed lines are 95 % confidence intervals for the fits.
3.2 Interannual to decadal variations over the last five
decades
The sampling period of precipitation δ18O in Russia is too short for a thorough investigation of the long-term variabil-ity seen in the West Siberian isotope and climate records shown in Fig. 5. To overcome this problem, we extend the time frame by considering model results for the period 1960– 2010. Therefore, the following analysis of interannual to decadal variations of T , P and δ18O over Russia during the past decades is entirely based on model results. Unless stated otherwise, the model results are presented as anomalies from their long-term climatological mean (1961–1990). A zero-phase bidirectional low-pass filter with a length of 24 equally weighted months is employed on the ECHAM5-wiso results to highlight long-term variability. To explore the potential in-fluence of global warming during the period 1960–2010, we apply a t test comparing the reference period with the pe-riod 1981–2010 (significance level is 5 %). In addition, we investigate linear long-term trends derived from a regression of annual-mean model results. The numerical results of this trend analysis are listed in Table 2.
At the global scale, (Fig. 6a, blue line), surface warm-ing has been accompanied by increaswarm-ing atmospheric mois-ture content (not shown) while modelled precipitation over land has slightly decreased (Fig. 6b). In parallel, global wa-ter vapour and precipitation have become progressively en-riched with heavy water isotopes (Fig. 6c). The simulated in-crease of land surface temperatures is statistically significant. The trend analysis indicates a long-term increase of annual-mean global land surface temperatures by (1.23 ± 0.01)◦C
per 50 years which is in the range of trend estimates based on observations (for a compilation of climatological obser-vations see Hartmann et al., 2013, and references therein). Simulated anomalies of global land precipitation peaked in the mid-1970s which is also seen in global precipitation data sets. For more recent periods, the simulation does not re-produce the observed amplitude of interannual precipitation variability. However, the changes are statistically significant, and the modelled long-term decrease of global land precip-itation by (2.18 ± 0.49) mm month−1 per 50 years is in line with observations (Hartmann et al., 2013; note that global precipitation trends there relate to the different period 1951– 2008).
Long-term trends in T , P, and δ18O are also found in west-ern Siberia (averaged over the area 55–90◦E, 55–70◦N) as
well as at Kourovka (Fig. 6, red and green lines). Regional and local warming is statistically significant and occurred at lower rates than global ones in the annual mean ((1.19 ± 0.18)◦C per 50 years averaged over western Siberia and (1.08 ± 0.15)◦C per 50 years in Kourovka). The long-term warming is particularly pronounced in winter (DJF), espe-cially in western Siberia and Kourovka, where DJF warming rates are in the range 1.5–1.7◦C per 50 years. Our model also suggests a positive long-term trend of annual precipitation.
Seasonal variation DJF ∆T (°C) ∆δ 18 ( °/oo ) −40 −30 −20 −10 0 10 20 −25 −20 −15 −10 −5 0 5 10 15 20 Observations (N = 243) Model results (N = 247) ∆δ18O obs=(0.53±0.06)Tobs+(0.00±0.51) °/oo; r2=0.605 ∆δ18 Omod=(0.58±0.04)Tmod+(0.00±0.31)°/oo; r2=0.793 ∆T (°C) ∆δ 18 ( °/oo)
Seasonal variation JJA
−40 −30 −20 −10 0 10 20 −25 −20 −15 −10 −5 0 5 10 15 20 Observations (N = 297) Model results (N = 291) ∆δ18 Oobs = (0.52±0.07) Tobs + (0.00±0.35)°/oo; r2 = 0.399 ∆δ18O mod = (0.40±0.05) Tmod + (0.00±0.27) °/oo; r2 = 0.499
a)
b)
Figure 4. Relationship between δ18O and surface temperature. Shown are monthly anomalies (1δ18O and 1T) according to monthly
obser-vations from 15 GNIP stations in Russia (circles) and the related ECHAM5-wiso model results (crosses), (a) winter season and (b) summer season. Solid lines are obtained from a least-squares linear fit of observations and model results; dashed lines indicate 95 % confidence intervals for the fits.
Table 2. Linear trend estimates and 95 % confidence intervals for annual and seasonal surface temperature, precipitation, and δ18O in
precipitation simulated for the period 1960–2010.
Area Annual mean DJF JJA
Temperature (◦C per 50 years) Global land 1.23 ± 0.01 1.38 ± 0.02 1.12 ± 0.01 W Siberia 1.19 ± 0.18 1.72 ± 1.37 {0.52 ± 0.16} Kourovka 1.08 ± 0.15 1.54 ± 0.90 {0.91 ± 0.27} Precipitation
(mm month−1per 50 years)
Global land −2.18 ± 0.49 {−0.46 ± 1.56} −2.82 ± 0.76 W Siberia {2.18 ± 2.16} 3.10 ± 3.75 {−0.38 ± 12.0} Kourovka {3.09± 8.60} {3.28 ± 11.0} {−11.9 ± 63.0} δ18O (‰ per 50 years) Global land 0.58± 0.00 0.36± 0.01 0.62 ± 0.01 W Siberia 0.48± 0.05 {0.13± 0.23} 0.55 ± 0.03 Kourovka 0.47 ± 0.08 {−0.24 ± 0.41} {0.58 ± 0.11}
Values for western Siberia are averaged over the area 55–90◦E, 55–70◦N. DJF represents December–February, JJA represents June–August.
Curly brackets indicate that the underlying model anomalies for the period 1981–2010 are not significantly different from the reference period 1961–1990 (applying a t test, significance level = 5 %).
For both western Siberia and Kourovka, annual-mean precip-itation rates have been increasing by 2–3 mm month−1 dur-ing the last 50 years, with a tendency towards enhanced DJF precipitation at the expense of JJA rainfall. However, except for winter precipitation in western Siberia, the changes are statistically insignificant, and the uncertainty range of the re-gional and local precipitation trends is high, exceeding the projected average long-term anomaly. Long-term trends of precipitation δ18O are also positive. The changes are small and at the detection limit (< 1 ‰ per 50 years) but statis-tically significant everywhere at the annual timescale. For
western Siberia we find that the long-term changes of δ18O are more pronounced during JJA than during DJF, which is opposite to the simulated seasonal temperature trends. The reason for this decoupling is that moisture import to west-ern Siberia intensifies more in summer than in winter (not shown), while the opposite is simulated for precipitation. As a consequence, the isotopic signature of moisture available for precipitation is less affected by continental depletion dur-ing recent summer seasons than durdur-ing recent winters.
At the regional and local scale the long-term trends are su-perimposed by strong interannual variability, reaching values
δ 18 O ( ° / oo ) Pechora 1978 1980 1982 1984 1986 1988 1990 1992 −25 −20 −15 −10 −5 Year T( ° C) 1978 1980 1982 1984 1986 1988 1990 1992 −30 −20 −10 0 10 20 GNIP ECHAM δ 18O ( ° / oo ) Perm 1978 1980 1982 1984 1986 1988 1990 1992 −25 −20 −15 −10 −5 0 Year T( ° C) 1978 1980 1982 1984 1986 1988 1990 1992 −30 −20 −10 0 10 20 30 GNIP ECHAM Barabinsk δ 18O ( ° / oo ) 1996 1997 1998 1999 2000 2001 2002 −25 −20 −15 −10 −5 0 T( ° C) Year 1996 1997 1998 1999 2000 2001 2002 −30 −20 −10 0 10 20 30 GNIP ECHAM
a)
b)
c)
Figure 5. Observed versus modelled monthly δ18O values in
pre-cipitation for the period 1980–2000. Measurements of 3 GNIP sta-tions located in western Siberia are plotted as blue circles: (a) Pe-chora, (b) Perm, (c) Barabinsk. The red line shows ECHAM5-wiso results corresponding to the same locations. Also shown are ob-served (blue) and modelled (red) surface temperatures.
Year
Difference from 1961−1990 (
°C)
Anomalies of surface temperature
1965 1970 1975 1980 1985 1990 1995 2000 2005 −1.5 −1 −0.5 0 0.5 1 1.5 Global land W Siberia Kourovka a) Year
Difference from 1961−1990 (mm/month)
Anomalies of total precipitation
1965 1970 1975 1980 1985 1990 1995 2000 2005 −12 −10 −8 −6 −4 −2 0 2 4 6 8 10 Global land W Siberia Kourovka b) Year Difference from 1961−1990 ( °/oo ) Anomalies of δ18 O in precipitation 1965 1970 1975 1980 1985 1990 1995 2000 2005 −1 −0.8 −0.6 −0.4 −0.2 0 0.2 0.4 0.6 0.8 1 Global land W Siberia Kourovka c)
Figure 6. Simulated time series of (a) surface temperature, (b)
pre-cipitation, and (c) δ18O in precipitation for the period 1962–2008. Shown are anomalies from the climatological mean (reference pe-riod: 1961–1990). The ECHAM5-wiso results are averaged glob-ally (blue line), for the region of western Siberia (green line), and interpolated to the location of Kourovka Observatory (red line). A zero-phase bidirectional low-pass filter with a length of 24 equally weighted months has been applied to the simulated monthly mean values for filtering short-term fluctuations. Straight lines are global (blue), regional (green) and local (red) trends obtained from least-square fits of annual-mean values for the period 1960–2010; dashed lines are 95 % confidence intervals for the trends. See also Table 2 for a summary of numerical results.
of up to ± 1.5◦C, ± 10 mm yr−1, and ± 1 ‰, respectively.
Temperature anomalies simulated for western Siberia and Kourovka have covaried since the late 1960s. During most of the simulation period, temperature differences between west-ern Siberia and Kourovka are less than about ± 0.5◦C, with Kourovka showing larger fluctuations than western Siberia. Simulated precipitation anomalies for western Siberia and Kourovka appear to be less synchronous than is the case for temperature, particularly between 1995 and 2000 when the precipitation curves are out of phase. Moreover, in Kourovka the precipitation variability is considerably larger (by up to 10 mm month−1) than its average for western Siberia. The larger deviation between the mean precipitation amount in West Siberia and the values in Kourovka as compared to the surface temperatures is not surprising, as precipitation is known to strongly vary at small spatial and temporal scales. Consistent with the temperature patterns, anomalies of δ18O in western Siberia and Kourovka are in phase most of the time and differ within ± 0.5 ‰, with the larger variability being simulated for Kourovka. In our simulation, δ18O and surface temperature mostly covary, which is not the case for the precipitation amount. However, δ18O and temperature are not rigidly coupled. This is indicated by our model results for the years around 1990, when temperatures in Kourovka were below the western Siberian average, while the opposite is ob-tained for δ18O. The overall good agreement between mean temperature and δ18O changes in West Siberia and Kourovka is a key finding with respect to the objectives of the WSibIso Project. It indicates that Kourovka Observatory is a highly representative site for monitoring climate change in western Siberia.
While we find that annual and seasonal-mean values of
T, P and δ18O have been slowly changing during the last decades (at least at the global scale), we do not arrive at a sig-nificant conclusion regarding potential changes in their inter-annual variance. Compared with the interinter-annual variance be-tween 1961 and 1990 (estimated from the standard deviation of detrended model results), the last decade (2001–2010) is characterized by increased variability of winter temperatures (0.4◦C) and winter precipitation (2 mm month−1) in west-ern Siberia, and by increased variance of winter and sum-mer precipitation rates (3 mm month−1) in Kourovka. The last decade does not exhibit substantial changes in δ18O vari-ability.
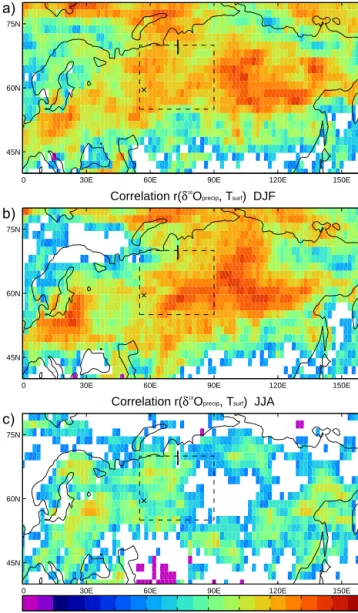
Further analyses of the temporal correlation between sim-ulated values of δ18O in precipitation and surface tempera-tures (Fig. 7) reveal that the correlation of annual-mean val-ues seen in Fig. 7a is mainly controlled by a strong link-age between surface temperature and δ18O in precipitation in western Siberia during winter (DJF). While the correlation coefficient between winter T and δ18O can reach maximum values of up to 0.9 (Fig. 7b), the correlation between both cli-mate variables is substantially weaker for summer (Fig. 7c). In the WSibIso target area, only one-quarter of the observed
Correlation r(δ18
Oprecip, Tsurf) annual mean
0 30E 60E 90E 120E 150E
45N 60N 75N −0.1 0 0.1 0.2 0.3 0.4 0.5 0.6 0.7 0.8 0.9 Correlation r(δ18 Oprecip, Tsurf) DJF
0 30E 60E 90E 120E 150E
45N 60N 75N
−0.1 0 0.1 0.2 0.3 0.4 0.5 0.6 0.7 0.8 0.9
Correlation r(δ18
Oprecip, Tsurf) JJA
0 30E 60E 90E 120E 150E
45N 60N 75N
−0.1 0 0.1 0.2 0.3 0.4 0.5 0.6 0.7 0.8 0.9
Figure 7. Temporal correlation between simulated values of δ18O
in precipitation and surface temperatures for the period 1960–2010. Correlation coefficients are calculated for (a) annual mean, (b) win-ter (DJF), and (c) summer (JJA) values of temperature and δ18O. Statistically insignificant areas (where p ≥ 0.05 applying a t test) are blanked.
interannual δ18O variability can be explained by a linear re-lationship with local surface air temperature changes.
We now explore the relationship between West Siberian climate and precipitation isotopic composition, and large-scale atmospheric circulation. Previous studies have revealed a strong linkage between surface temperatures, δ18O in pre-cipitation and the North Atlantic Oscillation (NAO) for major parts of Europe (e.g. Baldini et al., 2008; Field, 2010; Lange-broek et al., 2011; Casado, et al., 2013). It is also known that the influence of the NAO on the large-scale atmospheric circulation is not bound to Europe but extends further east towards Russia (e.g. Halpert and Bell, 1997). Correlating
Correlation r (δ 18
O precip at Kourovka, sea level pressure) DJF
100 kg/ms
60W 30W 0 30E 60E 90E 120E 150E 45N
60N 75N
−0.5 −0.4 −0.3 −0.2 −0.1 0 0.1 0.2 0.3 0.4 0.5
Figure 8. One-point correlation map showing the correlation
be-tween δ18O in precipitation at Kourovka and sea-level pressure dur-ing winter (DJF, correlation period is 1960–2010). Also shown is the average atmospheric moisture transport during DJF (vectors; only every second vector is drawn). The green box indicates western Siberia and the position of Kourovka is marked by a green cross.
Year
Seasonal NAO index DJF
1960 1965 1970 1975 1980 1985 1990 1995 2000 2005 2010 −5 −4 −3 −2 −1 0 1 2 3 4 Hurrell station−based ECHAM5−wiso
Figure 9. NAO winter (DJF) station index for the period 1960–
2010, according to observations (blue line; Hurrell et al., 2013), and as simulated by the ECHAM5-wiso model (red line).
simulated δ18O values in Kourovka with the simulated global sea level pressure field, we find a pattern for winter which is characteristic for the NAO (Fig. 8; cf. Hurrell and Deser, 2009). Thus, as a next step we investigate the influence of NAO variations on temperature and δ18O variability over Russia.
Figure 9 shows the observed and simulated station-based NAO seasonal winter (DJF) index for the period 1960–2010. ECHAM5-wiso model faithfully captures the observed NAO index (reference stations are Ponta Delgada, Azores, and Stykkishólmur/Reykjavik, Iceland; Hurrell et al., 2013) con-sistent with the reanalysis pressure fields used for nudging. Minor deviations between the observed station-based index
Table 3. Correlation r of δ18O in precipitation with
meteorologi-cal variables at Kourovka according to model results for the period 1960–2010.
Variable DJF JJA
Surface temperature Tsurf 0.62 0.43
Total precipitation P {0.10} −0.45 Large-scale precipitation {0.10} {−0.25} Convective precipitation PC {0.03} −0.44 Evaporation E {−0.20} −0.31 Soil wetness {0.09} −0.45 Tsurf(seasons | P < h P i) 0.68 0.46 (29 seasons) (30 seasons) Tsurf(seasons | PC< hPCi) 0.62 0.63 (50 seasons∗) (23 seasons) Tsurf(seasons | E < h E i) 0.62 0.55 (25 seasons) (27 seasons) DJF represents December–February, JJA represents June–August. Values in curly brackets are statistically insignificant (p ≥ 0.05 applying a t test). The lower three rows show the correlation with surface temperature if only seasons are considered
in which total precipitation P, convective precipitation PCor evaporation E are
below their respective arithmetic long-term values h P i, h PCi, and h Ei.
∗Convective winter precipitation at Kourovka was zero except for one season (in
which PC<0.1 mm month−1).
and the modelled values can be attributed to the chosen model resolution T63, which can result in a slightly different average surface pressure of a relatively large grid cell as com-pared to a point-like station location. A correlation analysis of this simulated station-based NAO seasonal winter (DJF) index with modelled values of T , P, and δ18O reveals that the NAO influence on surface temperature, precipitation amount and δ18O in precipitation extends in a broad band from Eu-rope to northern Siberia (Fig. 10). To a large extent, the co-variation between winter NAO and δ18O (Fig. 10a) is con-trolled by air temperature. Winters are mild in years when the NAO is strong, which is indicated by the positive cor-relation between NAO index and DJF surface temperatures shown in Fig. 10b. Winter precipitation in northern Russia also increases when the NAO is strong (Fig. 10c).
Our analyses shown in Fig. 10 reveal that in wintertime the NAO-associated atmospheric circulation changes have a slightly weaker impact on precipitation δ18O (r ∼ 0.6) over western Siberia than on the surface temperatures in this re-gion (r ∼ 0.7). On the contrary, δ18O in precipitation is much more strongly correlated to the NAO than the precipitation amount itself (r ∼ 0.3). This exposes the potential of re-constructing past changes of the NAO strength from var-ious δ18O records, for example those retrieved from lake sediments, speleothems, or tree rings (e.g. Sidorova et al., 2010) from this region. The ECHAM5-wiso results indicate that archives storing the δ18O signal of winter precipitation should be suitable for such a NAO reconstruction.
While the interannual variability of δ18O in winter pre-cipitation can be largely attributed to temperature variations in western Siberia associated with the NAO, we do not find
Correlation r(NAO index, δ18
Oprecip) DJF
0 30E 60E 90E 120E 150E
45N 60N 75N
−0.1 0 0.1 0.2 0.3 0.4 0.5 0.6 0.7 0.8 0.9
a)
Correlation r(NAO index, precipitation) DJF
Correlation r(NAO index, surface temperature) DJF
0 30E 60E 90E 120E 150E
45N 60N 75N
−0.1 0 0.1 0.2 0.3 0.4 0.5 0.6 0.7 0.8 0.9
b)
Correlation r(NAO index, total precipitation) DJF
0 30E 60E 90E 120E 150E
45N 60N 75N
−0.1 0 0.1 0.2 0.3 0.4 0.5 0.6 0.7 0.8 0.9
c)
Figure 10. Temporal correlation between station-based NAO winter
(DJF) index and (a) δ18O in precipitation, (b) surface temperature, and (c) total precipitation amount. Statistically insignificant areas (where p ≥ 0.05 applying a t test) are blanked.
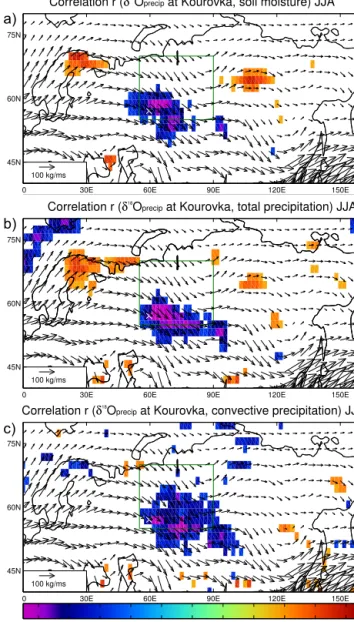
such a teleconnection for the summer. Previous studies have shown that evapotranspiration fluxes significantly contribute to summer precipitation in Russia, and estimated that the re-gional moisture recycling rates can exceed 80 % (e.g. Koster et al., 1993; Numaguti, 1999; Risi et al., 2013). Accordingly, Kurita et al. (2003, 2004) have suggested that snowmelt and subsequent evaporation of soil moisture carrying the iso-topic imprint of winter precipitation could significantly in-fluence the isotopic composition of regional precipitation, counterbalancing the positive coupling between temperature and δ18O. Studying one-point correlation maps for JJA, we find that δ18O at Kourovka is negatively correlated with the regional soil moisture reservoir (Fig. 11a) and local evapora-tion (see Table 3) which is in line with moisture recycling
Correlation r (δ18
Oprecipat Kourovka, soil moisture) JJA
100 kg/ms
0 30E 60E 90E 120E 150E 45N 60N 75N −0.5 −0.4 −0.3 −0.2 −0.1 0 0.1 0.2 0.3 0.4 0.5 a) Correlation r (δ18
Oprecipat Kourovka, total precipitation) JJA
100 kg/ms
0 30E 60E 90E 120E 150E 45N 60N 75N −0.5 −0.4 −0.3 −0.2 −0.1 0 0.1 0.2 0.3 0.4 0.5 b) Correlation r (δ18
Oprecipat Kourovka, convective precipitation) JJA
100 kg/ms
0 30E 60E 90E 120E 150E 45N
60N 75N
−0.5 −0.4 −0.3 −0.2 −0.1 0 0.1 0.2 0.3 0.4 0.5
c)
Figure 11. One-point correlation map showing the correlation
be-tween δ18O in precipitation at Kourovka during summer (JJA) with
(a) soil moisture, (b) total precipitation, and (c) convective
pre-cipitation. Also shown is the average atmospheric moisture trans-port during JJA (vectors; only every second vector is drawn). The green box indicates western Siberia and the position of Kourovka is marked by a white cross. The correlation period is 1960–2010. Sta-tistically insignificant areas (where p ≥ 0.05 applying a t test) are blanked. See also Table 3 for numbers.
through re-evaporation. Moreover, we identify a negative correlation between δ18O and total precipitation (Fig. 11b), which is mainly due to the variability of convective precipita-tion (Fig. 11c, see also Table 3). If we consider only years in which convective precipitation is below the arithmetic long-term average, the correlation between δ18O and local surface temperature rises from r ∼ 0.4 to r ∼ 0.6 (i.e. comparable to winter values, cf. Table 3). In the opposite case (convective precipitation above the long-term average) the correlation
between δ18O and surface temperature decreases to r ∼ 0.3. This suggests that the isotope signal in West Siberian summer precipitation is rather controlled by the temperature variabil-ity at the level of condensation than by temperatures on the ground. In principle, a correlation of δ18O with vertical tem-peratures should permit us to identify the altitude range of precipitation formation. However, correlating monthly-mean values we did not arrive at conclusive results.
Figure 11 clearly reveals that the summer δ18O signal at Kourovka reflects hydrometeorological changes at the re-gional scale. Regarding precipitation and the seasonal-mean moisture flow, the correlation pattern is asymmetric. Ar-eas in which the correlations are statistically significant are rather small upwind of Kourovka, but more extended down-wind. Downwind areas may contribute to the isotopic sig-nal at Kourovka through mixing – i.e. in situations of tran-sient perturbations of the mean atmospheric flow. In fact, according to Fukutomi et al. (2004), Kourovka lies in the Siberian summer storm-track zone with high synoptic-scale eddy activity. This is reflected in our model results by greater monthly variability of atmospheric moisture transport to-wards Kourovka during summer than during winter. In sum-mer, monthly moisture fluxes vary within ∼ ± 35 % in mag-nitude and within ∼ ± 25◦ in flow direction, while in win-ter monthly-mean fluxes vary within ∼ ± 10 % in magnitude and ∼ ± 15◦in flow direction, respectively. These findings, as well as the results of our correlation analyses, are proba-bly overly smoothed to fully resolve effects of moisture re-cycling, atmospheric convection, and transient perturbations, as the effective timescales of these processes can be consid-erably shorter than a month.
The link between δ18O and climate during the West Siberian summer deserves further investigations. The effects of atmospheric convection and transient perturbations could be investigated by analysing the evolution of δ18O at the timescale of single meteorological events, which may also in-volve the use of second order isotopic data (d-excess or17O excess; e.g. Landais et al., 2010; Guan et al., 2013). Mois-ture recycling and the origin of advected moisMois-ture could be investigated by moisture tagging, that is by simulating the dispersal of numerical water tracers evaporating from dif-ferent predefined source regions (e.g. Koster et al., 1986; Numaguti, 1999; Risi et al., 2013). Nonetheless, our find-ings for the summer are in line with previous studies argu-ing that variations of δ18O in precipitation are rather a re-gionally integrated signal of several climate variables than a proxy for either local temperature or precipitation changes (e.g. on a global scale: Schmidt et al., 2005; for Western Eu-rope: Langebroek et al., 2011).
4 Summary and conclusions
Using the few available observations as well as a new sim-ulation from the isotope-enabled atmospheric general cir-culation model ECHAM5-wiso covering the period 1958– 2013, we have investigated the spatiotemporal variations in the isotopic composition of precipitation in Russia dur-ing recent decades. In its nudged configuration, the model simulates temperature and precipitation fields over western Siberia within reasonable error margins, providing a realis-tic framework for investigating the model performance for
δ18O. The model reproduces the spatial pattern of precipita-tion δ18O when compared with averaged observations from 15 stations of the Global Network of Isotopes in Precipitation between 1970 and 2009. The model has difficulties capturing the amount of δ18O depletion in eastern Siberia, while
tem-perature and precipitation are correctly simulated.
According to our model results, temperature is the pre-dominant factor, controlling up to 80 % of the variability of annual-mean and winter precipitation δ18O in Russia on interannual to decadal timescales. Interannual variations in winter temperature and isotope signals show a strong im-print of the North Atlantic Oscillation. During summer, lo-cal temperature has only a minor impact (about 20 %) on the variability of the isotopic composition of West Siberian precipitation. Instead, our analyses indicate that δ18O inte-grates effects of regional hydrometeorological processes on timescales shorter than a month which have not been explic-itly considered in this study. The results are in line with mois-ture recycling through evaporation, involving the delayed evaporation of isotopically depleted winter precipitation re-tained in snowmelt and soil water. The isotopic summer sig-nal is significantly influenced by convective precipitation for-mation, which does not occur in this region in winter. We also find enhanced variability of moisture transports towards western Siberia. The relative importance of these processes should be further investigated with higher temporal resolu-tion, or by using second order isotopic data (e.g. deuterium excess) as well as numerical moisture tagging diagnostics. Our results indicate that δ18O has the potential to reveal hy-drometeorological regime shifts in future summers, which are otherwise difficult to identify.
Recent observations reveal significant isotopic variability on the diurnal and daily timescale (Gribanov et al., 2014). The impact of short-term variations on the isotopic signal seen in the monthly GNIP records cannot be analysed, but continuous monitoring of water vapour δ18O and daily sam-pling of precipitation δ18O will permit the study of processes on the event scale. Regarding Kourovka Observatory, where such a monitoring programme has recently been established, we find that the simulated variability of temperature and δ18O at this location is similar to model results averaged over the entire West Siberian region. Therefore, we conclude that this location is highly suitable to monitor isotopic changes all over western Siberia.
Acknowledgements. This research was supported by a grant from the Russian government under the contract 11.G34.31.0064. The help of S. Rast, Max Planck Institute for Meteorology, Hamburg, for providing model support regarding ECHAM5 nudging aspects is thankfully acknowledged. S. Terzer, IAEA Isotope Hydrology Section, Vienna, provided valuable information regarding water isotope data from Russia. We thank C. Purcell, Alfred Wegener Institute, Bremerhaven, for language checking and two anonymous referees for constructive reviews.
Edited by: H. Wernli
References
Araguas-Araguas, L., Froelich, K., and Rozanski, K.: Deu-terium and oxygen-18 isotope composition of precipitation and atmospheric moisture, Hydrol. Process., 14, 1341– 1355, doi:10.1002/1099-1085(20000615)14:8<1341::AID-HYP983>3.0.CO;2-Z, 2000.
Baldini, L. M., McDermott, F., Foley, A. M., and Baldini, J. U. L.: Spatial variability in the European winter precipitation δ18O– NAO relationship: implications for reconstructing NAO-mode climate variability in the Holocene, Geophys. Res. Lett., 35, L04709. doi:10.1029/2007GL032027, 2008.
Bengtsson, L., Hodges, K. I., Koumoutsaris, S., Zahn, M., and Keenlyside, N.: The changing atmospheric water cycle in Po-lar Regions in a warmer climate, Tellus A, 63, 907–920, doi:10.1111/j.1600-0870.2011.00534.x, 2011.
Berkelhammer, M., Hu, J., Bailey, A., Noone, D. C., Still, C. J., Barnard, H., Gochis, D., Hsiao, G. S., Rahn, T., and Turnipseed, A.: The nocturnal water cycle in an open-canopy forest, J. Geo-phys. Res. Atmos., 118, 10225–10242, doi:10.1002/jgrd.50701, 2013.
Berrisford, P., Dee, D., Poli, P., Brugge, R., Fielding, K., Fuentes, M., Kallberg, P., Kobayashi, S., Uppala, S., and Simmons, A.: The ERA-Interim archive Version 2.0, ERA Report Series No. 1, European Centre for Medium-Range Weather Forecasts, Read-ing, UK, 2011.
Boesch, H., Deutscher, N. M., Warneke, T., Byckling, K., Cogan, A. J., Griffith, D. W. T., Notholt, J., Parker, R. J., and Wang, Z.: HDO/H2O ratio retrievals from GOSAT, Atmos. Meas. Tech., 6, 599–612, doi:10.5194/amt-6-599-2013, 2013.
Craig, H.: Isotopic Variations in Meteoric Waters, Science, 133, 1702–1703, doi:10.1126/science.133.3465.1702, 1961.
Dansgaard, W.: The abundance of O18 in atmospheric water and water vapour, Tellus, 5, 461–469, doi:10.1111/j.2153-3490.1953.tb01076.x, 1953.
Dansgaard, W.: Stable isotopes in precipitation, Tellus, 16, 436– 468, doi:10.1111/j.2153-3490.1964.tb00181.x, 1964.
Dee, D. P., Uppala, S. M., Simmons, A. J., Berrisford, P., Poli, P., Kobayashi, S., Andrae, U., Balmaseda, M. A., Balsamo, G., Bauer, P., Bechtold, P., Beljaars, A. C. M., van de Berg, L., Bid-lot, J., Bormann, N., Delsol, C., Dragani, R., Fuentes, M., Geer, A. J., Haimberger, L., Healy, S. B., Hersbach, H., Hólm, E. V., Isaksen, L., Kållberg, P., Köhler, M., Matricardi, M., McNally, A. P., Monge-Sanz, B. M., Morcrette, J.-J., Park, B.-K., Peubey, C., de Rosnay, P., Tavolato, C., Thépaut, J.-N., and Vitart, F.: The ERA-Interim reanalysis: configuration and performance of the
data assimilation system, Q. J. Roy. Meteor. Soc., 137, 553–597, doi:10.1002/qj.828, 2011.
Field, R. D.: Observed and modeled controls on precipita-tion delta O-18 over Europe: From local temperature to the Northern Annular Mode, J. Geophys. Res., 115, D12101, doi:10.1029/2009JD013370, 2010.
Frankenberg C., Wunch, D., Toon, G., Risi, C., Scheepmaker, R., Lee, J.-E., Wennberg, P., and Worden, J.: Water vapor isotopo-logue retrievals from high-resolution GOSAT shortwave infrared spectra, Atmos. Meas. Tech., 6, 263–274, doi:10.5194/amt-6-263-2013, 2013.
Fukutomi, Y., Masuda, K., and Yasunari, T.: Role of storm track activity in the interannual seesaw of summer precipita-tion over northern Eurasia, J. Geophys. Res., 109, D02109, doi:10.1029/2003JD003912, 2004.
Gribanov, K., Jouzel, J., Bastrikov, V., Bonne, J.-L., Breon, F.-M., Butzin, M., Cattani, O., Masson-Delmotte, V., Rokotyan, N., Werner, M., and Zakharov, V.: Developing a Western Siberia ref-erence site for tropospheric water vapour isotopologue observa-tions obtained by different techniques (in situ and remote sens-ing), Atmos. Chem. Phys. Discuss., in press, 2014.
Gryazin, V., Risi, C., Jouzel, J., Kurita, N., Worden, J., Frankenberg, C. and Bastrikov, V., Gribanov, K., and Stukova, O: The added value of water isotopic measurements for understanding model biases in simulating the water cycle over Western Siberia, At-mos. Chem. Phys. Discuss., 14, 4457–4503, doi:10.5194/acpd-14-4457-2014, 2014.
Guan, H., Zhang, X., Skrzypek, G., Sun, Z., and Xu, X.: Deuterium excess variations of rainfall events in a coastal area of South Australia and its relationship with synoptic weather systems and atmospheric moisture sources, J. Geophys. Res. Atmos., 118, 1123–1138, doi:10.1002/jgrd.50137, 2013.
Haese, B., Werner, M., and Lohmann, G.: Stable water iso-topes in the coupled atmosphere–land surface model ECHAM5-JSBACH, Geosci. Model Dev., 6, 1463–1480, doi:10.5194/gmd-6-1463-2013, 2013.
Hagemann, S.: An improved land surface parameter dataset for global and regional climate models. Report 336, Max Planck In-stitute for Meteorology, Hamburg, Germany, 2002.
Hagemann, S., Arpe, K., and Roeckner, E.: Evaluation of the hydro-logical cycle in the ECHAM5 model, J. Clim., 19, 3810–3827, doi:10.1175/JCLI3831.1, 2006.
Halpert, M. S. and Bell, G. D.: Climate Assessment for 1996, Bull. Am. Meteorol. Soc., 78, 1038, doi:10.1175/1520-0477(1997)078<1038:CAF>2.0.CO;2, 1997.
Hartmann, D. L., Klein Tank, A. M. G., Rusticucci, M., Alexan-der, L. V., Brönnimann, S., Charabi, Y., Dentener, F. J., Dlugo-kencky, E. J., Easterling, D. R., Kaplan, A., Soden, B. J., Thorne, P. W., Wild, M., and Zhai, P. M.: Observations: Atmosphere and Surface. In: Climate Change 2013: The Physical Science Basis. Contribution of Working Group I to the Fifth Assessment Report of the Intergovernmental Panel on Climate Change, edited by: Stocker, T. F., Qin, D., Plattner, G.-K., Tignor, M., Allen, S. K., Boschung, J., Nauels, A., Xia, Y., Bex, V., and Midgley, P. M., Cambridge University Press, Cambridge, United Kingdom and New York, NY, USA, 159–254, 2014.
Hoffmann, G., Werner, M., and Heimann, M.: Water isotope module of the ECHAM atmospheric general circulation model: A study