HAL Id: hal-02441986
https://hal-cea.archives-ouvertes.fr/hal-02441986
Submitted on 16 Jan 2020
HAL is a multi-disciplinary open access
archive for the deposit and dissemination of
sci-entific research documents, whether they are
pub-lished or not. The documents may come from
teaching and research institutions in France or
abroad, or from public or private research centers.
L’archive ouverte pluridisciplinaire HAL, est
destinée au dépôt et à la diffusion de documents
scientifiques de niveau recherche, publiés ou non,
émanant des établissements d’enseignement et de
recherche français ou étrangers, des laboratoires
publics ou privés.
Growth of micrometric oxide layers for the study of
metallic surfaces decontamination by laser
L. Carvalho, W. Pacquentin, M. Tabarant, H. Maskrot, A. Semerok
To cite this version:
L. Carvalho, W. Pacquentin, M. Tabarant, H. Maskrot, A. Semerok. Growth of micrometric oxide
layers for the study of metallic surfaces decontamination by laser. ICRS-13 and RPSD-2016 - 13th
International Conference on Radiation Shielding & 19th Topical Meeting of the Radiation Protection
and Shielding Division, Oct 2016, Paris, France. �hal-02441986�
a Corresponding author: luisa.carvalho@cea.fr
Growth of micrometric oxide layers for the study of metallic surfaces
decontamination by laser
Luisa Carvalho a, Wilfried Pacquentin, Michel Tabarant, Hicham Maskrot and Alexandre Semerok
Den – Service d’Etudes Analytiques et de Réactivité des Surfaces (SEARS), CEA, Université Paris-Saclay, F-91191, Gif sur Yvette,
Abstract. The nuclear industry produces a wide range of radioactive waste in term of level of hazard, contaminants
and material. For metallic equipment like steam generators, the radioactivity is mainly located in the oxide surface. In order to study and develop techniques for dismantling and for decontamination in a safe way, it is important to have access to oxide layers with a representative distribution of non-radioactive contaminants. We propose a method of formation of oxide layer on stainless steel 304L with europium (Eu) as contaminant marker. In this method, an Eu-solution is sprayed on the stainless steel samples. The specimen are firstly treated with a pulsed nanosecond laser and secondly the steel samples are exposed to a 600°C furnace for various durations in order to grow an oxide layer. The oxide structure and in-depth distribution of Eu in the oxide layer are analysed by scanning electron microscopy coupled with energy dispersive X-ray microanalyzer, and by glow discharge optical emission or mass spectrometry. The oxide layers were grown to thicknesses in the range of 200 nm to 4.5 µm regarding to the laser treatment parameters and the heating duration. These contaminated oxides have a ‘duplex structure’ with a mean weight percentage of 0.5% of europium in the volume of the oxide layer. It appears that europium implementation provides the oxide growth by furnace but has no impact on laser heating. These oxide layers are used to study the decontamination of metallic surfaces such as stainless steel 304L using a nanosecond pulsed laser.
1 Introduction
In nuclear industry, the dismantling is a major issue. The cleaning of contaminated surfaces is currently based on chemical and mechanical processes. However few problems remain unsolved. These techniques usually generate secondary wastes and contaminated effluents which need long term storage and dismantling workers are exposed to occasional radiation.
In this context, the CEA (French Alternative Energies and Atomic Energy Commission) has developed a prototype for surfaces cleaning called Aspilaser and studied the cleaning of contaminated surfaces such as painted concrete [1-2] and stainless steel [3-4] by excimer or fiber lasers. In regard to metallic components such as pipe systems, the radionuclides are usually in the oxide layer which grows during the operations of the nuclear facility.
The principle of this technique is the laser ablation of the surface in order to eject the oxide layer and collect the radioactive particles with a HEPA filter for storage. In nuclear facilities, the use of a laser for the cleaning of contaminated surfaces has many advantages such as the possibility of remote treatment, a dry process and a minimum of secondary wastes.
In dismantling operations, the contaminated surfaces range widely in characteristics such as shape (pipes, plane
surfaces …), conditions of oxide growth (temperature, atmosphere …) and nature of contaminants. A previous study [3] highlighted the need to create oxide layers in a controlled manner for the study the efficiency of laser decontamination and to optimize the cleaning process. In this paper, we present the recent results of the growth of micrometric oxide layer contaminated with non-radioactive element and the preliminary test of laser cleaning.
The aim of the growth of oxide layers on metallic surfaces with a non-radioactive contaminant is to enable the study and the development of decommissioning techniques without the problems of availability of radioactive samples and the constraints of work in hot laboratories. The goal of our work was also to find a way of formation of oxide layers with desired characteristics (thickness, Eu-concentration).
2 Oxidation of stainless steel 304L with
non-radioactive marker
We investigate a method to form a reproducible and micrometric oxide layer on stainless steel AISI 304L (304L SS) with a volumic distribution of europium (Eu) in the layer thickness. This distribution is chosen to consider the Eu as a simulation of a radioactive element (actinide) Thus, the efficiency of decontamination can be determined
ICRS-13 & RPSD 2016
by the measurement of Eu concentration before and after laser decontamination. The initial composition of the 304L SS samples was analyzed via glow discharge mass spectrometry (GDMS) and no trace of Eu were found with a detection limit of 100 ppb.
2.1 Procedure
The samples (30 mm x 30 mm x 3 mm) were cut by water jetfrom a cold-rolled 304L stainless steel sheet. The coupons were cleaned in an ultrasound bath with ethanol and the average surface roughness was Ra = 0.46 µm. The contamination is made before oxidation by deposition of a solution of Eu(NO3)3 in water at a concentration of 2000 or 4000 ppm in Eu depending of the studies. The solution is sprayed with a nebulizer and the flow is controlled by a pump device. The samples are heated using a hot plate at 200°C until the deposition is dried. We can estimate that the deposited amount of Eu is 0.5 up to 1.0 mg/cm² (2 − 4 × 10¹⁸ atoms/cm²). Some samples without
contamination served as control samples.
Pre-oxidation is carried out by laser treatment in air at atmospheric pressure. The set up comprises an ytterbium fiber laser (Gaussian beam, λ = 1064 nm, mean power up to 20 W, frequency
𝜈
= 20 kHz, pulse duration τ = 110 ns at FWHM), a focusing lens (f = 420 mm) resulting in a laser beam waist radius𝜔
= 84 ± 2 µm (at 1/e² intensity level), a scanning system and an air aspiration system. For the oxidation regime, the samples were mounted on a micro control assembly and placed at the lens focal. The power of the beam varied between 5 and 18 W in order to study a range of fluence maximum per pulse (F) between 2.2 and 7.8 J/cm² (maximal fluence on the beam axis). The laser treatment is done by horizontal and vertical scanning (figure 1). The horizontal scanning is characterized by the scanning speed 𝑉 in order to define the step ∆𝑥 between two consequent laser spots. The vertical scanning is defined by the vertical step ∆𝑦 between two parallel lines.
Figure 1. Scanning regime schema. The continuous arrow
represents the laser beam path.
The scan speed and the distance between lines were chosen to provide a high spatial overlapping between two successive spots from 80 to 95 %. The overlapping percentage is calculated using the laser spot beam diameter at 1/e². The laser treatment is defined by the maximum beam fluence F per pulse and the energy amount accumulated Eacc per surface unit of the sample after the treatment. F is calculated as follow:
F = E/S = 2P/
𝜈𝜋𝜔
2 (1)where E is the energy per pulse in J and S the surface of the laser beam in cm². The energy per pulse is the average power of the laser (P) divided by the repetition rate of 20 kHz. Eacc is determined as follow:
Eacc=P∆t/Ss (2)
where ∆t is the treatment duration and Ss is the treated surface in cm². In this work, we study oxide layers formed by an accumulated energy in a range from 50 to 600 J/cm². After laser treatment, the oxide samples are exposed in the furnace at 600°C for a duration of 50 or 100 hours at in air at atmospheric pressure and the cooling down is done in the furnace switched off regime. Furnace treatment allows us to grow the oxide layer to a thickness depending of the furnace duration.
2.2 Oxide coatings characterization
The obtained oxide layers were characterized and analysed by glow discharge optical emission spectrometry (GD-OES), glow discharge mass spectrometry (GDMS), scanning electron microscopy (SEM) coupled with an energy dispersive X-ray analyser (EDX), X-ray diffraction (XRD) and micro-Raman spectroscopy. The oxidation procedure results in the formation of Eu-contaminated oxide layers with a thickness from 200 nm to 4.5 µm depending of the set of laser parameters and heating duration.
The Eu-contaminated layer formed after the pre oxidation by laser was analyzed by GD-OES and is presented on figure 2. SEM image (back scattering electrons) and GD-OES profile of a representative oxide layer (Eu initial contamination of 900 µg/cm², Eacc=600 J/cm², oxidation time in furnace of 50h) are shown on figure 3 and 4. One can see that the laser treatment results in a formation of an oxide layer (mostly Fe-oxide) of a thickness of 500 nm with Eu distribution in the whole oxide thickness and with an average concentration up to 5 % in weight.
Figure 2. GD-OES profile of a Eu-contaminated oxide layer on
304L SS after laser preliminary treatment (9W, overlapping of 95%, Eacc=600 J/cm²).
Figure 3. GD-OES profile of a Eu-contaminated oxide layer on
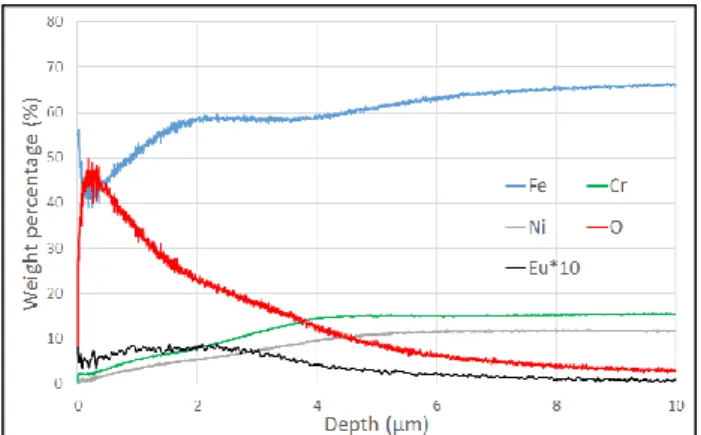
304L SS after laser preliminary treatment (9W, overlapping of 95%, Eacc=600 J/cm²) and an oxidation by furnace (50h, 600°C). The oxidation by furnace allow us to have a layer of 4.5 µm with a contamination of 0.5% in weight of Eu in the whole thickness. In figure 3, the scale of Eu-distribution is multiplied by 10 in order to be seen in the profile. In both figure 2 and 3, the distribution of Eu follows the O-distribution. This means that the contamination is strictly in the oxide layer and has not been detected in the metal bulk, as was expected in order to use europium as contamination marker.
Figure 4. SEM image (5 000x) of a cross section of a
Eu-contaminated oxide layer on 304L SS after laser preliminary treatment (9W, overlapping of 95%, Eacc=600 J/cm²) and an
oxidation by furnace (50h, 600°C).
In the SEM image of the cross section (figure 4) the lightest parts match with Eu-rich zones (10% of weightby EDX analysis) and the rest is mostly ferrous oxide whereas the GD-OES analysis (figure 2 and 3) show that the contaminant is implemented in the whole oxide. The resulting contamination level in Eu appeared to be lower than the detection limit of EDX, XRD and micro-Raman methods. The monitoring of the Eu was made by GD-OES and GDMS which have detection limits at respectively 100 ppm and 100 ppb.
Figure 5. SEM image (1 500x) and EDS analysis (%Wt) of a
cross section of a Eu-contaminated oxide layer on 304L SS after laser preliminary treatment (9W, overlapping of 95%, Eacc=600
J/cm²) and an oxidation by furnace (50h, 600°C). The peeling of the oxide during sectioning allowed us to access to an intern and
an extern layer.
For the thick oxide layer, the SEM image (figure 5) and GD-OES profiles (figure 2) lead to the assumption of the presence of an outer thicker layer mainly composed by a Fe-rich oxide (zone 1 in figure 5) and an inner one enriched in Cr and Ni (zone 2 in figure 5). Nevertheless, the GD-OES profile (figure 3) did not confirm this hypothesis. The micro-Raman spectroscopy (laser wavelength λ = 532 nm) and XRD analysis (grazing incidence, θ = 1°) of this sample showed mainly the formation of hematite Fe2O3 and we can assume the presence of a Fe-Cr spinel. This structure appeared to be similar to the oxide layers in industrial conditions [5]. The DRX analysis showed the same results for samples with and without Eu and were not able to reveal any specific phase with Eu. Our result is different than the one of a previous study of oxidation by furnace of 304L SS coupons contaminated by ytterbium [6]. In the study of Riffard et al., the contaminated layer are thinner and the oxide is composed mainly a Cr-oxide, Cr2O3. Actually experiments and previous studies [6] [7] showed the influence of rare earths as inhibitors of oxidation. The advantage of our procedure is to implement the Eu by a first oxide layer in order to continue the growth of this layer by furnace despite the presence of Eu.
Our studies in order to find the optimal oxidation condition to control the thickness of the oxide layer allowed us to test different laser regime and furnace oxidation duration.
2.3 Effect of oxidation parameters
The first step of our study was to determine the influence of the laser parameters on the preliminary oxide layer. To do so, we varied the accumulated energy amount on the sample surface from 50 to 300 J/cm² by using several laser power (5, 9, 14 and 18 W) and 80 or 90 % of spatial overlap. We could notice that the continuous preliminary oxide thicknesses were from 20 to 140 nm thick (figure 6).
ICRS-13 & RPSD 2016
The oxide layers seem to grow linear with the accumulated energy amount.
Figure 6. Oxide thicknesses resulting for different laser
irradiations at 5, 9, 14 and 18 W and 80% overlap (in blue) and 90% overlap (in orange).
Moreover, in the case of the treatments at 18W/80% overlap and 5W/90% overlap, the oxides are quite similar in thickness although the fluences per pulse are different. This result highlights the fact that the principal oxidation parameter is the accumulated energy amount and not the fluence per pulse or the spatial overlap. The same experiments were performed without Eu-contamination and it appears that the presence of Eu did not interfere in the oxidation by laser.
In order to span a large variety of laser treatment, the laser fluence varied from 2.2 to 7.8 J/cm² per pulse. This laser treatment can lead to surface heating, melting or even ablation regarding to the irradiation regime. In the case of a nanosecond pulse, the laser wave is absorbed by the surface by the electrons excitation and transmitted to the metal lattice by relaxation. This implies the localized heating of the metal bulk, its oxidation and, possibly, its melting. The formation of the oxide during the laser scanning modifies the physical properties and the interaction regime between laser and the oxide surface. Interferences between in coming and out coming beam can occur because of the presence of this semi-transparent oxide and imply temperature oscillations [8]. According to [9], the theoretical laser melt threshold fluence can be estimated by:
Φm = (√𝜋/2)𝜅θm(𝜏/D)1/2 (3) where 𝜅=13 W/m.K is the thermal conductivity, 𝜃=1859 K - the melting temperature, 𝜏=110 ns is the laser pulse duration and D=3,8.10-6 m²/s, the thermal diffusivity[10]. This fluence represent the minimum fluence absorbed by the surface that leads to the surface melting. In our study, Φm = 0.36 J/cm². The absorptivity of the surface is A = 0.35 and so the melt threshold fluence can be estimated to 1 J/cm² which is lower than the laser fluences used in the preliminary treatment. SEM observations (figure 7) of
single impacts of laser pulse in the pre oxidation conditions showed proof of fusion during the treatment.
Figure 7. SEM image (x 700) of single impact on 304L SS a
different laser treatment: (a) 9W (4.1 J/cm²), (b) 14W (6.3 J/cm²).
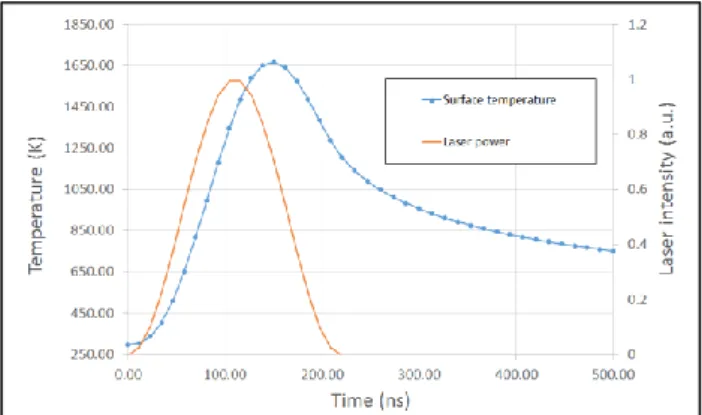
An analytical model [11] were used to simulate laser heating of a metallic surface by nanosecond pulse radiation. The temperature distribution spatial or evolution in time can be determined. The simulation of a single impact of a 1064 nm-pulse with a duration of 110 ns at a frequency of 20 kHz on a 304L stainless steel substrate were performed for different laser fluence. At a low fluence (1 J/cm²), we can see that the temperature at the surface rise to its maximum of 1650 K after 150 ns and after 500 ns, the metal temperature is 750 K (figure 8). We can assume that the increase of the laser pulse energy can lead to the melting temperature (𝜃=1859 K). The simulation condition (F=1J/cm²) is coherent with the melt threshold calculated in equation (3). When the maximum temperature is reached, the temperature profile in depth of the shows that the thermally affected zone is sub micrometric, like the resulting oxide layers.
Figure 8. Temperature at the surface on the laser beam axis
during a single laser pulse of 110 ns for a fluence of 1 J/cm².
Surface temperature calculated at 50 µs after laser shot with F=1 J/cm² is still at 330 K. Thus, the pulse energy accumulation at the surface metal has a weak influence on the final surface temperature after one single pulse. Nevertheless, the simulation of multi impacts is needed to determine this influence during the laser treatment. Moreover, during laser scanning, the step between two pulses is less than 10% of the beam dimension, we can consider that the treatment is performed on a surface already disturbed by the previous pulse. For the next simulations, we will have to take into account the oxidation by multi pulse on a substrate of 304L stainless steel with an oxide layer. More simulations need to be carried out but we can suppose that the oxidation is made
from a liquid layer. This state allowed Eu to penetrate into the metal bulk and led to a fixed contamination of the sample surfaces.
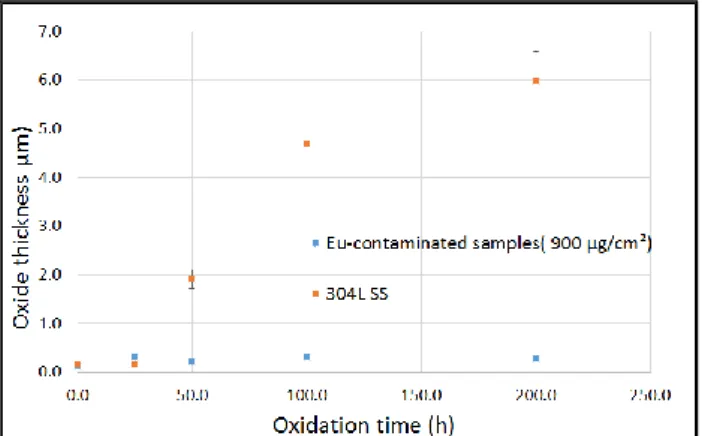
In a second part, the influence of the treatment duration on the oxide layer characteristics was studied. Contaminated samples (900 µg/cm² of Eu) were first preliminary treated by laser (14W, 90% overlap) and oxidized in a furnace at 600°C for duration from 25 to 200h. The same experiments were performed with 304L samples without contamination and the preliminary oxide layer obtained by laser was 100 to 150 nm-thick. The figure 9 shows two main phenomena.
Figure 9. Oxide thicknesses resulting for different oxidation
duration of Eu-contaminated samples (blue) and blank samples (orange).
On one hand the contamination of Eu stopped the oxidation as expected in the literature [6] [7]. On the other hand for blank samples, the oxide growths following a parabolic kinetics [6]. For the parabolic part of the curve, the parabolic rate is 𝑘 = 6.14 ± 0.75 × 10⁵ µ𝑚2/𝑠. Unlike the laser treatment, the oxidation by furnace is influenced the Eu-contamination. Indeed the experiments presented table 1 shows that the increase of the concentration of the surface contamination implies the limitation of the thickness of the oxide.
Table 1. Oxide thickness resulting of a laser treatment (237 J/cm²
accumulated) and a furnace oxidation (100h, 600°C) with different contamination concentration in Eu
Surface contamination of Eu before oxidation treatment (µg/cm²) Oxide thickness (µm) 0 4.7 ± 0.5 500 1.6 ± 0.2 900 0.30 ± 0.01
Even with the behavior of oxidation inhibitor of the Eu, our procedure of oxidation allows us to carry on with the oxidation process. Knowing the influence of the main
parameters (laser energy accumulated, furnace oxidation duration or Eu concentration), the thickness of the resulting oxide layer can be controlled and adjusted regarding to the study.
3
Laser decontamination of oxidized
metal surfaces
The literature shows that decontamination of metallic surfaces by excimers [4] and ytterbium fiber laser [3] is successful with decontamination percentage up to 99 % for thick stainless steel. The oxide layer is removed efficiently for the first shots but in a second phase, the decontamination stagnates. We supposed that this limitation of the laser cleaning is the result of two phenomena. On one hand, the trapping of the oxide and contaminants into micro cracks of the materials prevent the laser beam to access full decontamination. And on the other hand, the heating of the surface during the laser treatment leads to the penetration of the contaminants in the metal bulk.
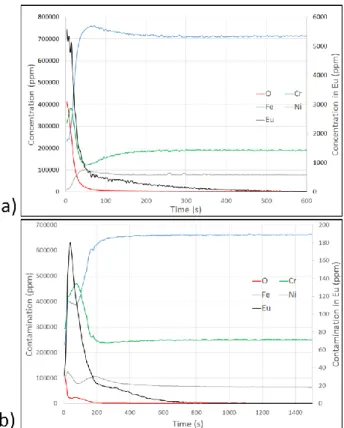
We proceeded to the decontamination of the contaminated oxide layer by laser. The decontamination set up is the same that the pre-oxidation one. The fluences applied to ablate the oxide layer is in the range of 4 to 8 J/cm² with a spot overlapping of 80 % (figure 10-11). The samples were analyzed by GD-OES in order to determine the oxide layer thickness but since the remaining Eu-concentration is near the detection limit of GD-OES, the GD-MS method was also used (figure 11). The figure 11 present the GD-MS profiles for a oxide layer obtained after laser preliminary treatment (14W, overlapping of 90%, Eacc=237 J/cm²) and an oxidation by furnace (50h, 600°C) With and without decontamination treatment. After oxidation, the oxide layer is 230 nm-thick and with an Eu-contamination of 0.55 % (5 500 ppm) and we can see that after 1 pass at 14W and 80% overlapping, the resulting Eu-concentration is less than 200 ppm. The decontamination treatment led also to the formation of an oxide layer of 300 nm.
Tests are carried out in order to compare the results to the literature and to find optimal laser parameters to decontaminate contaminated layers. Special care was taken to reduce thermal effects like oxidation or melting which can caused the penetration of Eu into the bulk.
Figure 10. Overview of oxidized 304 SS samples with an initial
layer thickness of 4.5 µm before and after laser cleaning (5.9 J/cm² per pulse and 80% of overlapping).
ICRS-13 & RPSD 2016
Figure 11. GD-MS profiles of a Eu-contaminated oxide layers
on 304L SS (a) before decontamination treatment; (b) after decontamination treatment (14W, overlapping of 80%, F=5.9 J/cm² per pulse, 1 pass).
4 Conclusion
Our goal was to manage different way of Eu-implementation in oxide layer of 304L SS samples in order to carry out studies with non-radioactive contaminants and conventional equipment. The first results shown the Eu-contamination in volume of a micrometric oxide layer with similar characteristics as for metal samples oxidized in real conditions. These oxides layers were prepared with a contamination by Eu solution spraying, a pre-oxidation by laser and a final treatment by furnace to continue the oxidation. The thicknesses of the oxides are from 0.2 µm up to 4.5 µm with a mean Eu-concentration of 0.5 % of weight exclusively in the oxide layer. This method by furnace treatment simulates the oxidation of stainless steel exposed to high temperature.
The influence of oxide thermophysical and optical characteristics (composition, absorption coefficient …) on decontamination mechanism are studied by numerical simulation code that was developed in our laboratory. The experimental results will also be used to improve and validate the model of laser heating of micrometric layer on metallic substrate.
Finally, the formation of contaminated oxide layer with controlled characteristics is a first step for the study of laser cleaning of metallic surface with micrometric cracks.
References
1. F. Brygo, Ch. Dutouquet, D. Le Guern, R. Oltra, A. Semerok, J.M. Weurlesse, Appl. Surf. Sci. 252, 2131– 2138 (2006)
2. F. Champonnois, F. Beaumont, C. Lascoutouna, US Patent 20110315666 A1 (2009)
3. A. Leontyev, PhD thesis, Université Paris Sud - Paris XI, (2011)
4. Ph. Delaporte, M Gastaud, W. Marine, M. Sentis, O. Uteza, P. Thouvenot, J.L. Alcatraz, J.M. Le Samedy, D. Blin, Appl. Surf. Sci., 197-198, 826-830 (2002) 5. Z. Homonnay, E. Kuzmann, K. Varga, Z. Nemeth, A.
Szabo, K. Rado, K.E Mako, L. Köver, I. Cserny, D. Varga, J. Toth, J. Schunk, P. Tilky, G. Patek, J. Nucl. Mater., 348, 191-204, (2006)
6. F. Riffard, H. Buscail, E. Caudron, R. Cueff, C. Issartel, S. Perrier, Appl. Surf. Sci., 252, 3697-3706 (2006)
7. N. Karimi, PhD thesis, Université Blaise Pascal-Clermont-Ferrand II, (2007)
8. Wautelet, M. Appl. Phys. A, 50, 131-139 (1990) 9. D. Bäuerle, Chemical Processing with Lasers
(Springer, Berlin, 2000)
10. P. Lacombe, G. Béranger, B. Baroux, Les aciers
inoxydables, (Les éditions de physique, 1990) (in
French)
11. A. Semerok, S. V. Fomichev, J.-M. Weulersse, F. Brygo, P.-Y. Thro and C. Grisolia, J. Nucl. Mater.,