HAL Id: lirmm-00405225
https://hal.umontpellier.fr/lirmm-00405225v2
Submitted on 27 Oct 2017HAL is a multi-disciplinary open access
archive for the deposit and dissemination of sci-entific research documents, whether they are pub-lished or not. The documents may come from teaching and research institutions in France or abroad, or from public or private research centers.
L’archive ouverte pluridisciplinaire HAL, est destinée au dépôt et à la diffusion de documents scientifiques de niveau recherche, publiés ou non, émanant des établissements d’enseignement et de recherche français ou étrangers, des laboratoires publics ou privés.
Maria Papaiordanidou, David Guiraud, Alain Varray
To cite this version:
Maria Papaiordanidou, David Guiraud, Alain Varray. Kinetics of neuromuscular changes dur-ing low-frequency electrical stimulation. Muscle and Nerve, Wiley, 2010, 41 (1), pp.54-62. �10.1002/mus.21427�. �lirmm-00405225v2�
Kinetics of neuromuscular changes during low-frequency electrical stimulation
MARIA PAPAIORDANIDOU1,MSc, DAVID GUIRAUD2, PhD and ALAIN VARRAY1, PhD
1 EA 2991 Motor Efficiency and Deficiency Laboratory, University of Montpellier 1 2 LIRMM, DEMAR team, INRIA, CNRS, University of Montpellier 2
Acknowledgements
The authors would like to thank O. Girard and J.P. Micallef for their contribution to the study and M. Djilas for his help in data analysis.
The study was supported by the French Superior Education and Research Ministry
Correspondence: Maria Papaiordanidou
University Montpellier 1, Faculty of Sports Sciences 700 avenue du Pic Saint Loup
34090, Montpellier France
Tel : +33 467415735 Fax : +33 467415704
e-mail: [email protected]
Running title: Neuromuscular fatigue during ES
LIST OF ABBREVIATIONS ANOVA ANalysis Of VAriance Ca2+ calcium ions
CT Contraction Time
EMG electromyographic activity ES electrostimulation
Hmax Maximal Hoffmann reflex HRT Half Relaxation Time H+ hydrogen ions
IHmax Intensity where Hmax was obtained
ISM Supramaximal Intensity, i.e. 10% above the intensity where Mmax was obtained
LOA Level Of Activation MF Median Frequency Mmax Maximal M-wave
MRFD Maximum Rate of Force Development MRFR Maximum Rate of Force Relaxation MVC Maximal Voluntary Contraction Pi Inorganic phosphate
Pt Peak Twitch RMS Root Mean Square
ABSTRACT
The purpose of the present study was to examine the time course of neuromuscular fatigue components during a low-frequency electrostimulation (ES) session. Three bouts of 17 trains of stimulation at 30 Hz were used to electrically induce fatigue in the plantar flexor muscles. Before and after every 17-train bout, torque, electromyographic activity [expressed by Root Mean Square (RMS) and Median Frequency (MF) values], evoked potentials (M-wave and H-reflex) and the level of voluntary activation (LOA, using twitch interpolation technique) were assessed. Torque during maximal voluntary contraction decreased significantly from the very first stimulation bout (-6.6 ± 1.11%, P<0.001) and throughout the session (-10.32 ± 1.68% and -11.53 ± 1.27%, for the second and third bouts, respectively). The LOA and RMS/Mmax values were significantly decreased during the ES session (-2.9 ± 1.07% and -17.5 ± 6.14%,
P<0.01 and P<0.001, respectively, at the end of the protocol), while MF showed no changes.
The Hmax/Mmax ratio and Mmax were not significantly modified during the session. All twitch parameters were significantly potentiated after the first bout and throughout the session (P<0.001). The maximal torque decrease was evident from the early phase of a low-frequency ES protocol, with no concomitant inhibition of motoneuron excitability or depression of muscle contractile properties. These results are consistent with an early failure of the central drive to the muscle.
Key words: triceps surae, H-reflex, potentiation, muscle afferents, central command,
1. INTRODUCTION
In recent years, a large body of research has focused on the benefits of electrical stimulation (ES) for muscle strengthening and functional rehabilitation programs.35 The contraction evoked by ES differs from voluntary contraction in the pattern of motor unit recruitment. ES alters the recruitment order to either a preferential recruitment of fast motor units12 or a non-selective recruitment,21 although consensus on this point is lacking.18 Whatever the recruitment order, however, this technique imposes a spatially fixed and temporally synchronous pattern of activation, leading to higher metabolic solicitation.19,34 These phenomena give rise to earlier and more severe fatigue than voluntary contractions.
An important concern in the research on electrical stimulation is how to avoid this rapid fatigue onset. Some results showed that lower stimulation frequencies led to less fatigue development.5 Consequently, instead of using high stimulation frequencies (up to 120 Hz) to maximize the force gains, as done in athletic sessions,17 rehabilitation programs use lower
frequencies (< 50 Hz)30 to delay fatigue. Not only do high and low frequencies influence the time course of fatigue differently, but they also induce different physiological events implicated in neuromuscular fatigue. In in vitro or in situ preparations, high-frequency stimulation provoked force decline due to failure of muscle excitability,3,8 while the decline in force after low-frequency stimulation was attributed to metabolic changes influencing the contractile apparatus.8 This means that the physiological events occurring during high-frequency stimulation cannot be extended to protocols using low-high-frequency stimulation. In addition, these results cannot be directly extrapolated to human fatigue studies, since central command regulation was not taken into consideration. Neuromuscular fatigue is well-known to be complex and multifactorial, involving several mechanisms and processes along the pathway from brain to muscle.16,23,28 These include insufficient neural drive to the muscle, due to changes in the motor cortex command, the descending pathway or motoneuron
excitability,13 and/or alterations at a peripheral level, involving sarcolemmal excitability and muscle contractile properties.10
A better understanding of human fatigue components under ES is thus called for and an integrated approach, i.e., from motor command to muscle response, would be well-adapted. Unfortunately, such investigations remain rare because it is generally assumed that electrically evoked contractions do not involve the central nervous system. However, several lines of evidence suggest that central mechanisms are implicated during ES: activation of specific brain areas (primary motor cortex, cerebellum, thalamus) when ES is applied over the limbs,31 increase in the voluntary activation level and muscle electromyographic activity after a 4-week ES training program,17 and contralateral force gains in the non-trained muscle after ES.20,24 Additional support for neural mechanism involvement during ES is provided by research showing that the change in stimulation parameters (greater pulse width and higher frequency) induces increased afferent feedback, leading to enhanced spinal motor neuron excitability.7 Furthermore, a recent study on electrically induced fatigue6 observed a central fatigue component after an ES protocol, providing evidence that ES is not purely peripheral. However, these results cannot be extrapolated to fatigue induced by low-frequency stimulation, as used in rehabilitation programs, because, as seen previously, the physiological events clearly differ with the stimulation frequency.
The fatigue induced by low-frequency stimulation therefore needs to be characterized and should be coupled with information on the time course of the neuromuscular changes. Having only pre- and post-session information on fatigue development precludes the identification of acute and potentially transitory physiological phenomena associated with ES-induced fatigue. Moreover, information on the time course of muscle fatigability during low-frequency ES might help clinicians to develop rehabilitation methods for optimal stress of the neuromuscular system in patients with neurological disorders.
The aim of the present study was to identify the different fatigue components raised by 30-Hz electrical stimulation, a frequency more suitable to functional rehabilitation programs. We particularly focused on the time course of the neuromuscular changes associated with this stimulation pattern.
2. MATERIALS AND METHODS
2.1. Subjects
Twenty healthy males (mean age 25.47 ± 3.47 yr) volunteered to participate in this study. After being informed of the study purpose and the risks associated with participation, they gave written consent. None of the subjects suffered from ankle injuries or had recently undergone an operation of the lower limb. All were asked to maintain normal daily activity during the study period. The study was conducted in accordance with the principles of the Declaration of Helsinki.
2.2. Experimental design
Subjects visited the laboratory on two occasions, separated by 3 days. During an initial session, they were introduced to and familiarized with the experimental procedure and the apparatus. They became accustomed to tibial nerve electrical stimulation, as well as to performing maximal voluntary contraction (MVC) of the plantar flexor muscles. Maximal tolerated intensity for the ES protocol was determined during this familiarization session.
The experimental session began with a standard warm-up, consisting of 5 min of walking at 5 km.h-1 on a treadmill (S2500, HEF Techmachine, Andrézieux-Bouthéon, France), and continued with neuromuscular tests taking place every 17 stimulation trains (Figure 1).
2.3. Neuromuscular tests
Neuromuscular tests were performed before (pre) and after every 17 stimulation trains of an ES protocol of the triceps surae muscle (gastrocnemius medialis and lateralis, soleus muscle), i.e., post17 (at the end of 1st to 17th train), post34 (at the end of the 18th to 34th train) and post51 (at the end of 35th to 51st train). The tests consisted of MVCs and electrically
evoked contractions, and torque and EMG activity were recorded throughout testing. The procedure lasted 90 – 120 s.
Torque measurement: Torque of the right plantar flexor muscles was recorded by means of a calibrated dynamometric pedal (Captels, St-Mathieu de Treviers, France), interfaced with an acquisition system (Biopac MP100, Biopac Systems, Inc., Santa Barbara, CA). Subjects were seated on a chair with their ankle at 90°, while the foot was immobilized and securely strapped on the pedal.
EMG measurement: EMG activity of the gastrocnemius medialis and tibialis anterior was recorded using bipolar silver chloride circular surface electrodes with a diameter of 9 mm (Contrôle Graphique Medical, Brie-Comte-Robert, France). In order to minimize impedance (< 5 kΩ), the skin was shaved, abraded and cleaned with alcohol. After verification of an appropriate M-wave acquisition (single response and highest amplitude), electrodes were placed over the middle of the muscle belly, in the muscle fiber direction, with an interelectrode distance of 20 mm. The reference electrode was placed on the left wrist. The EMG signal was amplified (gain = 1000) and recorded at a sampling frequency of 4096 Hz (Biopac MP100, Biopac Systems, Inc., Santa Barbara, CA).
2.3.1. Electrically evoked contractions
Electrical stimulations were delivered to the tibial nerve by a high-voltage, constant current stimulator (DS7AH, Digitimer Ltd., Hertfordshire, UK). The cathode (a silver chloride surface electrode) was fixed on the popliteal fossa and the anode (a rectangular 50-cm2 surface electrode, Medicompex, Ecublens, Switzerland) was placed beneath the patella. Rectangular, monophasic pulses of 200-µs were used.
M-wave and H-reflex recruitment curves: The individual stimulation intensity was identified at rest by progressively increasing the amperage (10-mA increment, every 5 s) from 10 mA until no further increase in twitch mechanical response (peak value) and M-wave
amplitude (Mmax) was noted. This intensity was further increased by 10% to obtain supramaximal intensity (ISM), which was used during the entire testing procedure. At this
intensity, synchronous recruitment of all muscle fibers was ensured.
Parallel to the M-wave recruitment curve, the H-reflex response was observed. Subsequently, for more precise identification of the intensity at which Hmax was obtained (IHmax), 2-mA increments (every 10 s) were used. After each 17-train bout, IHmax was further
adjusted (2-mA increments) in order to obtain Hmax (IHmax adjusted).
Three twitches at ISM (interspaced by 5 s) and three twitches at IHmax (interspaced by
10 s) were delivered at rest (before the MVC), while subjects maintained the same posture and a motionless head.37 The mechanical responses associated with the three twitches at ISM
were recorded and averaged for further analysis. The following contractile parameters were calculated: peak twitch (Pt), defined as the maximum value of torque production to a twitch; contraction time (CT), the time needed from the beginning of the contraction to Pt; the maximum rate of force development (MRFD), the peak value of the derivative calculated in the ascending part of the torque curve; the half-relaxation time (HRT), the time required for the torque to decrease by 50%; and the maximum rate of force relaxation (MRFR), the peak value of the derivative calculated in the descending part of the torque curve.
The EMG activity associated with the twitches eliciting Mmax and Hmax was also recorded and averaged for the analysis. The peak-to-peak amplitude and duration of Mmax were calculated, as well as the latency from the stimulus artifact to the first deflection of the M-wave. The amplitude of Hmax was also calculated and then normalized with respect to Mmax (i.e., Hmax/Mmax ratio) to avoid any implication of changes in neuromuscular junction or membrane excitability. In the present work, we studied Hmax at rest to avoid any involvement of the oligosynaptic pathways observed during a weak voluntary contraction.28 Moreover, since the H-reflex amplitude is subject to modulations occurring at a pre-synaptic
level,37 a rigorous methodology was followed: subjects seated in a fixed position, an appropriate interval between stimulations evoking the H-reflex, and verification of no antagonist EMG activity.
2.3.2. Maximal voluntary contractions
Before the ES protocol, all subjects performed three MVCs of the plantar flexors, interspaced by 1 min. After every 17-train bout, they performed two MVCs, interspaced by 30 s. They were asked to maintain a maximal force plateau for 4 s. According to the twitch interpolation technique,26 a doublet (10-ms interval) at ISM was delivered when the plateau
was reached (superimposed doublet), as well as 2 s after the MVC (control doublet). All subjects were verbally encouraged to perform maximally and the best trial was used for subsequent analysis.
Maximal torque (mean value of 500 ms on the plateau) and the amplitudes of the superimposed and control doublets were studied. The level of voluntary activation (LOA) was calculated as follows:
LOA (%) = [1 – (superimposed doublet/control doublet) x 100].1
During the MVC, the EMG activity of the gastrocnemius medialis was quantified by the RMS (Root Mean Square) value of the filtered signal (10-500 Hz), at a 500-ms interval corresponding to the maximal torque. In order to reduce the influence of peripheral factors,23 the RMS value was subsequently normalized to Mmax (RMS/Mmax). A spectral analysis was also performed during the MVC in order to calculate the Median Frequency (MF) of the EMG activity.
2.4. ES fatiguing protocol
The fatiguing exercise was composed of three bouts of 17 stimulation trains. Two rectangular electrodes (10 x 5 cm) were placed over the subject’s triceps surae, one 5 cm
beneath the popliteal cavity and the other beneath the insertion point of the medial and lateral heads of the gastrocnemius muscle to the Achilles tendon. A portable stimulator was used (Cefar Physio 4, Cefar Medical AB, Lund, Sweden) to deliver constant current, rectangular, symmetric, biphasic pulses. Train characteristics were the following: frequency 30 Hz, pulse duration 450 µs, and duty cycle 40% (4 s on, 6 s off). Trains were delivered at the maximal tolerated intensity (mean intensity used was 29.9 ± 1.54 mA).
Evoked torque by stimulation trains was recorded and averaged for the first five and last five trains of each stimulation bout in order to obtain muscle response to the stimulation trains.
2.5. Statistical analysis
All variables recorded before, during and after the ES protocol were tested using a one-factor (time) ANOVA test for repeated measures (pre, post17, post34, post51). In the case of a significant effect of time on the variables (P < 0.05), the LSD Fisher post-hoc test was used. Data are reported as means ± standard error of the mean (SEM) and the statistical significance was set at P < 0.05. All statistical analyses were performed with Statistica 7.1 (StatSoft, Inc., Tulsa, OK).
3. RESULTS
3.1. Torque and muscle activation during MVC
The MVC torque significantly decreased (F3 = 32.26, P < 0.001) from 79.91 ± 2.67 Nm at pre to 70.65 ± 2.58 Nm at post51 (Figure 2). The decrease was significant from the first exercise bout [74.48 ± 2.41 Nm, P < 0.001]. At post34, torque was further decreased [71.56 ± 2.67 Nm, P < 0.001], reaching the minimal value at post51 [70.65 ± 2.58 Nm]. Compared with the initial values, this represented a decrease of 6.6 ± 1.11%, 10.32 ± 1.68% and 11.53 ± 1.27% at post17, post34 and post51, respectively.
The level of voluntary activation significantly decreased throughout the ES protocol from 97.92 ± 0.91% at pre to 96.52 ± 1.27%, 96.2 ± 1.1% and 95.2 ± 1.66% at post17, post34 and post51, respectively (F3 = 3.89, P < 0.05) (Figure 3).
Both raw RMS values and normalized to the M-wave amplitude (RMS/Mmax) of the gastrocnemius medialis muscle significantly declined during the exercise protocol (F3 =
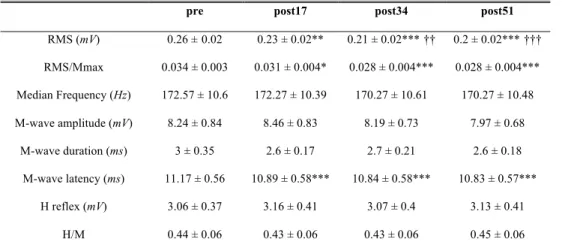
17.44, P < 0.001 and F3 = 6.32, P < 0.001, respectively). The significant decrease in the RMS and RMS/Mmax values was observed from post17 and persisted throughout the ES protocol. The MF did not significantly change (F3 = 1.04, P = 0.38), as indicated in Table 1.
3.2. H-reflex
The ES protocol induced no changes in H-reflex amplitude or the Hmax/Mmax ratio (F3 = 0.79, P = 0.5 and F3 = 0.61, P = 0.6, respectively) (Table 1).
3.3. M-wave, contractile properties and muscle response to stimulation trains
Neither the amplitude nor the duration of the M-wave was significantly modified by the ES session (F3 = 1.42, P = 0.24 and F3 = 2, P = 0.12, respectively). The M-wave latency was significantly decreased from the first exercise bout (F3 = 10.08, P < 0.001).
Pt was significantly increased during the exercise (F3 = 31.87, P < 0.001). A significant increase was observed from post17 and was maintained over the entire protocol (Figure 4). All twitch parameters presented significant improvement at post17 that persisted until the end of the ES session (Table 2). Figure 5 presents a typical twitch response to the trains of stimulation.
Muscle response to stimulation trains was preserved at post17 and post34 and was only significantly decreased at post51 (F3 = 4.35; P = 0.01). The torque evoked by stimulation was 30.94 ± 2.37 Nm, 30.77 ± 2.35 Nm, 30.62 ± 2.12 Nm and 28.89 ± 2.38 Nm at pre, post17, post34 and post51, respectively.
4. DISCUSSION
The aim of the present study was to characterize ES-induced fatigue by examining the time course of neuromuscular fatigue components during a low-frequency ES protocol. The main results indicated significant impairment in voluntary torque production from the first stimulation bout (first 17 stimulation trains). This impairment, which persisted throughout the experimental session, could be attributed to changes occurring at a supraspinal level, since muscle excitability and contractile properties, as well as spinal excitability, were preserved.
The ES session caused a significant decrease in voluntary torque production from the very first stimulation bout that persisted over the course of the protocol, reaching a maximal decrease at post51. This result is in accordance with other studies that induced fatigue by electrical stimulation; for example, a 20% decline in MVC torque was reported by Zory et al. (2005) after ES of the knee extensor muscles. The difference in the amplitude of the torque loss can be partly attributed to the muscle group that was targeted but mainly to the fatiguing protocol used. In our study, low-frequency (30 Hz) stimulation was chosen, whereas high-frequency stimulation (75 Hz) was used in the previous work. Greater fatigue development after high-frequency stimulation has been reported,14 and these data are consistent with the interest of using low-frequency stimulation to minimize fatigue. Only Boerio et al. (2005) reported comparable MVC loss (-9%) after high-frequency electrostimulation (75 Hz) of the plantar flexor muscles, which could be explained by the longer resting periods between contractions (smaller duty cycle) used in their protocol. Longer resting periods between electrically induced contractions allow partial recovery from fatigue and provoke smaller torque decreases than smaller inter-contraction intervals.4,5
The decrease in the voluntary torque production of the plantar flexor muscles was accompanied by a significant reduction in the level of voluntary activation, which was evidenced at post34 and persisted for the rest of the protocol. Moreover, EMG activity, expressed both in absolute units and as normalized to the M-wave amplitude (RMS and RMS/Mmax), was significantly diminished from the first stimulation bout. These decreases were evidence of the incapacity of the central nervous system to appropriately drive the muscle. A reduced neural command arriving to the muscle is the result of a reduction in the corticospinal influx arriving to the motoneurons (supraspinal factors) and/or an inhibition of motoneuron excitability (spinal factors).9 In the present study, the hypothesis of reduced excitability of alpha-motoneurons can be excluded, since our results clearly indicate no change occurring at the spinal level (no decrease in the Hmax/Mmax ratio). The preservation of spinal excitability associated with reduced LOA and RMS/Mmax during maximal voluntary contraction is thus highly consistent with a reduced cortical influx reaching the motoneurons.
The reduction in corticospinal impulses engenders changes in motor unit recruitment, expressed by a decreased number of recruited motor units and/or an altered firing rate of these motor units.22 Although the precise mechanisms responsible for the diminished EMG activity cannot be determined, the lack of any change in MF is not consistent with the hypothesis of a reduction in the motor unit firing rate. It is thus likely that their spatial recruitment was altered, leading to decreased RMS and RMS/Mmax values. Failure of the motor cortex to efficiently activate the muscle has been reported after different types of prolonged exercise.16,23 The exact mechanisms that cause reduced efferent signals from the motor cortex have not yet been elucidated, but changes in neurotransmitter concentrations (e.g., dopamine, noradrenalin) seem to be at the origin of this disfacilitation.9 It is worth noting that cortical modifications are usually reported during prolonged exercise. To our knowledge, only Boerio
et al. (2005) described this phenomenon after a short ES session, where high-frequency stimulation was applied. Our results are consistent with and complete their findings. This means that, despite the different physiological events induced by high- and low-frequency stimulation,3,8 the occurrence of fatigue components is quite comparable, whatever the frequency stimulation. In addition, this is the first time that a study has demonstrated the precocious character of supraspinal fatigue under low-frequency stimulation.
The supraspinal component of fatigue observed in the present study could have resulted from the activation of small-diameter thinly myelinated (group III) and unmyelinated (group IV) afferent fibers. These afferents have their free-ending receptors in the skin or the muscle and tendon and are activated during fatiguing contractions by mechanical, chemical and thermal stimuli that may or may not be noxious.25 The exact mechanism by which group III and IV fibers influence the voluntary activation of muscle is still controversial. Some authors have suggested that these afferents project to interneurons that mediate presynaptic inhibition and thus act directly on the motoneuron pool,15,28 while others have advanced the hypothesis of possible supraspinal projections of group III and IV fibers.33 Our results provide evidence of preserved motoneuron excitability and thus support the second theory, according to which group III and IV afferents act upstream of the motor cortex to impair circuits generating motor cortical output descending to the motor neurons.
MVC torque loss was not accompanied by an alteration in wave characteristics. M-wave amplitude and duration give information on the efficacy of signal transmission in the neuromuscular junction and its propagation to the sarcolemma, thus providing an index of sarcolemmal excitability.12 Our results showed that this efficacy was not modified by the ES session. Furthermore, the decreased M-wave latency implied better signal conduction velocity through the motor pathway (including conduction through the motor axon, neuromuscular
transmission and signal propagation along the muscle fibers). It is commonly observed that, contrary to high-frequency electrical stimulation, low-frequency stimulation induces fatigue that does not elicit changes in M-wave characteristics.3,8,15 The present ES protocol did not engender any failure in the action potential propagation.
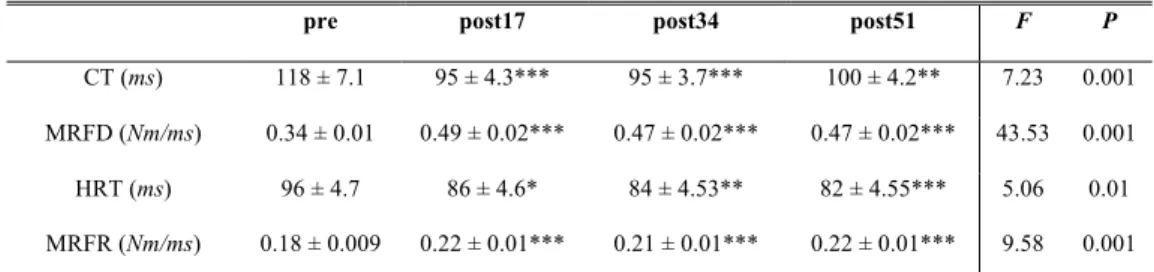
In contrast to the parameters demonstrating impaired central activation, it is particularly striking that the muscle contractile properties, which are an index of excitation-contraction coupling at the peripheral level, were significantly improved from the first minutes of the ES protocol and remained so throughout the entire session. Pt and the parameters related to contraction (CT, MRFD) and relaxation (HRT, MRFR) were enhanced by the exercise protocol, implying more effective excitation-contraction coupling. MVC torque loss thus cannot be attributed to factors distal to the neuromuscular junction, since our results give evidence of a transitory muscle resistance to peripheral alterations. This means that ES evoked central disfacilitation prior to the impairment of contractile properties. The low-frequency stimulation used in the present study could lead to metabolic changes that would influence the mechanical response. Increases in myoplasmic [Pi] and intracellular levels of H+, provoking intramuscular acidosis and subsequent alterations in the Ca2+ cycle, are usually evoked as sources of impairment in the contractile apparatus,8,36 although the role of the latter remains still equivocal.2 Contrary to the expected peripheral failure caused by the present stimulation pattern, a potentiation of muscle contractile properties was observed. Potentiation can be attributed to increased regulatory myosin light chain phosphorylation, which reinforces the myofilament sensitivity to Ca2+.32 Thus, a greater number of actin-myosin cross bridges is formed and their attachment speed is increased.29 These events result in greater Pt and shorter CT, as observed in our work. Furthermore, the increased MRFR and shorter HRT indicate enhanced functioning of the sarcoplasmic reticulum, which pumps Ca2+ and provokes the relaxation of muscle cells. Fatigue and potentiation can coexist, making it
difficult to quantify the respective contributions of these two phenomena in a simple twitch.29 The Pt values at post34 and post51 showed the transient character of potentiation and the beginning of contractile impairment, which was confirmed by the significant decrease in muscle response to stimulation trains only after the end of the protocol.
In conclusion, the present study gives evidence of a central fatigue component that is responsible for the decrease in voluntary torque production during a low-frequency ES protocol. This was attested by the decrease in maximal muscle voluntary activity (decreased LOA and RMS and RMS/Mmax). Given the absence of disfacilitation at the spinal level, this central activation failure is attributed to changes occurring at a supraspinal level. Failure of the central command arriving at the alpha-motoneurons seems the most probable explanation. In the periphery, excitation-contraction processes were enhanced, while transmission-propagation of the signals at the neuromuscular junction and to the sarcolemma was not affected. These results indicate that the central nervous system is implicated in electrically induced fatigue, further substantiating the non-purely peripheral character of this technique even under low-frequency stimulation.
5.
REFERENCES
1. Allen GM, Gandevia SC, McKenzie DK. Reliability of measurements of muscle strength and voluntary activation using twitch interpolation. Muscle Nerve 1995; 18, 593-600.
2. Allen DG, Lamb GD, Westerblad H. Skeletal muscle fatigue: Cellular mechanisms. Physiol Rev 2008; 88, 287-332.
3. Badier M, Guillot C, Danger C, Tagliarini F, Jammes Y. M-wave changes after high- and low-frequency electrically induced fatigue in different muscles. Muscle Nerve 1999; 22: 488-96.
4. Barclay CJ. Effect of fatigue on rate of isometric force development in mouse fast- and slow-twitch muscles. Am J Physiol 1992; 263 (Cell Physiol. 32): C1065-C1072.
5. Binder-Macleod SA and Snyder-Mackler L. Muscle fatigue: Clinical implications for fatigue assessment and Neuromuscular Electrical Stimulation. Phys Ther 1993; 73: 902-10. 6. Boerio D, Jubeau M, Zory R, Maffiuletti NA. Central and peripheral fatigue after electrostimulation-induced resistance exercise. Med Sci Sports Exerc 2005; 37 (6): 973-78. 7. Collins DF. Central contributions to contractions evoked by titanic neuromuscular electrical stimulation. Exerc Sports Sci Rev 2007; 35(3): 102-09.
8. Darques JL, Bendahan D, Roussel M, Giannesini B, Tagliarini F, Le Fur Y et al. Combined in situ analysis of metabolic and myoelectrical changes associated with electrically induced fatigue. J Appl Physiol 2003; 95: 1476-84.
9. Davies JM and Bailey SP. Possible mechanisms of central nervous system fatigue during exercise. Med Sci Sports Exerc 1997; 29 (1): 45-57.
10. Fitts RH. Cellular mechanisms of muscle fatigue, Physiol Reviews 1994; (74): 49-94. 11. Feiereisen P, Duchateau J and Hainaut K. Motor unit recruitment order during voluntary and electrically induced contractions in the tibialis anterior. Exp Brain Res 1997; 114: 117-23.
12. Fuglevand AJ, Zackowski KM, Huey KA, Enoka RM. Impairment of neuromuscular propagation during human fatiguing contractions at submaximal forces, J Physiol 1993; 460: 549-72.
13. Gandevia SC. Spinal and supraspinal factors in human muscle fatigue. Physiol Rev 2001; 81 (4): 1725-89.
14. Garland SJ, Garner SH, McComas AJ. Relationship between numbers and frequencies of stimuli in human muscle fatigue. J Appl Physiol 1988; 65: 89-93.
15. Garland SJ and McComas AJ. Reflex inhibition of human soleus muscle during fatigue. J Physiol 1990; 429: 17-27.
16. Girard O, Lattier G, Maffiuletti NA, Micallef JP, Millet G. Neuromuscular fatigue during a prolonged intermittent exercise. Application to tennis. J Electromyogr Kinesiol 2008; 18 (6): 1038-46.
17. Gondin J, Guette M, Ballay Y, Martin A. Electromyostimulation effects on neural drive and muscle architecture. Med Sci Sports Exerc 2005; 37 (8): 1291-99.
18. Gregory CM and Bickel CS. Recruitment patterns in human skeletal muscle during electrical stimulation. Physical Therapy 2005; 85 (4): 358-64.
19. Hamada T, Hayashi T, Kimura T, Nakao K, Moritani T. Electrical stimulation of human lower extremities enhances energy consumption, carbohydrate oxidation and whole body glucose uptake. J Appl Physiol 2004; 96: 911-16.
20. Hortobagyi T, Scott K, Lambert J, Hamilton G, Tracy J. Cross-education of muscle strength is greater with stimulated than voluntary contractions. Motor Control 1999; 3: 205-19.
21. Jubeau M, Gondin G, Martin A, Sartorio A, Maffiuletti NA. Random motor unit activation by electrostimulation. Int J Sports Med 2007; 28 (11): 901-04.
22. Kent-Braun JA. Central and peripheral contributions to muscle fatigue in humans during sustained maximal effort. Eur J Appl Physiol 1999; 80: 57-63.
23. Lepers R, Maffiuletti NA, Rochette L, Brugniaux J, Millet G. Neuromuscular fatigue during a long-duration cycling exercise. J Appl Physiol 2002; 92: 1487-93.
24. Maffiuletti NA, Zory R, Miotti D, Pellegrino MA, Jubeau M, Bottinelli R. Neuromuscular adaptations to electrostimulation resistance training. Am J Phys Med Rehabil 2006; 85: 167-75.
25. Mense S and Meyer H. Different types of slowly conducting afferent units in cat skeletal muscle and tendon. J Physiol 1985; 363: 403-17.
26. Merton PA. Voluntary strength and fatigue. J Physiol 1954; 123: 553-64.
27. Pierrot-Deseilligny E. Assessing changes in presynaptic inhibition of Ia afferents during movement in humans. J Neurosci Methods 1997; 74: 189-99.
28. Racinais S, Girard O, Micallef JP, Perrey S, Failed excitability of spinal motoneurons induced by prolonged running exercise. J Neurophysiol 2007; 97 (1): 596-603.
29. Rassier DE and MacIntosh BR. Coexistence of potentiation and fatigue in skeletal muscle. Braz J Med Biol Res 2000; 33: 499-508.
30. Scott WB, Lee SCK, Johnston TE, Binder-Macleod SA. Switching stimulation patterns improves performance of paralysed human quadriceps muscle. Muscle Nerve 2005; 31: 581-88.
31. Smith GV, Alon G, Roys SR, Gullapalli RP. Functional MRI determination of a dose-response relationship to lower extremity neuromuscular electrical stimulation in healthy subjects. Exp Brain Res 2003; 150: 33-9.
32. Sweeny HL, Bowman BF, Stull JT. Myosin light chain phosphorylation in vertebrate striated muscle: regulation and function. Am J Physiol 1993; 264: C1085-C1095.
33. Taylor JL, Todd G, Gandevia SC. Evidence for a supraspinal contribution to human muscle fatigue. Clin Exp Pharmacol Physiol 2006; 33: 400-05.
34. Theurel J, Lepers R, Pardon L, Maffiuletti NA. Differences in cardiorespiratory and neuromuscular responses between voluntary and stimulated contractions of the quadriceps femoris muscle. Respir Physiol Neurobiol 2007; 157 (2-3): 341-47.
35. Vanderthommen M and Duchateau J. Electrical stimulation as a modality to improve performance of the neuromuscular system. Exerc Sports Sci Rev 35 (4): 180-85, 2007
36. Westerblad H, Allen DG, Bruton JD, Andrade FH, Lannergren J. Mechanisms underlying the reduction of isometric force in skeletal muscle fatigue. Acta Physiol Scand 1998; 162: 253-60.
37. Zehr PE. Considerations for use of the Hoffmann reflex in exercise studies. Eur J Appl Physiol 2002; 86: 455-68.
38. Zory R, Boerio D, Jubeau M, Maffiuletti NA. Central and peripheral fatigue of the knee extensor muscles induced by electromyostimulation. Int J Sports Med 2005; 26: 847-53.
6. TABLES
Table 1. EMG activity, median frequency, M-wave and H-reflex characteristics pre-exercise and after each of the three exercise bouts.
pre post17 post34 post51
RMS (mV) 0.26 ±0.02 0.23 ± 0.02** 0.21 ± 0.02***†† 0.2 ± 0.02***††† RMS/Mmax 0.034 ± 0.003 0.031 ± 0.004* 0.028 ± 0.004*** 0.028 ± 0.004*** Median Frequency (Hz) 172.57 ± 10.6 172.27 ± 10.39 170.27 ± 10.61 170.27 ± 10.48 M-wave amplitude (mV) 8.24 ± 0.84 8.46 ± 0.83 8.19 ± 0.73 7.97 ± 0.68 M-wave duration (ms) 3 ± 0.35 2.6 ± 0.17 2.7 ± 0.21 2.6 ± 0.18 M-wave latency (ms) 11.17 ± 0.56 10.89 ± 0.58*** 10.84 ± 0.58*** 10.83 ± 0.57*** H reflex (mV) 3.06 ± 0.37 3.16 ± 0.41 3.07 ± 0.4 3.13 ± 0.41 H/M 0.44 ± 0.06 0.43 ± 0.06 0.43 ± 0.06 0.45 ± 0.06
Values are means ±SEM; *P < 0.05, **P < 0.01, ***P < 0.001 significantly different from rest values; †† P < 0.01 and ††† P < 0.001 significantly different from post17 values.
Table 2. Contractile properties before, during and after the exercise protocol.
pre post17 post34 post51 F P
CT (ms) 118 ± 7.1 95 ± 4.3*** 95 ± 3.7*** 100 ± 4.2** 7.23 0.001 MRFD (Nm/ms) 0.34 ± 0.01 0.49 ± 0.02*** 0.47 ± 0.02*** 0.47 ± 0.02*** 43.53 0.001 HRT (ms) 96 ± 4.7 86 ± 4.6* 84 ± 4.53** 82 ± 4.55*** 5.06 0.01 MRFR (Nm/ms) 0.18 ± 0.009 0.22 ± 0.01*** 0.21 ± 0.01*** 0.22 ± 0.01*** 9.58 0.001
Values are means ±SEM; CT contraction time, MRFD maximum rate of force development, HRT half-relaxation time, MRFR maximum rate of force half-relaxation; * P < 0.05, ** P < 0.01, *** P < 0.001 significantly different from rest values.
7. FIGURE LEGENDS
Figure 1. Schematic representation of the experimental session. On the top of the figure the experimental set-up is presented. Panel A presents the neuromuscular tests performed before the ES protocol. Panel B shows the neuromuscular tests performed at post17, post34 and post51. Before A, an M-wave and H-reflex recruitment curve was obtained, whereas H-reflex intensity was readjusted after every 17 stimulation trains in order to obtain the maximal reflex amplitude.
Figure 2. Maximal voluntary contraction torque at pre, post17, post34 and post51, *** P < 0.001 significantly different from rest value; †† P < 0.01 and ††† P < 0.001 significantly different from post17 values.
Figure 3. Level of voluntary activation at pre, post17, post34 and post51, * P < 0.5 significantly different from rest value.
Figure 4. Twitch torque at pre, post17, post34 and post51, *** P < 0.001 significantly different from rest value.