HAL Id: hal-01964826
https://hal.archives-ouvertes.fr/hal-01964826
Submitted on 23 Dec 2018HAL is a multi-disciplinary open access archive for the deposit and dissemination of sci-entific research documents, whether they are pub-lished or not. The documents may come from teaching and research institutions in France or abroad, or from public or private research centers.
L’archive ouverte pluridisciplinaire HAL, est destinée au dépôt et à la diffusion de documents scientifiques de niveau recherche, publiés ou non, émanant des établissements d’enseignement et de recherche français ou étrangers, des laboratoires publics ou privés.
FPGA-based smart camera for accurate chlorophyll
estimations
Madain Perez-Patricio, Abiel Aguilar-González, Jorge Camas-Anzueto, Nestor
Morales Navarro, Rubén Grajales-Coutiño
To cite this version:
Madain Perez-Patricio, Abiel Aguilar-González, Jorge Camas-Anzueto, Nestor Morales Navarro, Rubén Grajales-Coutiño. FPGA-based smart camera for accurate chlorophyll estimations. Inter-national Journal of Circuit Theory and Applications, Wiley, 2018, �10.1002/cta.2489�. �hal-01964826�
See discussions, stats, and author profiles for this publication at: https://www.researchgate.net/publication/324943665
FPGA-based smart camera for accurate chlorophyll estimations
Article in International Journal of Circuit Theory and Applications · May 2018 DOI: 10.1002/cta.2489 CITATION 1 READS 72 5 authors, including:
Some of the authors of this publication are also working on these related projects:
mechatronics devices for aerial images acquisitionView project
Processing natural languageView project Madain Perez-Patricio
Instituto Tecnológico de Tuxtla Gutiérrez
24PUBLICATIONS 65CITATIONS
SEE PROFILE
Abiel Aguilar-González
Instituto Nacional de Astrofísica, Óptica y Electrónica (INAOE)
20PUBLICATIONS 37CITATIONS
SEE PROFILE
Jorge luisc camas anzueto
Instituto Tecnológico de Tuxtla Gutiérrez
53PUBLICATIONS 177CITATIONS
SEE PROFILE
All content following this page was uploaded by Abiel Aguilar-González on 04 May 2018. The user has requested enhancement of the downloaded file.
DOI: xxx/xxxx
SPECIAL ISSUE ON COMPUTATIONAL IMAGE SENSORS AND SMART CAMERA HARDWARE
FPGA-based smart camera for accurate chlorophyll estimations
Madaín Pérez-Patricio*
1| Abiel Aguilar-González
2,3| J. L. Camas-Anzueto
1| N.
Morales-Navarro
1| R. Grajales-Coutiño
11Mechatronics Engineering Department,
Instituto Tecnológico de Tuxtla Gutiérrez (ITTG), Chiapas, Mexico
2Computer Science Department, Instituto
Nacional de Astrofísica, Óptica y Electrónica (INAOE), Puebla, Mexico
3Institut Pascal, Université Clermont
Auvergne (UCA), Auvergne, France
Correspondence
*Madaín Pérez-Patricio, Carretera Panamericana Km. 1080, C.P. 29050, Apartado Postal: 599. Email: [email protected]
Summary
In this work, a new chlorophyll estimation approach based on the reflectance/trans-mittance from the leaf being analyzed is proposed. First, top/underside images from the leaf under analysis are captured, then, the base parameters (reflectance/trans-mittance) are extracted. Finally, a double-variable linear regression model estimates the chlorophyll content. In order to estimate the base parameters, a novel opti-cal arrangement is presented. On the other hand, in order to provide a portable device, suitable for chlorophyll estimation under large scale food crops, we have implemented our optical arrangement and our algorithmic formulation inside an FPGA-based smart camera fabric. Experimental results demonstrated that the pro-posed approach outperforms (in terms of accuracy and processing speed) most previous vision-based approaches, reaching more than 97% accuracy and delivering fast chlorophyll estimations (near 5ms per estimation).
KEYWORDS:
Chlorophyll estimation, smart camera, FPGA
1
INTRODUCTION
Smart cameras are image/video acquisition devices with self-contained image processing algorithms that simplify the formula-tion of a particular applicaformula-tion1,2. For example, algorithms for smart video surveillance could detect and track pedestrians3, but
for a robotic application, algorithms could be feature detection or feature tracking4,5. In this work, the aim is for a fast/accurate
solution for the chlorophyll estimation problem. This is motivated because previous work has limitations due to high processing time and cost or low accuracy. In general, laboratory tests deliver high accuracy (ground truth) but processing time and cost are high. In practice, others techniques, faster and cheaper than laboratory tests are used, unfortunately, in most cases these tech-niques have low accuracy or the system size makes it difficult to implement under large scale food crops. In our case, we believe that a smart camera that addresses the chlorophyll estimation problem could be a useful contribution for the current state of the art since fast estimations with compact system design could be obtained.
1.1
Chlorophyll estimation under food crops
Given the current population growth rate, food crops demand has been highly increased. So, in order to obtain more efficient crops, most of the current food producers supervise their crops health since it is well known that stress conditions affect photo-synthetic activity. In recent years, one popular approach consists in estimate the chlorophyll content in the plants leaves within a crop6,7,8,9,10,11,12,8. This is because there is a high correlation between the chlorophyll content and the plants health13 then,
Pérez-Patricio
in current literature, several approaches for chlorophyll estimation can be found14,15. In most cases, devices such as the Soil
Plant Analysis Development (SPAD) are used for the chlorophyll estimation16,17. In general, the SPAD device measures the leaf absorbance at several wavelengths. Then, based on the absorbance, a SPAD numerical value, proportional with the chloro-phyll content, is computed. In theory the SPAD device delivers fast estimations with high accuracy. Unfortunately, in practice it only estimates the absorbance at one point of the leaf under analysis. i.e., it estimates the chlorophyll content within a small spatial location of the leaf. To solve this problem, it is necessary to make iterative measurements at different spatial locations. Finally, the average value corresponds with the chlorophyll content, in addition, the high cost of the SPAD technology makes it difficult to implement under large scale food crops. Other trend, that aims for low cost and fast chlorophyll estimations, are vision-based approaches12,8. In this context, image processing algorithms are applied with the assumption that chlorophyll
con-tent defines the leaf color. i.e., low chlorophyll concon-tents generate yellowish-green colors while high chlorophyll concon-tent involves dark green colors. In previous works, several vision based approaches have been proposed and several image processing algo-rithms have been developed6,7,8,9,10,11, unfortunately, it was demonstrated that they achieve relatively low accuracy (compared with the SPAD device).
1.2
Motivation and scope
In this work, the aim is for a fast/accurate solution for the chlorophyll estimation problem, in addition, we are interested in a com-pact system design since this could be useful under large food crops in which portable devices are desirables. The contribution of this work is twofold, first, this work proposes a novel mathematical formulation that uses the reflectance/transmittance within the visible electromagnetic spectrum range as base parameters for the chlorophyll estimation. Second, an FPGA-based smart camera capable to capture the base parameters (reflectance/transmittance) and where the chlorophyll estimation is carried out in a parallel architecture is presented. The rest of this manuscript is organized as follows: Section 2 presents the related work. In
Section 3, details about the proposed approach, details about the FPGA architecture and our smart camera implementation are
shown. Experimental results and comparison with previous works are detailed in section 4. Finally, Section 5 concludes this manuscript.
2
RELATED WORK
Approaches such as12,8capture images with airborne cameras. These techniques have the advantage of monitoring large land
areas. Unfortunately, their cost is high (higher than the SPAD-based approach) and there is no control for ambient lighting changes that decreases the accuracy. There are other approaches that capture images at different wavelengths. In particular, multispectral and hyperspectral images with 300 - 1200 nm have been used6,7,8,9,10,11. Other authors18,19,20,21have used images with visible spectrum (300-700 nm) information in order to determine a correlation value between chlorophyll/nitrogen content. In general, multispectral/hyperspectral based approaches reach relatively high accuracy and real time processing. Unfortunately, their cost and size are high (similar size than the SPAD device and similar cost but with lower accuracy). Other approach, that could be more efficient in terms of system design and cost, could be the use of a single RGB (Red-Green-Blue color space) camera. In previous work there exist some research for nitrogen and calcium estimations. In22, RGB images from four plants
groups, each group with a different nitrogen level (0%, 50%, 100%, and 150% of the required daily dose) were captured at 5 different growth states (10, 20, 30, 40, and 50 days). Plant leaves were placed on a white surface. Then, an RGB-based classifier estimates the nitrogen content as deficient or in excess. In23 two color space are used in order to detect calcium deficiency in lettuce plants. Values as color, entropy, energy, contrast, and homogeneity were used as health indicators. Then, calcium deficiency is computed via statistical computations. In both cases22and23the use of a single RGB camera allowed for a compact system design and low cost but accuracy is low.
3
MATERIALS AND METHODS
In this section details about the proposed approach are presented. It consists of a novel optical arrangement that captures the proposed base parameters (reflectance/transmittance). Then, an image processing algorithm extracts the base parameters. Finally, a double-variable linear regression model estimates the chlorophyll content.
3.1
Dataset
In this work, more than 400 plants with different health states were tested. For that, several hydroponic crops (Lactuca sativa) were cultivated. In these crops, different nutritional solutions were applied in order to obtain different health levels for the plants within the crop. So, 27 nutritional solutions with different macronutrients concentrations were prepared. Each nutritional solution, corresponds to 0%, 50% or 100% of the daily nutritional requirements. Each nutritional solution was applied for three different plants within the crop and this process was replicated for 6 different crops. Finally, one SPAD device was used to measure the SPAD values that corresponds with the chlorophyll content, all measures were realized after 15 grown days, where the plants have reach maturity and there are not symptoms of damages due to the age. Using this chlorophyll values we could estimate our crop health, however, to determine crop health is a complex task since it depends on several factors: the crop type, plantation procedures, weather are important issues. Even the geographical location or any type of external agent such as dust or snow can affect the health. For example, given a particular crop, chlorophyll values equal to 41 could represent a high health level in some world regions but in other regions a good chlorophyll values could be 37. In practice, the food producers determine their crops health given their particular conditions. For this reason, in this work we will only focus on the chlorophyll estimation, that is the basis of the crop health estimations.
3.2
The base parameters
Previous work demonstrated that there are two crucial issues in the chlorophyll estimation procedures. The first one is for the acquisition technique using to capture the base parameters. In general, all acquisition techniques are sensitive to noise and this decreases the accuracy. The second issue is for the base parameters using for the chlorophyll estimation. Robust base parameters should deliver accurate results. Nevertheless, previous vision-based approaches demonstrated that it is difficult to obtain base parameters with high discriminant and repeatability1 24. For the acquisition technique, previous vision-based approaches have
used natural illumination and this has delivered poor performance in terms of accuracy. In this work we believe that one alterna-tive to this problem could be using light sources with known frequency. Then, more controlled environment, could deliver more accurate measurements. For the base parameters, previous work demonstrated that chlorophyll content is close related with the color components in the leaf being analyzed25,26. In this work, we propose the color reflectance/transmittance in the leaf being
analyzed as base parameters since we believe that these parameters deliver high discriminant and robustness, higher than the base parameters used in previous works.
3.3
The proposed smart camera
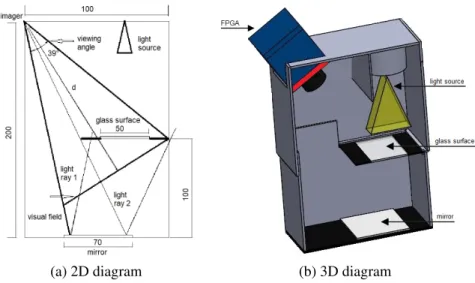
In order to capture the base parameters, a novel optical arrangement inside our smart camera fabric is proposed, see Fig. 1 . In general, one CCD imager connected in a TRDB DC2 development board is used to provide a 1280×1024 Bayer pattern image where the images are acquired in RGB format. The imager provides raw format with 10 bits per pixel. The external specifications are: 5.8 × 4.92 mm, and the lens used has 8 mm focal length. The imager was placed at 39◦opposed to horizontal inclination
(in order to observe simultaneously the upper/lower part of the leaf), and 100 mm of vertical distance. The viewing angle is computed using Eq. 1; where 𝛼 is the vertical or horizontal viewing angle, 𝑠 the vertical or horizontal dimension and 𝑓 the focal distance. Considering the visual field perpendicular to the viewing angle bisector, then, it has to full encompass the glass and the mirror. So, the bisector 𝑑 (Fig. 1 a) represents the necessary distance between the vision field and the imager, and it is computed by Eq. 2; where 𝑑 is the bisector and 𝑙 the visual field longitude. Finally, the imager is focused on the optical arrangement visual field line and the diaphragm opening is adjusted to 𝑓 = 𝑓 ∕8. For the light source, one MCWHD2 LED (800 mW) is used. In addition, the optical arrangement uses a 50 × 70 millimeter glass that support the leaf being analyzed and, at the bottom, a 70 mm square mirror which reflects the leaf transmittance information. Pieces of black matte plastic control the light flow within the device and reduce the entry of outside light.
𝛼= 2𝑡𝑎𝑛−1 𝑠
2𝑓 (1)
1Discriminant: for different chlorophyll values, different base parameters responses have to be obtained. In practice, low discriminant values decrease the performance since several chlorophyll values (within a small range) could have similar base parameters response. Repeatability: for similar chlorophyll values, similar base parameters responses have to be obtained. In some cases, this affirmation is not true and different leafs (with similar chlorophyll content) deliver different base parameters responses.
Pérez-Patricio 𝑑= 𝑙 2𝑡𝑎𝑛𝛼 2 (2)
3.4
Image processing
In Fig. 2 a), one example of the images captured by our optical arrangement is shown. Then, given the upper part of Fig. 2 a) contain the reflectance information (𝐼1(𝑥, 𝑦)) and the lower part contain the transmittance (𝐼2(𝑥, 𝑦)), the proposed algorithm computes the reflectance (𝑅𝑟) and transmittance (𝑇𝑟) as shown in Eq. 3-4; where 𝐼1(𝑥, 𝑦, 𝑟, 𝑐) are the red channel pixel values
for c different samples taken from (𝐼1(𝑥, 𝑦)) and 𝐼2(𝑥, 𝑦, 𝑟, 𝑐) are the red channel pixel values for c different samples from (𝐼2(𝑥, 𝑦)), see Fig. 2 b), in this example 8 different samples were extracted. Finally, Eq. 5 estimates the chlorophyll content, it
was obtained using linear regression, more details can be found in the following section.
𝑅𝑟= ∑𝑐 1𝐼1(𝑥, 𝑦, 𝑟, 𝑐) 𝑐 (3) 𝑇𝑟= ∑𝑐 1𝐼2(𝑥, 𝑦, 𝑟, 𝑐) 𝑐 , (4) 𝐹(𝑅𝑟, 𝑇𝑟) = 42.44 + 0.4043𝑅𝑟− 0.7541𝑇𝑟 (5)
3.5
The base parameters performance
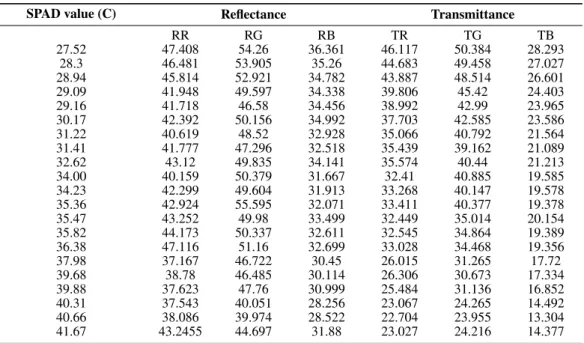
Table 1 presents average values for transmittance/reflectance and their respective chlorophyll content in SPAD values, where
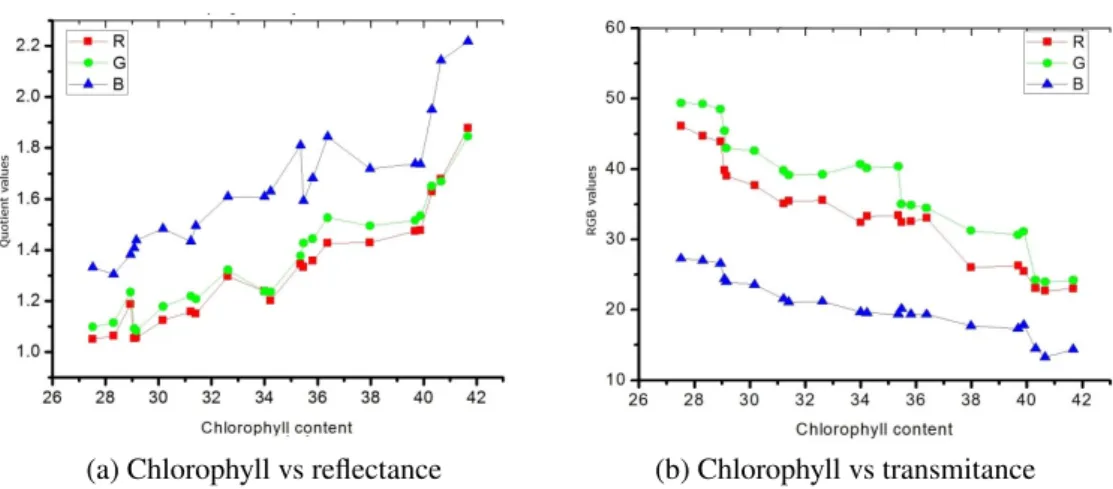
𝑅{𝑅, 𝐺, 𝐵}, 𝑇 {𝑅, 𝐺, 𝐵} are the values for reflectance/transmittance for each RGB channel. In Fig. 3 the reflectance/transmit-tance values, in relation with the SPAD values are shown. From Fig. 3 a), in all channels reflecreflectance/transmit-tance increases as the amount of chlorophyll increases. This is because high chlorophyll content absorbs high light energy. On the other hand, Fig. 3 b) shows that higher chlorophyll content reduces the transmittance value for all the channels. This is because high chlorophyll content reduces the light that passes through the leaf.
3.6
The linear regression model
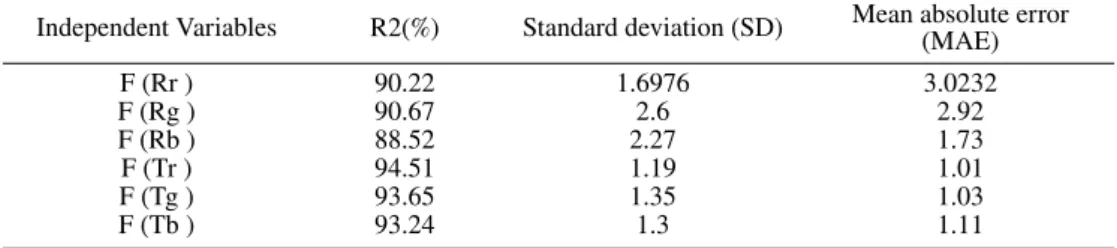
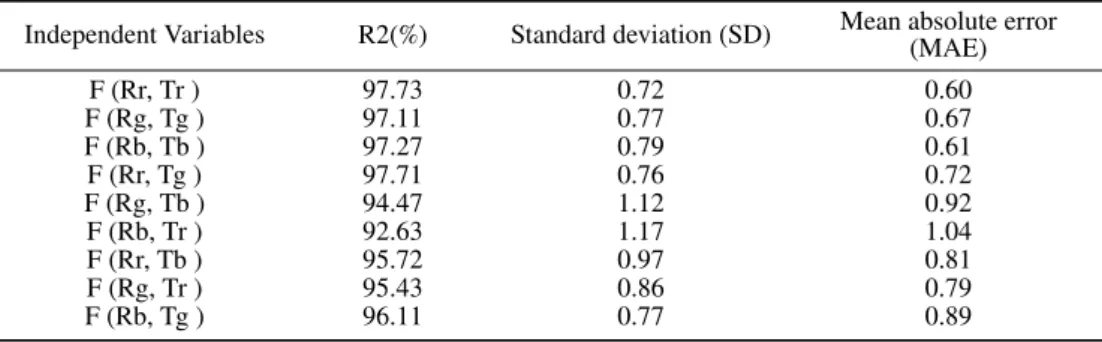
In order to build a chlorophyll estimation framework, any statistical regression model have to fulfil with the linear dependence between chlorophyll values and the base parameters. In our case, linear regression is used due to its mathematical simplicity that involves high processing speed with low computational requirements. It was tested with different combinations of the base parameters proposed in this work. It was demonstrated that all the proposed parameters deliver high accuracy and in particular, the combination of both, provide accuracy superior to most previous vision-based approaches (similar than SPAD measurements). In Table 2 , results of applying single-variable linear regression models for each values presented in Table 1 are shown. The maximum 𝑅2 = 94.51 is for the red channel transmittance 𝐹 (𝑇 𝑟), the smallest standard deviation 𝑆𝐷 = 1.19 and the best mean absolute error 𝑀 𝐴𝐸 = 1.01 is also for 𝐹 (𝑇 𝑟). Thus, it is demonstrated that the best variable to estimate the chlorophyll content is the transmittance in red channel. In Table 3 , results of applying double-variable linear regression models for each values presented in Table 1 are shown. The best 𝑅2 = 97.73.59 is for the combination of reflectance and transmittance in the red channel 𝐹 (𝑅𝑟, 𝑇𝑟), in addition, this combination has the best standard deviation 𝑆𝐷 = 0.72. and the best mean absolute error 𝑀 𝐸𝐴 = 0.60. So, it is demonstrated that the combination of reflectance and transmittance in the red channel 𝐹 (𝑅𝑟, 𝑇𝑟) deliver the best performance for chlorophyll estimation.
3.7
The FPGA architecture
In Fig. 4 , the developed FPGA architecture is shown. In general, the CCD sensor deliver raw images with 10 bpp as stream, P[29:0]. Key[3:0] is used for the camera control. Then, the FPGA architecture extracts 𝑐 samples from the input image, see Eq. 3-4. Finally, the chlorophyll content is computed according Eq. 5 where the⋅ operation is implemented using a look-up table
(LUT), 𝑅𝑟 and 𝑇𝑟 are the index values and, the output value which represents the chlorophyll content is selected using also a LUT.
3.7.1
The image acquisition module
One CCD imager connected in a TRDB DC2 developement board is used as keystone of the image acquisition module. It provides 1280×1024 RGB images with 10 bits per pixel. In order to reduce hardware requirements, only the most significant 8 bits of the data provided by the TRDB DC2 board are used.
3.7.2
The sampling module
In Fig. 5 the FPGA architecture of the sampling module is shown. The P[23:0], Hcont[10:0] and Vcont[11:0] are the data input for the sampling module ( the 𝑥, 𝑦 spatial location form the image pixels ). Both: (Hcont[10:0] and Vcont[10:0]) are compared with defined values that corresponds with the spatial coordinates of the sample pixels that corresponds with the transmittance/reflectance areas. Then, each retained value are saved into logical registers.
3.8
The chlorophyll estimation module
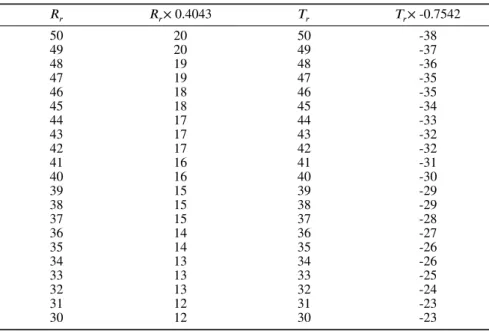
Fig. 6 shows the chlorophyll estimation module. This module applies Eq. 5. The mean for the sample values are computed add
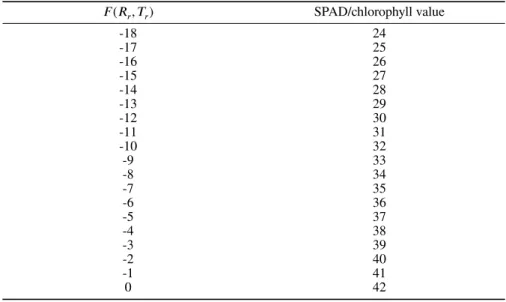
all the values and taking the eight most significant values. In Tables 4 and 5 the LUTs used in this step are shown.
4
RESULTS
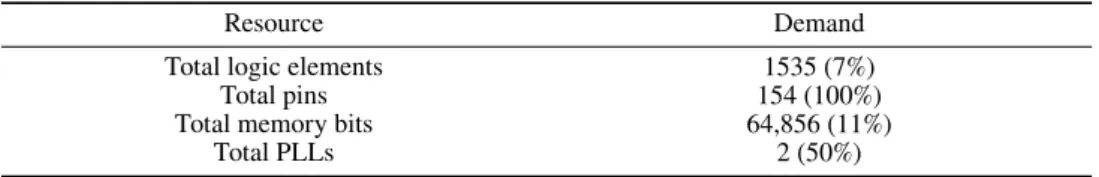
The developed FPGA architecture was implemented in an FPGA Cyclone II EP2C35F672C6 of Altera. All modules were designed via Quartus II Web Edition version 10.1SP1. All modules were validated via post-synthesis simulations performed in ModelSim Altera and, in Table 6 the hardware resource consumption for the developed FPGA architecture is shown. It is demonstrated that the regression model 𝐹 (𝑅𝑟, 𝑇𝑟) delivers a robust framework for chlorophyll estimation. 𝑅2 = 97.73, mean absolute error 𝑀 𝐴𝐸 = 0.60 and standard deviation 𝑆𝐷 = 0.72 are reached, see Table 3 .
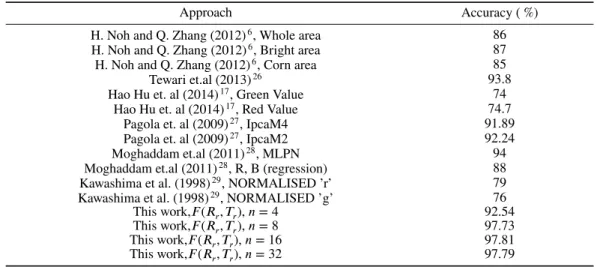
In Table 7 , accuracy comparisons with respect to previous vision-based approaches are shown. In our case, we compared the proposed algorithm given different sampling values. It was demonstrated that sample values between 8-32 to deliver high accuracy and robustness for the chlorophyll estimation process. On the other hand, the proposed approach outperform all previous vision based approaches. This is because previous formulations use base parameters that have low stability under illumination changes. For this work, due to the wide availability of RGB cameras with low cost, the proposed solution could be a promising chlorophyll estimation framework, similar accuracy and size than SPAD but lower cost and lower processing time (near 5 ms per estimation). For processing speed, in all cases, the proposed algorithm reaches real-time processing (faster than SPAD measurements and previous vision-based approaches). For the system size in all cases, our smart camera, see Fig. 7 uses a small FPGA device as processor, in addition all the optical/image acquisition components are inside the camera fabric.
5
CONCLUSIONS
In this work, a novel chlorophyll estimation approach was proposed. First, we have proposed a new mathematical formulation that uses color reflectance/transmittance from the leaf being analyzed as base parameters for chlorophyll estimation. Second, we have developed a new FPGA-based smart camera, capable to capture the base parameters and where all the algorithmic part is processed in a parallel architecture. It was demonstrated that reflectance/transmittance deliver robust/discriminant values for chlorophyll estimations. Experimental results demonstrated that a double-variable linear regression learning algorithm achieves 97% accuracy under a Lactuca sativa hydroponic crop. In addition, the proposed approach delivers fast measurements with low cost and allow compact system design (similar than the SPAD device). In this work, the proposed algorithm was applied on a Lactuca sativa crop. In order to determine if other crop types present similar patterns, the mathematical model could be expanded to several different food crops. In any case, the smart camera layout and the formulation of the learning algorithm have to be the same. Only color comparison of the crop being analyzed and some minor adjustments in the multiple regression model would be needed.
Pérez-Patricio
References
1. Carey Stephen J, Barr David RW, Dudek Piotr. Low power high-performance smart camera system based on SCAMP vision sensor. Journal of Systems Architecture. 2013;59(10):889–899.
2. Bourrasset Cédric, Maggianiy Luca, Sérot Jocelyn, Berry François, Pagano Paolo. Distributed FPGA-based smart camera architecture for computer vision applications. In: :1–2IEEE; 2013.
3. Hengstler Stephan, Prashanth Daniel, Fong Sufen, Aghajan Hamid. MeshEye: a hybrid-resolution smart camera mote for applications in distributed intelligent surveillance. In: :360–369ACM; 2007.
4. Aguilar-González Abiel, Arias-Estrada Miguel, Berry François. Dense Feature Matching Core for FPGA-based Smart Cameras. In: :41–48; 2017.
5. Aguilar-González Abiel, Arias-Estrada Miguel, Berry François. Robust feature extraction algorithm suitable for real-time embedded applications. Journal of Real-Time Image Processing. 2017;:1–19.
6. Noh H, Zhang Q. Shadow effect on multi-spectral image for detection of nitrogen deficiency in corn. Computers and
electronics in agriculture.2012;83:52–57.
7. Zhang Xiaolei, Liu Fei, He Yong, Gong Xiangyang. Detecting macronutrients content and distribution in oilseed rape leaves based on hyperspectral imaging. Biosystems engineering. 2013;115(1):56–65.
8. Delegido Jesús, Van Wittenberghe Shari, Verrelst Jochem, et al. Chlorophyll content mapping of urban vegetation in the city of Valencia based on the hyperspectral NAOC index. Ecological Indicators. 2014;40:34–42.
9. Huang Min, Wan Xiangmei, Zhang Min, Zhu Qibing. Detection of insect-damaged vegetable soybeans using hyperspectral transmittance image. Journal of Food Engineering. 2013;116(1):45–49.
10. Diezma Belén, Lleó Lourdes, Roger Jean Michel, Herrero-Langreo Ana, Lunadei Loredana, Ruiz-Altisent Margarita. Exam-ination of the quality of spinach leaves using hyperspectral imaging. Postharvest Biology and Technology. 2013;85:8–17. 11. Navarro-Cerrillo Rafael Ma, Trujillo Jesus, Orden Manuel Sánchez, Hernández-Clemente Rocío. Hyperspectral and
mul-tispectral satellite sensors for mapping chlorophyll content in a Mediterranean Pinus sylvestris L. plantation. International
Journal of Applied Earth Observation and Geoinformation.2014;26:88–96.
12. Saberioon MM, Amin MSM, Anuar AR, Gholizadeh A, Wayayok A, Khairunniza-Bejo Siti. Assessment of rice leaf chloro-phyll content using visible bands at different growth stages at both the leaf and canopy scale. International Journal of
Applied Earth Observation and Geoinformation.2014;32:35–45.
13. Officer Protection. Food and agriculture organization of the United Nations. 2016;.
14. Wan Wenbo, Hua Dengxin, Le Jing, He Tingyao, Yan Zhe, Zhou Chunyan. Study of laser-induced chlorophyll fluorescence lifetime measurement and its correction. Measurement. 2015;60:64–70.
15. Fernandez-Jaramillo Arturo Alfonso, Jesus Romero-Troncoso Rene, Duarte-Galvan Carlos, et al. FPGA-based chlorophyll fluorescence measurement system with arbitrary light stimulation waveform using direct digital synthesis. Measurement. 2015;75:12–22.
16. Muñoz-Huerta Rafael F, Guevara-Gonzalez Ramon G, Contreras-Medina Luis M, Torres-Pacheco Irineo, Prado-Olivarez Juan, Ocampo-Velazquez Rosalia V. A review of methods for sensing the nitrogen status in plants: advantages, disadvantages and recent advances. Sensors. 2013;13(8):10823–10843.
17. Hu Hao, Zhang Guangzhi, Zheng Kefeng. Modeling leaf image, Chlorophyll fluorescence, reflectance from SPAD readings.
IEEE Journal of Selected Topics in Applied Earth Observations and Remote Sensing.2014;7(11):4368–4373.
18. Fernández-Pacheco Daniel G, Escarabajal-Henarejos David, Ruiz-Canales Antonio, Conesa Julián, Molina-Martínez Jose M. A digital image-processing-based method for determining the crop coefficient of lettuce crops in the southeast of Spain. Biosystems engineering. 2014;117:23–34.
19. Wiwart Marian, Fordoński Gabriel, Żuk-Gołaszewska Krystyna, Suchowilska Elżbieta. Early diagnostics of macronutrient deficiencies in three legume species by color image analysis. Computers and electronics in agriculture. 2009;65(1):125–132. 20. Juan Wang, Changzhou Wei, Jinqiang Guo, Yongwen Lei. A method based on digital image analysis for estimating crop
canopy parameters. In: :7–10IEEE; 2011.
21. Wang Yuan, Wang Dejian, Zhang Gang, Wang Jun. Estimating nitrogen status of rice using the image segmentation of GR thresholding method. Field Crops Research. 2013;149:33–39.
22. Ma Lili, Fang Junlong, Chen Yuehua, Gong Shuipeng. Color Analysis of leaf images of deficiencies and excess nitrogen content in soybean leaves. In: :1–3IEEE; 2010.
23. Story David, Kacira Murat, Kubota Chieri, Akoglu Ali, An Lingling. Lettuce calcium deficiency detection with machine vision computed plant features in controlled environments. Computers and Electronics in Agriculture. 2010;74(2):238–243. 24. Dey Amar Kumar, Sharma Manisha, Meshram MR. An Analysis of Leaf Chlorophyll Measurement Method Using
Chlorophyll Meter and Image Processing Technique. Procedia Computer Science. 2016;85:286–292.
25. Hu Hao, Zhang Jizong, Sun Xiangyang, Zhang Xiaoming. Estimation of leaf chlorophyll content of rice using image color analysis. Canadian Journal of Remote Sensing. 2013;39(2):185–190.
26. Tewari VK, Arudra Ashok Kumar, Kumar Satya Prakash, Pandey Vishal, Chandel Narendra Singh. Estimation of plant nitrogen content using digital image processing. Agricultural Engineering International: CIGR Journal. 2013;15(2):78–86. 27. Pagola Miguel, Ortiz Rubén, Irigoyen Ignacio, et al. New method to assess barley nitrogen nutrition status based on image
colour analysis: comparison with SPAD-502. Computers and electronics in agriculture. 2009;65(2):213–218.
28. Moghaddam Parviz Ahmadi, Derafshi Mohammadali Haddad, Shirzad Vine. Estimation of single leaf chlorophyll content in sugar beet using machine vision. Turkish Journal of Agriculture and Forestry. 2011;35(6):563–568.
29. Kawashima Shigeto, Nakatani Makoto. An algorithm for estimating chlorophyll content in leaves using a video camera.
Pérez-Patricio
TABLE 1 Reflectance and transmittance values
SPAD value (C) Reflectance Transmittance
RR RG RB TR TG TB 27.52 47.408 54.26 36.361 46.117 50.384 28.293 28.3 46.481 53.905 35.26 44.683 49.458 27.027 28.94 45.814 52.921 34.782 43.887 48.514 26.601 29.09 41.948 49.597 34.338 39.806 45.42 24.403 29.16 41.718 46.58 34.456 38.992 42.99 23.965 30.17 42.392 50.156 34.992 37.703 42.585 23.586 31.22 40.619 48.52 32.928 35.066 40.792 21.564 31.41 41.777 47.296 32.518 35.439 39.162 21.089 32.62 43.12 49.835 34.141 35.574 40.44 21.213 34.00 40.159 50.379 31.667 32.41 40.885 19.585 34.23 42.299 49.604 31.913 33.268 40.147 19.578 35.36 42.924 55.595 32.071 33.411 40.377 19.378 35.47 43.252 49.98 33.499 32.449 35.014 20.154 35.82 44.173 50.337 32.611 32.545 34.864 19.389 36.38 47.116 51.16 32.699 33.028 34.468 19.356 37.98 37.167 46.722 30.45 26.015 31.265 17.72 39.68 38.78 46.485 30.114 26.306 30.673 17.334 39.88 37.623 47.76 30.999 25.484 31.136 16.852 40.31 37.543 40.051 28.256 23.067 24.265 14.492 40.66 38.086 39.974 28.522 22.704 23.955 13.304 41.67 43.2455 44.697 31.88 23.027 24.216 14.377
TABLE 2 Regression Models (single-variable)
Independent Variables R2(%) Standard deviation (SD) Mean absolute error
(MAE) F (Rr ) 90.22 1.6976 3.0232 F (Rg ) 90.67 2.6 2.92 F (Rb ) 88.52 2.27 1.73 F (Tr ) 94.51 1.19 1.01 F (Tg ) 93.65 1.35 1.03 F (Tb ) 93.24 1.3 1.11
Pérez-Patricio
TABLE 3 Regression Models (double-variable)
Independent Variables R2(%) Standard deviation (SD) Mean absolute error
(MAE) F (Rr, Tr ) 97.73 0.72 0.60 F (Rg, Tg ) 97.11 0.77 0.67 F (Rb, Tb ) 97.27 0.79 0.61 F (Rr, Tg ) 97.71 0.76 0.72 F (Rg, Tb ) 94.47 1.12 0.92 F (Rb, Tr ) 92.63 1.17 1.04 F (Rr, Tb ) 95.72 0.97 0.81 F (Rg, Tr ) 95.43 0.86 0.79 F (Rb, Tg ) 96.11 0.77 0.89
TABLE 4 Look up table for the linear regresion 𝑅𝑟 𝑅𝑟× 0.4043 𝑇𝑟 𝑇𝑟× -0.7542 50 20 50 -38 49 20 49 -37 48 19 48 -36 47 19 47 -35 46 18 46 -35 45 18 45 -34 44 17 44 -33 43 17 43 -32 42 17 42 -32 41 16 41 -31 40 16 40 -30 39 15 39 -29 38 15 38 -29 37 15 37 -28 36 14 36 -27 35 14 35 -26 34 13 34 -26 33 13 33 -25 32 13 32 -24 31 12 31 -23 30 12 30 -23
Pérez-Patricio
TABLE 5 Look up table for the chlorophyll estimation
𝐹(𝑅𝑟, 𝑇𝑟) SPAD/chlorophyll value -18 24 -17 25 -16 26 -15 27 -14 28 -13 29 -12 30 -11 31 -10 32 -9 33 -8 34 -7 35 -6 36 -5 37 -4 38 -3 39 -2 40 -1 41 0 42
TABLE 6 Hardware resource consumption for the developed FPGA architecture
Resource Demand
Total logic elements 1535 (7%)
Total pins 154 (100%)
Total memory bits 64,856 (11%)
Pérez-Patricio
TABLE 7 Vision based approaches for chlorophyll estimation: accuracy
Approach Accuracy ( %)
H. Noh and Q. Zhang (2012)6, Whole area 86
H. Noh and Q. Zhang (2012)6, Bright area 87
H. Noh and Q. Zhang (2012)6, Corn area 85
Tewari et.al (2013)26 93.8
Hao Hu et. al (2014)17, Green Value 74
Hao Hu et. al (2014)17, Red Value 74.7
Pagola et. al (2009)27, IpcaM4 91.89
Pagola et. al (2009)27, IpcaM2 92.24
Moghaddam et.al (2011)28, MLPN 94
Moghaddam et.al (2011)28, R, B (regression) 88
Kawashima et al. (1998)29, NORMALISED ’r’ 79
Kawashima et al. (1998)29, NORMALISED ’g’ 76
This work,𝐹 (𝑅𝑟, 𝑇𝑟), 𝑛 = 4 92.54
This work,𝐹 (𝑅𝑟, 𝑇𝑟), 𝑛 = 8 97.73
This work,𝐹 (𝑅𝑟, 𝑇𝑟), 𝑛 = 16 97.81
(a) 2D diagram (b) 3D diagram
FIGURE 1 The proposed smart camera: the leaves were inserted in the smart camera and the optical arrangement extracts the
base parameters, then, the imager shots the leaves and finally, an FPGA architecture estimates the chlorophyll content.
(a) Input RGB image (b) Example for the sampling step
FIGURE 2 The image processing step. Given an RGB image from the leaf being analyzed, several pixel values which
Pérez-Patricio
(a) Chlorophyll vs reflectance (b) Chlorophyll vs transmitance
FIGURE 3 The base parameters performance. Experimental results demonstrate that the reflectance value increases as the
amount of chlorophyll increases. On the other hand, higher chlorophyll content reduces the transmittance value.
FIGURE 4 General diagram of the developed FPGA architecture. First, one CCD sensor deliver raw images with 10 bpp as
stream (P[29:0]. Key[3:0]) is used for the camera control. Then, the FPGA architecture extracts 𝑐 samples from the input image. Then, the chlorophyll content is computed using a look-up table. Finally, results are displayed to the user in a screen.
FIGURE 5 FPGA architecture for the sampling module. Given the x,y spatial location form the image pixels, then the x,y
values are compared with predefinded spatial values wich corresponds with the spatial coordinates of the sample pixels. These samples corresponds with the transmittance/reflectance areas and are saved into logical registers.
FIGURE 6 FPGA architecture for the chlorophyll estimation module. First, the mean for the sample values are computed adding
all the sample values and taking the eight most significant values. Then the chlorophyll content is estimated using a look-up table.
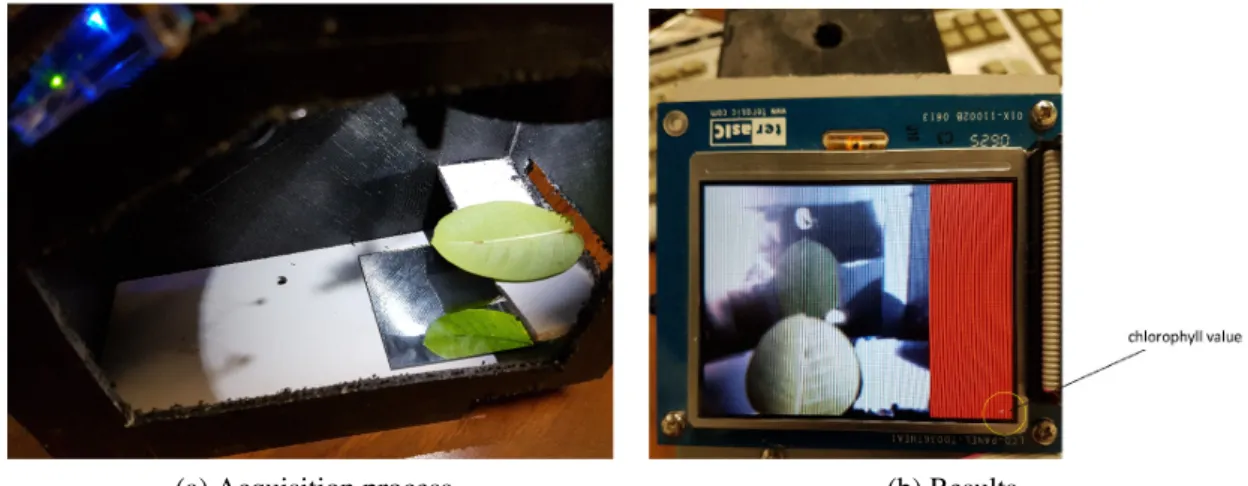
(a) Acquisition process (b) Results
FIGURE 7 The developed smart camera. One CCD imager connected in a TRDB DC2 development board is used to provide a
1280×1024 Bayer pattern image. The optical arrangement uses a 50 × 70 millimeter glass that support the leaf being analyzed and, at the bottom, a 70 mm square mirror which reflects the leaf transmittance information. Pieces of black matte plastic control the light flow within the device and reduce the entry of outside light.
View publication stats View publication stats