Spray drying LiFePO4 nanoparticle suspensions and scale-up
MARCO GIULIO RIGAMONTI Département de génie chimique
Thèse présentée en vue de l’obtention du diplôme de Philosophiæ Doctor Génie chimique
Mai 2019
c
Cette thèse intitulée :
Spray drying LiFePO4 nanoparticle suspensions and scale-up
présentée par Marco Giulio RIGAMONTI en vue de l’obtention du diplôme de Philosophiæ Doctor a été dûment acceptée par le jury d’examen constitué de :
Paul STUART, président
Gregory PATIENCE, membre et directeur de recherche David VIDAL, membre
DEDICATION
To my family, for always being there for me, no matter what.
Dedicato alla mia famiglia, mamma, papà, zii e nonni, per essere sempre presenti, vi voglio bene.
In loving memory of Dario Cardarelli; painter, architect, loving granpa. Shaping spaces towards functionality and beauty.
ACKNOWLEDGEMENTS
The author recognizes the support of Natural Science, Engineering Research Council of Canada and the Canadian Foundation for Innovation through the Automotive Partnership Canada program and our industrial partner Johnson-Matthey Battery Materials. The author appreciates the collaboration of Dr. Pierre Sauriol (Polytechnique Montreal) and Dr. Delin Li, Dr. Wojciech Kasprzak, (and colleagues) of CanmetMATERIALS for generating the pilot scale melt-synthesized LFP ingots used for this study.
The author would also like to thank Prof. Gregory Patience, for always striving me to improve and giving me the means of connecting with the world’s best research scientists. Prof. Daria Boffito, for collaborating with her research team and extend my knowledge to ultrasonication, heterogeneous catalysis and photocatalysis. Prof. Francesco Gatti, whom I can always rely upon. Stefano and Minerva Lucini, you are awsome! Dr. Davide Carnevali, Dr. Nooshin Saadatkhah, Dr. Marta Stucchi, Dr. Federico Galli, Dr. Hayat Khan, Dr. Jaber Darabi: wonderful people, excellent scientists, magnificent friends. Yu-Xiang Song, Simone Casagrande, Marc Chavalle: my exceptionally competent interns, it was a pleasure to work with you. To my friends and colleagues, whose future shine bright as their path. I always felt good among you, and I hope to continue this way.
Voor een awesome meisje. Ik zit nu enkele maanden achter op mijn werk, maar je bezorgde me de beste tijd van mijn leven.
The most disappointing concept I learned in chemical engineering was always assuming steady state... because life is not. Marco
RÉSUMÉ
Les voitures électriques ont le potentiel de définir le nouvel horizon du transport routier à venir, dont la seule contrainte est le système de stockage d’énergie. C/LiFePO4 (C/LFP)
est un matériau cathodique prometteur pour les batteries aux ions lithium: car il est peu coûteux, non-flammable, et stable. Dans le cadre du projet avec “Automotive Partnership Canada”, l’École Polytechnique et l’Université de Montréal ont mis au point un processus de synthèse par fusion pour réduire le prix de production de LiFePO4 (LFP), de 20 $/kg à moins
de 5 $/kg. Pour atteindre cet objectif, le processus implique la production de nanoparticules de LFP suspendues dans l’eau, (distribution granulométrique, PSD médian 200 nm) à partir du broyage d’un lingot obtenu par une synthèse en fusion. Une source de carbone est ajoutée lors du broyage (<10 %). Ensuite, l’eau est éliminée par séchage par pulvérisation (jusqu’à 99 %) et la poudre est chauffé dans un four (700◦C pendant 4 h) pour convertir la source de
carbone dans une couche de 1 nm à 3 nm de graphite électriquement conductrice, qui recouvre les nanoparticules d’LFP, qui ne conduisent pas d’électricité.
L’élimination des solvants à partir des suspensions solides de nanoparticules demande la même diligence que le séchage des ingrédients pharmaceutiques. Sécher et pyrolyser la sus-pension simultanément, à la fois donnera un morceau de céramique frittée. Si la sussus-pension de nanoparticules d’LFP sèche dans un four conventionnel, le matériel s’oxyde, s’agglomère et perd de porosité et de surface spécifique. Le séchage par pulvérisation préserve ces propriétés car les temps de contact sont de l’ordre de quelques secondes; de plus, les gouttelettes atom-isées sont petites (5 µm à 20 µm) et bien dispersées. Après, un four pyrolyse le précurseur de carbone, sans altérer la structure mésoporeuse interne ni les microparticules de poudre. Le matériel est ensuite imprégné d’électrolyte et appliqué en couche mince dans une batterie. Nous concevons les séchages par atomisation à l’échelle de laboratoire (0.12 m) et pilote avec une unité de diamètre 0.8 m permettant d’évaluer la faisabilité du processus. Nous séchons par atomisation l’LFP avec des précurseurs organiques (lactose et PVA) afin de recouvrir de manière homogène la structure mésoporeuse de la poudre et créer une cage de carbone qui entoure les nanoparticules. Les tests de capacité sur la batterie permettent de déterminer quelle source de carbone recouvre mieux le matériau après la pyrolyse et démontre que la cage en carbone prolonge la durée de vie de la batterie et sa vitesse de décharge.
ABSTRACT
As fossil fuels become less attractive for powering vehicles, electric cars have the potential to define the new skyline for future road transportation. C/LiFePO4 (C/LFP) is a promising
cathode material for such batteries: inexpensive, non-flammable and stable. As part of the “Automotive Partnership Canada” project, Polytechnique and Université de Montreal developed a melt-synthesis process for LiFePO4 (LFP), aiming to cut its price from 20 $/kg
to less than 5 $/kg. To reach this target the process involves grinding an ingot from a melt synthesis batch, to nanosized-particles by means of a wet media mill (particle size distribution, PSD median 200 nm). A carbon source is added during milling (<10 %). Then water is removed by spray drying (up to 99 %) and the powder is heated in a furnace (700◦C
for 4 h) to pyrolyze the carbon source into a 1 nm to 3 nm electrically conductive layer. Removing solvent from nanoparticle solid suspensions requires the same diligence as drying pharmaceutical ingredients. Simultaneously drying and pyrolyzing the suspension will pro-duce a sintered ceramic chunk. LFP nanoparticle suspensions in water oxidize, agglomerate and lose surface area when drying in a furnace. Spray drying preserves those properties because contact times are on the order of seconds; furthermore, the atomized droplets ensure particles are small (5 µm to 20 µm) and dispersed. A furnace pyrolyzes the carbon precur-sor, but does not sinter the internal mesoporous structure or sinter the micro-sized powder particles. The material is then impregnated with the electrolyte and applied as a 60 µm thin layer on a cathode sheet of the Li-ion battery. Scale-up from a 0.12 m to a 0.8 m diameter unit determines the process’ feasibility. We spray dry the LFP suspension with the organic precursors (lactose and PVA) to homogeneously coat the LFP mesoporous structure and create a carbon-cage that surrounds the nanoparticles. Battery capacity tests assess which organic source better coats the material after pyrolysis and demonstrate that the carbon-cage extends the battery’s life and discharge rate.
TABLE OF CONTENTS
DEDICATION . . . iii
ACKNOWLEDGEMENTS . . . iv
RÉSUMÉ . . . v
ABSTRACT . . . vi
TABLE OF CONTENTS . . . vii
LIST OF TABLES . . . xi
LIST OF FIGURES . . . xiii
LIST OF SYMBOLS AND ACRONYMS . . . xxii
LIST OF APPENDICES . . . xxiii
CHAPTER 1 INTRODUCTION . . . 1
1.1 Definitions and basic concepts . . . 3
1.2 Open problems . . . 5
1.3 General research objectives . . . 7
1.4 Specific objectives . . . 7
1.4.1 Identification of the optimal spray drying conditions . . . 8
1.4.2 Deriving an empirical model for bulk density . . . 8
1.4.3 Conceive scale-up criteria based on testing in the pilot and laboratory scale dryer, investigate interactions with carbon precursors and elec-trochemical battery tests . . . 8
CHAPTER 2 LITERATURE REVIEW . . . 10
2.1 Spray drying . . . 10 2.2 Scale-up . . . 13 2.3 Carbon coating . . . 15 2.4 Surfactant . . . 17 2.5 Nozzles . . . 17 2.5.1 Pressure jet . . . 17
2.5.2 Dual fluid . . . 18
2.5.3 Effervescent . . . 18
2.5.4 Ultrasound . . . 18
2.5.5 Rotary atomizers . . . 19
CHAPTER 3 METHODOLOGY . . . 20
3.1 Laboratory and pilot spray dryers . . . 20
3.2 Experimental - laboratory-scale . . . 22
3.2.1 Micronization . . . 22
3.2.2 Spray Drying . . . 22
3.3 Experimental - pilot-scale . . . 23
3.3.1 Nanoparticle suspension preparation . . . 23
3.3.2 Spray drying . . . 24
3.3.3 Calcination and electrochemical tests . . . 25
3.3.4 Reagents and Characterization . . . 25
CHAPTER 4 ARTICLE 1 - INFLUENCE OF ATOMIZATION CONDITIONS ON SPRAY DRYING LITHIUM IRON PHOSPHATE NANOPARTICLE SUSPENSIONS 28 4.1 Abstract . . . 28 4.2 Introduction . . . 28 4.3 Experimental . . . 30 4.3.1 Micronization . . . 30 4.3.2 Spray Drying . . . 31 4.3.3 Material Characterization . . . 32
4.4 Results and discussion . . . 34
4.4.1 Powder Formation . . . 35
4.4.2 Particle Size Distribution . . . 36
4.4.3 Residual Moisture (Drying Efficiency) . . . 37
4.4.4 Yield . . . 38
4.4.5 Powder Bulk Density and Flowability . . . 38
4.4.6 Mercury Porosimeter . . . 39
4.4.7 Nitrogen Physisorption . . . 40
4.4.8 X-ray Diffraction . . . 42
4.5 Conclusions . . . 43
4.6 Acknowledgments . . . 44 CHAPTER 5 ARTICLE 2 - LiFePO4 SPRAY DRYING SCALE-UP AND BINDERS
FOR IMPROVED CYCLABILITY . . . 45
5.1 Abstract . . . 45
5.2 Introduction . . . 46
5.3 Experimental section . . . 47
5.3.1 Nanoparticle suspension preparation . . . 47
5.3.2 Spray drying . . . 48
5.3.3 Calcination and electrochemical tests . . . 49
5.3.4 Reagents and Characterization . . . 49
5.4 Results and discussion . . . 51
5.4.1 LFP characterization and elemental analysis . . . 51
5.4.2 Particle size and powder morphology . . . 54
5.4.3 Pyrolysis and carbon layer . . . 55
5.4.4 N2 physisorption porosimetry . . . 57
5.4.5 Rheology of the nanoparticles suspension . . . 59
5.4.6 Ultrasonication . . . 64
5.4.7 Carbon coat chemical analysis . . . 65
5.4.8 Electrochemical tests . . . 67
5.5 Conclusions . . . 71
CHAPTER 6 GENERAL DISCUSSION . . . 73
6.1 Powder formation: atomization and drying . . . 74
6.2 Suspension density, Nozzle’ spray cone angle and infra-red investigation of the nozzle temperature . . . 78
6.2.1 Materials and methods . . . 78
6.2.2 Slurry density . . . 78
6.2.3 IR and nozzle temperature . . . 79
6.2.4 Spray cone angle . . . 83
6.3 Experimental design and results on the pilot spray dryer . . . 85
6.4 Article highlights and scientific contribution as author . . . 91
6.4.1 INFLUENCE OF ATOMIZATION CONDITIONS ON SPRAY DRY-ING LITHIUM IRON PHOSPHATE NANOPARTICLE SUSPENSIONS 91 6.4.2 LiFePO4 SPRAY DRYING SCALE-UP AND BINDERS FOR IM-PROVED CYCLABILITY . . . 91
6.4.3 EXPERIMENTAL METHODS IN CHEMICAL ENGINEERING: NU-CLEAR MAGNETIC RESONANCE . . . 93
6.5.1 Spray dried SiO2 WO3/TiO2 and SiO2 vanadium pyrophosphate
core-shell catalysts . . . 94
6.5.2 Spray dried TiO2/WO3 heterostructure for photocatalytic applications with residual activity in the dark . . . 95
6.5.3 Water treatment: Mn-TiO2 synthesized by ultrasound with increased aromatics adsorption . . . 98
6.5.4 Ultrasound assisted wet stirred media mill of high concentration LiFePO4 and catalysts . . . 101
6.5.5 Gas-phase fructose conversion to furfural in a microfluidized bed reactor102 6.5.6 Platinum doped WO3/TiO2 catalyst. . . 106
6.5.7 Levulinic acid upgrade to succinic acid with hydrogen peroxide . . . . 114
6.5.8 Enhanced photocatalytic activity of Pt-TiO2/WO3 hybrid material with energy storage ability . . . 116
6.5.9 Ultrasonic intensification to produce diester biolubricants . . . 121
6.5.10 Influence of frequency and amplitude on the mucus viscoelasticity of the novel mechano-acoustic frequencerT M . . . 124
6.5.11 LiFePO4 synthesis via ultrasound assisted mechanochemistry . . . 127
CHAPTER 7 CONCLUSION . . . 131 7.1 Summary of work . . . 131 7.2 Limitations . . . 132 7.3 Future Research . . . 133 REFERENCES . . . 134 APPENDICES . . . 158
LIST OF TABLES
Table 3.1 Two-fluid, external mixing, air blast atomizer, with bores in µm and a non-protruding tip. . . 20 Table 4.1 Two-fluid, external mixing, air blast atomizers; bores in µm; when
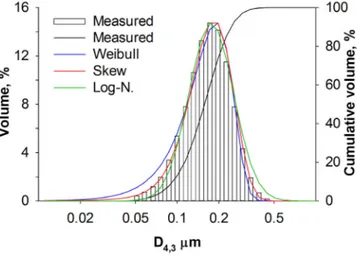
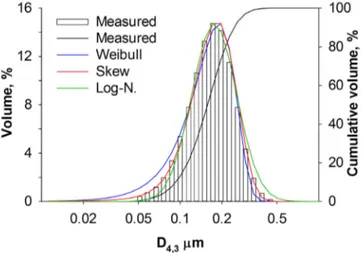
assembled the tip is non-protruding. . . 32 Table 4.2 Particle size distribution: (a) measured D4,3 arithmetic mean diameter
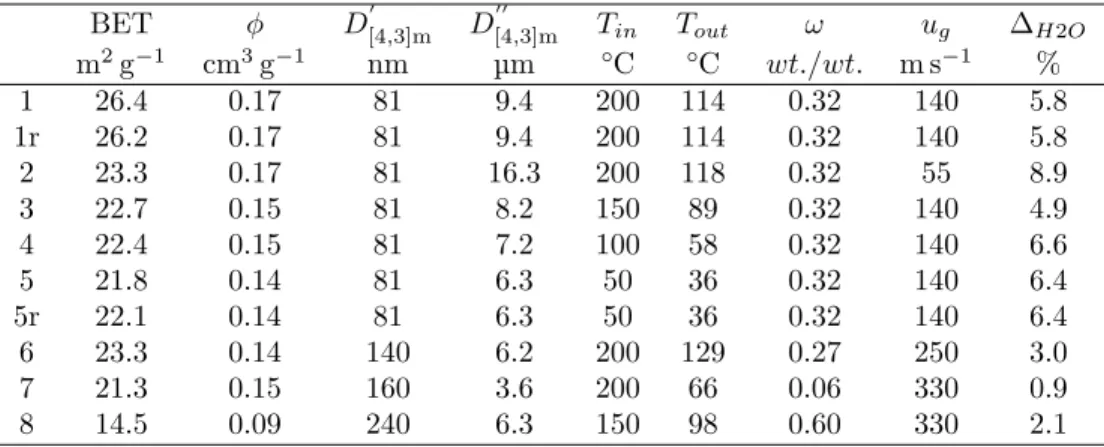
¯x and standard deviation s, (b) log-normal, (c) Weibull and (d) skew normal distribution models, regressed by minimization of the residual sum of squares over non-zero measured values. . . 37 Table 4.3 BET surface area by nitrogen physisorption (±2 %), φ pore volume
for pores smaller than 92 nm, D0
[4,3]m, D 00
[4,3]m primary and secondary
particle mode, Tin, Tout inlet outlet drying temperature, ω solid mass
fraction, ug atomizing gas velocity, ∆H2O residual water (water lost
during degassing). . . 37 Table 5.1 Spray dried powders from LFP suspensions with additives in water,
all slurries include the Tween-20 surfactant. PSD: secondary particle size mode and (distribution at one standard deviation). Carbon: total carbon relative to bone dry LFP powder (CI95 %
n=3). Sa: specific surface
area (CI95 %
n=3), Vpore: pore volume (CIn=395 %<0.01 cm3g
−1) and porosity
ϕ. Average crystallite size considering the 3 most intense peaks (Scher-rer equation), and γ-Li3PO4 composition (Retvield refinement). “Py”:
pyrolyzed powders. “US”: ultrasonicated suspension. . . 53 Table 5.2 Rheology of LFP suspensions; the apparent viscosity (µ, ±0.05 mPa s)
increases with: increasing solid mass fraction (ωLFP) and increasing
PVA binder content (ωPVA), while µ decreases with increasing
tem-perature (T ) and increasing shear rates ( ˙γsr). “US”: ultrasonicated
suspension. . . 62 Table 5.3 XPS elemental composition (atomic ±0.2 %). . . . 65 Table 5.4 Identification of functional groups and their at. % obtained from high
resolution XPS spectra, fitting of the C1s (top) and O1s peaks (bot-tom). Raman intensity ratio between carbon’s D and G bands (bottom, last column). . . 66 Table 6.1 Experimental design and results of the pilot spray dryer (1/5). . . 86 Table 6.2 Experimental design and results of the pilot spray dryer (2/5). . . 87
Table 6.3 Experimental design and results of the pilot spray dryer (3/5). . . 88
Table 6.4 Experimental design and results of the pilot spray dryer (4/5). . . 89
Table 6.5 Experimental design and results of the pilot spray dryer (5/5). . . 90
Table 6.6 N2 physisorption data. . . 97
Table 6.7 AMO’s degradation regressed zero and second order kinetic constants. 98 Table 6.8 BET surface area by nitrogen physisorption, results are within ±3 % (95 % confidence interval), φ pore volume, ∆dV (d) BJH dV (d) mesopore median, coke carbon content (0.05 % precision, 95 % confidence interval).105 Table 6.9 D crystallite size (standard deviation among Pt signals); Riet.Pt Ri-etveld refinement of the Pt phase, the complementary fraction was anatase TiO2; BET surface area by nitrogen physisorption, results are within ±3 % (n = 3, 95 % confidence interval C.I.); φ pore vol-ume (C.I. ±8 × 10⁻⁵cm3g−1); ∆ dS(d) dS(d) characteristic pore median (ads. BJH for mesopore and QSDFT for micro); V-t micropore area. 108 Table 6.10 Table of N2 physisorption data. . . 120
Table 6.11 Initial DOE regression. . . 125
LIST OF FIGURES
Figure 1.1 Crystal structures that intercalate lithium ion.[1] (a) Olivine LiFePO4
confines Li+ through a tunnel-like structure, this nearly close-packed
hexagonal array of oxides centers provides little free volume for Li+ to
diffuse. The layered structure of LiCoO2 (b) and TiS2 (c) is more open
and lets Li+ to migrate bidimensionally. . . . 6
Figure 2.1 Schematic representation of particle morphologies. a) Layered with central core. b) Layered with central void. c) Solid foam, closed cell. d) Solid foam, open cell. e) Particle with embedded nanoparticles. f) Composite shell. g) Irregular, with external voids and internal concen-tration gradients.[2] . . . 11 Figure 2.2 Summary of the behaviors according to the nanoparticle interactions,
which determine the shell permeability and consequently the Darcy pressure.[3] . . . 12 Figure 2.3 Buckling time as a function of ionic strength. The experimental data
measured for drying droplets of zirconia suspensions (circles) are well described by the model. The photographs show the grains obtained after full drying for different initial ionic strengths of the suspension, corresponding to different initial states (fully dispersed or suspension of fractal aggregates).[3] . . . 12 Figure 2.4 Modeling droplet size distribution, temperature profiles, relative
hu-midity, and cyclone efficiency give a better basis for spray-drying scale up, instead of trial-and-error approaches.[4] . . . 13 Figure 2.5 Control volume and transport terms for the spray dryer energy balance.[5] 14 Figure 2.6 Illustration of the preparation process and the microscale structure of
triple carbon coated LiFePO4 composite.[6] . . . 16
Figure 3.1 Schematic of the Yamato GB-22 spray dryer, co-current mode. . . 21 Figure 3.2 GEA Mobile minor spray dryer setup. . . 21 Figure 3.3 Typical particle size distribution and model fit for the feed material. . 22 Figure 3.4 Yamato GB-22 spray dryer, co-current mode.[7] . . . 23 Figure 4.1 Crystal structures that intercalate lithium ion.[1] . . . 29 Figure 4.2 Typical particle size distribution and model fit for the feed material. . 31 Figure 4.3 Yamato GB-22 spray dryer, co-current mode.[7] . . . 32
Figure 4.4 Semi-spherical secondary particles. The image shows both doughnut shape and spherical particles but all of the particles are toroidal. Close-up: When holes face the SEM detector, the doughnut-shape morphol-ogy is evident. . . 34 Figure 4.5 Poor atomization conditions creates semi-spherical and fragmented
ma-terial. The lack of carbon coating makes the non electrically conductive LFP surface look glassy. . . 35 Figure 4.6 Tinlet 200◦C, atomization velocity 140 m s−1, nozzle n.4, mass fraction
0.32 g g−1 . . . . 36
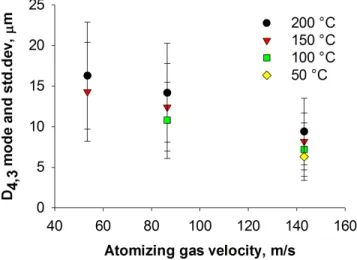
Figure 4.7 Nozzle n.4, same batch feed material, at a mass fraction of 0.32 g g−1
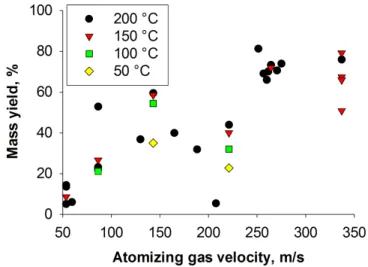
at different inlet temperatures. The bars represent the PSD standard deviation. . . 36 Figure 4.8 Data from different experimental conditions correlate with respect
dry-ing temperature and atomization gas velocities. . . 38 Figure 4.9 Each column represents a different batch of milled material with respect
solid loading and primary particle size. Particle density is invariant, but secondary particle size influences the flowability. . . 39 Figure 4.10 Mercury porosimeter curves for sample n. 2, on the abscissa, the
cal-culated pore diameter from pressure, using the Washburn equation, assuming cylindrical pores. . . 40 Figure 4.11 Sample n.2 isotherms, STP at 0◦C and 101 kPa . . . . 41
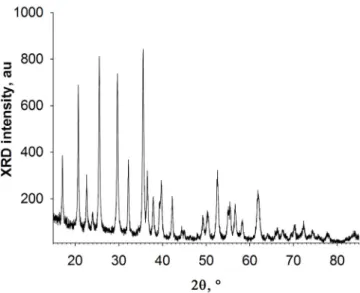
Figure 4.12 BJH adsorption dVolume(diameter) at different inlet temperatures and secondary particle sizes. . . 42 Figure 4.13 Theta-2-theta acquisition at 50 kV and 40 mA, using a Cu anode, Gonio
mode, CuKα sideband removed. . . . 43 Figure 5.1 GEA Mobile minor spray dryer setup. The recovery yield averages
80 %: 10 % of the material coats the chamber and another 10 % escapes the cyclone. . . 48 Figure 5.2 The spray dried LFP (red, bottom) presents broad peaks; calcination
improves crystallinity and the sample diffracts three times more (black, top). Diffraction patterns between samples are the same (Table 5.1). Top-right insert: # LiFePO4, * Li3PO4 . . . 52
Figure 5.3 The primary particles suspended in water agglomerate to secondary particles during spray drying. The resulting powder is homogeneous and different samplings makes minimal deviations. However sampling the suspension leads to greater uncertainty, due to instrument resolu-tion and irregular particle shape. Error bars for a CI95 %
n=5. . . 54
Figure 5.4 Particle morphology by SEM: “a” to “d” belong to the spray dried neat LFP suspension (adding lactose does not change the texture). How-ever calcination of LFP powders without carbon precursor sinters the primary particles together “g” and “h”, but not the secondary: “e” and “f”. Lactose prevents sintering and the powder remains nanostruc-tured: “i” to l”. Adding PVA changes the morphology of the spray dried material, creating submicron rods: “m” to “o”. Calcination of this material breaks some particles, revealing that they are hollow “p”. 56 Figure 5.5 Carbon coat morphology by TEM after pyrolysis: lactose decomposes
into a thin layer of semi-graphitic carbon (arrows, 1 nm to 3 nm, “a”), coating the primary LFP particles “b”. The addition of PVA super-imposes over the thin layer of lactose a grid-like carbon structure in-terconnecting the primary particles (circled, “c”). Ultrasonication de-polymerizes PVA into a short-chain polymer so the carbon grid is now smaller “d”. . . 56 Figure 5.6 N2 adsorption-desorption isotherms at 77 K, STP at 0◦C and 1 atm. . 57
Figure 5.7 Comparison between BJH (top) and NLDFT (bottom) pore size dis-tribution methods. Spray dried powders with (red, black green) or without carbon precursors (blue) shows similar pore morphology in the meso-macro pore region 5 nm to 300 nm. Calcination pyrolyzes the carbon precursors and partially sinters the LFP primary particles (open symbols). . . 58 Figure 5.8 The shear increasing isotherms at 25.0◦C (upward triangles) overtop
the shear decreasing curves (downward triangles). Viscosity increases with the solid mass fraction of LFP in water (blue, red, black). The addition of less than 7 % lactose does not modify the rheology of the material; while PVA increases the viscosity of the slurry (green). Error bars for a CI95 %
Figure 5.9 Eq. 5.6 model regression for 415 data points at different solid con-centrations, increasing shear rates, temperatures and binder loadings. Most deviations come from low instrument sensitivity at low torque (when µ <3 mPa s) and low shear rate ( ˙γsr <50 s−1). . . 63
Figure 5.10 (a) XPS spectra for the different carbon coating and control sample, and high resolution spectra of C1s (b) and O1s (c) for LFP-LP-Py. (d) Raman spectra, the vertical bars are the CI95 %
n=3 for each material. The
small peak at 950 cm−1 correlates with the stretching modes of PO
43-. 65
Figure 5.11 Preliminary test of cyclability at 0.1C discharge rate. PVA creates larger secondary particles, and a material with poor cyclability. Adding PVA and lactose stabilizes the trend, despite the same particle size. Smaller particles improve the discharge capacity. . . 67 Figure 5.12 Cyclability at 1C discharge rate, and 0.1C for the neat LFP and the
colloidal silica. Error bars represent 1 standard deviation, n=2. Adding PVA significantly improves the cyclability of the battery vs. the lactose based material (p < 0.02). . . . 68 Figure 5.13 Normalized cyclability at 1C discharge rate (one every 10 cycles is
conducted at 0.1C and not shown on the graph for simplicity). Lactose-PVA confer greater stability, the coin-cell battery would retain 80 % of the initial capacity after 1700 cycles (vs. lactose: 1100 cycles). Ultrasonication shortens the PVA’s chain length and induce instability in the trend. . . 69 Figure 5.14 Rate performance (bottom-left axes, symbols) and Galvanostatic curves
(top-right). The addition of high-Mw PVA (black lines and upward triangles) creates an extended carbon grid that better distributes the electric charge across the LFP nanoparticles, improving the discharge capacity. . . 70 Figure 5.15 Discharge curves at increasing C-rates. An extended carbon-grid (solid
line) dissipates the charge more efficiently at high C-rates with respect to a shorter carbon-grid (dashed) or no grid (dotted). . . 71 Figure 6.1 Three models describe the measured particle size distribution: the
skew-normal distribution has the best fit (R2 >99 %). . . . 74
Figure 6.2 Nozzle n.4, same batch feed material, at concentration of 0.32 wt./wt. The bars represent the particle size distribution’s standard deviation. 75 Figure 6.3 Bars represents the measured spray dried particles’ standard deviation,
Figure 6.4 The slow evaporation rate allows to identify the spray pattern. Tem-perature (in ◦C) is displayer on the right, with a color-coding gradient. 79
Figure 6.5 Temperature (in◦C) is displayer on the right, with a color-coding
gra-dient. . . 80 Figure 6.6 Low liquid flows reach higher temperatures as they heat up flowing
through the nozzle. Temperature (in◦C) is displayer on the right, with
a color-coding gradient. . . 81 Figure 6.7 At 180 mL min−1 the liquid contact time inside the nozzle decreases to
4 s, decreasing also the specific heat flow from the hot metal. Temper-ature (in ◦C) is displayer on the right, with a color-coding gradient. . 81
Figure 6.8 The “fog” inside the chamber demonstrates that the particles dry at the wet bulb temperature and do not overheat. Temperature (in ◦C)
is displayer on the right, with a color-coding gradient. . . 82 Figure 6.9 Error bars for a CI95 %
n=3, the difference between the two groups is
sta-tistically significant regarding temperature (p < 0.05, two-tail t-test), but not regarding the liquid flowrate. Data in the transition zone are not regressed. . . 83 Figure 6.10 Nozzle and top portion of the chamber. . . 84 Figure 6.11 Nitrogen adsorption-desorption isotherms of the calcined control and
hybrid powders.[8] . . . 96 Figure 6.12 Correlation between US power and adsorption kinetic constant for
Amoxicillin. . . 99 Figure 6.13 Experimental and regressed data validation. . . 100 Figure 6.14 Milling vanadyl pyrophosphate over time. The particle size
distribu-tion assume a bimodal trend and most material remains above 1 µm in size without ultrasound (a). Ultrasound milling speeds-up the process, achieving mostly submicron primary particles (b). . . 101 Figure 6.15 All fresh catalysts with loading <5 % express the same trend as the
bare support. Higher loading and used catalysts have occluded pores that decrease the amount of N2 adsorbed. . . 103
Figure 6.16 The pore fraction below 10 nm is filled as the WO3 loading and coke
formation increases. . . 104 Figure 6.17 Pore volume and specific surface area model fitting. . . 104
Figure 6.18 Stacked spectra recorded with the same conditions and smoothed with an 11 points cubic function, Cu-kα sidebands were removed: coke de-posits on the used sample reduced the signal to noise ratio. Four sharp Pt signals (39.6◦, 46.0◦, 67.4◦, 81.2◦) and their respective planes [hkl]
have been identified. The remaining peaks belong to the Titania sup-port (anatase).[8] . . . 109 Figure 6.19 Fresh 1.5 % Pt over WO3/TiO2particles. The LABE detector enhanced
the signal from heavy elements and the Pt crystals appeared as bright white spots.[9] . . . 110 Figure 6.20 Fresh 1.5 % Pt over WO3/TiO2 particles. The metallic platinum
crys-tals appeared as multi-facets prisms. Considering their sizes (submi-cron), the crystallyte size of 88 nm (XRD) and the crystal structure of metallic Pt (cubic), we could conclude that each crystal was composed of several crystallites. . . 111 Figure 6.21 Used “t12” catalyst’s surface. Shiny “metallic-lookalike” coke chunks
were dispersed around the spherical catalyst particles after mechanical breakage. Some particles broke as well. . . 111 Figure 6.22 SEM and EDS mapping of the used “t12” catalyst’s surface. Carbon
(C, red) partially covered the surface and suppressed the underlying elements’ signals. Oxygen (O, blue) was predominant were titanium was also present (Ti, yellow), less were carbon was present and ab-sent were platinum was preab-sent (Pt, violet). Tungsten (W, green) was homogeneously distributed along with titanium. . . 112 Figure 6.23 Catalyst particle size distribution in logarithmic scale. Coke deposits
broadened the peak and increased the average. . . 112 Figure 6.24 The fresh catalyst was mesoporous and after reaction resulted
micro-porous. In the latter, the adsorption rapidly grows to plateau (P/P0
0.0005-0.1) and the type 4 hysteresis remained open. This is often associated to narrow slit micropores. . . 113 Figure 6.25 Correlation between catalyst loading and selectivity.[10] . . . 114 Figure 6.26 Interaction of the H2WO4 catalyst with the levulinic acid substrate.
This octagonal adduct enhances the formation of methyl succinate.[10] 115 Figure 6.27 N2 physisorption isotherms at different catalyst loadings (0.7 mm I.D.
nozzle). The lack of hysteresis superimposes the adsorption and des-orption isotherms. 0.8 % Pt maximize adsdes-orption. . . 117
Figure 6.28 Porosity and SSA for the two set of spray drying conditions, with re-gression and 95 % confidence bands. . . 118 Figure 6.29 The Pt-W-Ti composite formulation creates a network of micropores
that dictates the high SSA (0.7 mm I.D. nozzle). Meso- and macropores contribute for 5-10 % of the total SSA, invariant with the Pt loading. 119 Figure 6.30 Pareto chart of standardized effect. Response variable: FFA
concen-tration at 1 h (red) and 3 h (black). 2.3 is the value above which the variable (T = temperature, P = ultrasound power and Xj = alco-hol/FFA molar ratio) has a significative effect (α = 0.1) . . . 121 Figure 6.31 Viscosity of biolubricants vs T and logarithmic regression and
extrap-olation up to 100◦C. . . 122
Figure 6.32 Mucus becomes less viscous at high shear rates. . . 124 Figure 6.33 Work of adhesion (mN/m) response surface when the mucin fraction
reaches 4 %. A saddle contour identifies the areas where WA is mini-mum (cold colours): lowest frequency with highest salt concentration and high frequency with no salt. . . 126 Figure 6.34 Type IV(a) isotherms, glucose arranges the material in plate-like
par-ticles (blue and red) while cellulose and lignin create a bottle-neck network (green). . . 128 Figure 6.35 Pore size distribution: when the material has two sharp peaks around
2 nm and 4 nm, it exhibits higher EC performances. . . 129 Figure 6.36 Pore volume contour plot: the aberrant data (sample 215) has been
excluded. . . 130 Figure A.1 On the left an old (’80) FT-NMR Spectrometer; a pneumatic arm
low-ers the sample between the 80 MHz resistive magnets. An RF pulse generator activates the test sample in the center of a static magnetic field (N–S) and an RF receiver measures the fluctuations. The recorded spectrum (FID, free induction decay) sums multiple scans into a sinu-soid that decays exponentially with time. A Fourier-Transform of the FID identifies the dominant frequencies that belongs to atoms in the molecule. . . 160
Figure A.2 The1H spectrum for a derivative of 6-methylhept-6-en-2-one in CDCl 3,
recorded at 400 MHz at rt.[11] The signal from “A” has three peaks (t: triplet) and its integration gives an area that is normalized to 1.0 (in green, one proton). Each peak has a distinctive chemical shift (blue) and their distance (in Hz) measure the J-coupling constant (violet). The “J-tree” (violet) is a representation of the Pascal’s triangle: a rule that correlates the shape of the NMR signal with the number of vicinal protons. “A” couples with the two protons in “G” and creates a triplet. “B”, “C”, “E”, “F” and “H” are all singlets (s), meaning that close to them there are no protons available. “E”, “F” and “H” belong to the methyl groups, as their area integral is three times the one from “A”. Between them “E” in the most deshielded group: the electron cloud is displaced towards the double bond, so the peak appears at high chemical shifts. Unlike in the methyl group, where all three protons are chemically equivalent, the protons bonded to a sp2 carbon are not.
Therefore “B” and “C” appear as two distinctive singlets as none of them correlates with a vicinal proton, with an integral of one. “D” follows the same rule as “A”, but the integral is double as it has two protons. “G” has also two protons, but it also has a more complex coupling: on the left it couples with one proton from “A” and on the right with two protons from “D”. Because the two couplings have different J-constants (14.3 and 6.6 Hz), the doublet (d) from “A” splits the triplet from “D” in two branches. Following the Pascal’s triangle rule, this shape (dt) appears with five peaks, as the two branches in the center overlap and increase in intensity. . . 163 Figure A.3 NMR bibliometric network:[12, 13] the size of the keyword is
propor-tional to the number of occurrences (from 80 to 640). The distance between keywords shows how two topics closely relate each other. The number of links was limited in order to elucidate the main connections between different areas. . . 166
Figure A.4 On the left: non-spinning samples’ peaks appear broader (blue). A spinning sample sharpens the peaks and allow multiplicity detection, but creates secondary peaks —sidebands— equally spaced (3 Hz, which corresponds to the rotational sample’s rate) from the main peak (red). On the right: a poorly shimmed and phased 100 MHz proton spectrum (blue) and a 400 MHz one (red). On the latter each peak is symmetrical (good shim and phase) and the stronger magnet resolve the multiplicity (dddd) for the two exocyclic doublebond’s protons (Ha and Ha’). . . . 171
Figure A.5 13C spectra of a solution of an organic compound in (CD
3)2SO, recorded
at 100 MHz in J-MOD, to separate primary and tertiary carbons (top peaks) from secondary and quaternary ones (bottom). From bottom to top after: 2 (red), 4 (yellow), 8 (green), 16 (cyan), 32 (blue) and 256 scans (violet), the s/n increases from 13, 19, 27, 35, 52 to 150 (top peak). . . 173 Figure B.1 LEI detector: spray dried spherical VPO secondary particles, in detail
the primary particles composing the aggregates. LABE detector: in detail the detector can better visualize the vanadyl primary particle in respect to the silica coating. . . 176 Figure B.2 EDS spectrum (left), note how vanadium is not detected since is coated
with a layer of silica. EDS mapping (right) of a spray dried core-shell VPO catalyst, the external silica shell (red), covers the bulk vanadyl pyrophosphate salt (green). . . 177 Figure B.3 SEM (a) and TEM (a’) of VPO precursor. . . 178 Figure C.1 Sketch of the wet media mill, reducing the size of the primary particle
from 27 µm to 200 nm took 4 h for a batch of 50 kg. . . 190 Figure C.2 Model regression for estimating the carbon contribution of each
pre-cursor. . . 190 Figure C.3 High-resolution spectra of C1s and O1s of the pyrolyzed samples:
LFP-L-Py with lactose (a-b), LFP-LPU-Py with lactose, PVA and ultrason-icated (c-d) and LFP-neat-Py calcined with no carbon precursor (e-f). 191
LIST OF SYMBOLS AND ACRONYMS
C/LFP Carbon coated Lithium Iron Phosphate, C/LiFePO4
EG Exfoliated Graphene flakes GO Graphene Oxides sheets
LFP Lithium Iron Phosphate, LiFePO4
LIB Lithium Ion Battery LMO Lithium metal oxide PSD Particle Size Distribution
LIST OF APPENDICES
Appendix A ARTICLE 3 - EXPERIMENTAL METHODS IN CHEMICAL ENGI-NEERING: NUCLEAR MAGNETIC RESONANCE . . . 158 Appendix B Additional scientific contribution as co-author . . . 175 Appendix C CHAPTER 5 - SUPPLEMENTARY INFORMATION . . . 190 Appendix D MILESTONES . . . 192
CHAPTER 1 INTRODUCTION
The obnoxious beauty of fossil fuels is due to their ability of disposing of their energy quickly, on-demand and to store it in small volumes due to it’s high energy density. Renewable energy sources instead, are fundamentally discontinuous. Therefore these centuries global effort, to reduce carbon emission and to switch to renewable energy sources, is mostly focused to cre-ate an efficient and economic energy storage system. Bloomberg’s “New energy finance” report forecast that by 2050, 50 % of the global electric generation will be met by wind and solar, with an 11.5 trillion dollar investment in new power generation. This investment will be accompanied by 0.5 trillion dollar in new battery capacity. Indeed, energy storage is the missing piece of the puzzle for renewable energies. Energy storage becomes particularly important when looking at transportation vehicles, for example gasoline and diesel vehicles pollute and require more and more sophisticated systems to decompose the exhaust pollu-tants to CO2. In fact, Europe will ban diesel car sales by 2020, due to their unacceptable
pollution standards. On the other hand, electric cars, are more expensive to purchase, al-though the cost is primarily related to the battery pack. A gasoline car is more expensive to manufacture compared to an electric car without it’s “battery”, the gasoline car has also more mechanical components, requires more maintenance and fluids to operate. In collab-oration with Université de Montréal and CANMETmaterials, we developed a new process to make inexpensive cathode materials for Li-ion batteries for automotive applications. In 2010 the cost of a Li-ion battery pack was 1000 USD kWh−1, in 2014 500 USD kWh−1, and
in 2018 dropped to 200 USD kWh−1. In a battery the most expensive component is the
cathode material, which represents 20 % of the total cost. In the melt-synthesis process we prepare ingots of LiFePO4 with inexpensive ore-grade substrates.[14] The ingots from the
melt are ground with a jaw crusher, roller grinder and ultimately with a wet media mill, to reach a nanoparticle solid suspension in water,[15] as a 200 nm particle size enhance the performance and cyclability of the battery.[16] Controlling the primary particle size (200 nm) is critical to achieve a high flow of Li-ions during the charge/discharge of the battery. Unlike other cathode materials, LiFePO4 has a mono dimensional tunnel-like crystalline structure,
in which the Li-ions intercalate. This limits the diffusivity of the Li-ion inside the material and to achieve fast charging and discharging properties, a small primary particle generates a high specific surface area and therefore, a high Li-ion flow. To achieve that, we have to grind the material to the nanoparticle size and a suitable instrument is a wet media mill, which creates a nanoparticle suspension in water. But, removing solvent from nanoparticle solid suspension requires the same diligence as drying pharmaceutical ingredients. LiFePO4
nanoparticles suspension in water oxidize, sinter and Li3PO4 segregates on the surface when
they dry in a furnace. Spray drying preserves the material properties because contact times are on the orders of seconds; furthermore, the atomized droplets ensure particles are small and dispersed. This PhD thesis regards spray drying this LFP nanoparticle suspension into a bone dry dust and testing their performance once assembled in a battery. However, the LiFePO4 material also suffers from poor electrical conductivity, to resolve this issue we spray
dry the mixture with organic binders dissolved in the suspension. Spray drying coats the primary particles with the organic binders, it aggregates the nanoparticles in a micron sized secondary particle and removes the solvent. Finally pyrolysis converts the carbon precursors into conductive carbon, which improves the electric conductivity of the active material. The pyrolyzed powder is then mixed with the electrolyte, homogenized in a tube roller, painted on an aluminum current collector and assembled in a coin cell battery for testing.
1.1 Definitions and basic concepts
Li-ion batteries (LIB) are rechargeable accumulators where, during discharge, electrons flow from the negative electrode to the positive one through an external electrical circuit, while the lithium ions close the internal circuit by diffusing from the anode to the cathode within the cell unit. Anode (graphite, C6) and cathode (LFP, LiFePO4) are separated by a
semi-permeable mesoporous polyethylene membrane, that allows only Li+ to pass through (good
ionic conductivity) but avoids electrons to flow directly across (avoid an internal short circuit). LIB have the peculiar characteristic in which anode and cathode intercalates Li+. The liquid
electrolyte solvates the Li+and allows its diffusion through the cell, withstanding severe redox
conditions without decomposition.[17] To increase the medium conductivity; salts (LiPF6,
LiBF4 or LiClO4) are added to the organic solvent (ethylene carbonate, dimethyl carbonate,
or diethyl carbonate).[18]
In LiFePO4, the lithium atom has a positive +1 charge, the iron +2 and the phosphate group
balances with a -3 charge. When Li+ deintercalates, the cathode material becomes FePO 4,
with Fe3+.[19] During discharge Li+ deintercalates from the higher redox potential graphite
anode:
LiC6 −−→C6+ Li
++ e− (1.1)
Li+ diffuse through the membrane and reaches the cathode, then Li+ ion intercalates the
Fe3+PO 3 –
4 , which gets reduced to Fe 2+:
FePO4+ Li
++ e− −−→LiFePO
4 (1.2)
The reaction is reversible by imposing an external electromotive force during the charge process.[20]
The C-rate is the rate at which a battery discharges relative to its maximum capacity. At 1C the battery discharges in 1 h, at 0.1C in 10 h and at 2C in 30 min, for automotive purposes the average C-rate is 0.5C-1C, with peaks of 10C during acceleration. High C-rates are more demanding and stress the battery more and represent transportation applications best. The capacity of a battery (Ah for a specific C-rate) is the coulometric capacity, the total Amp-hours available when the battery is discharged at a certain discharge current (specified as a C-rate) from 100 percent state-of-charge to the cut-off voltage. Capacity is calculated by multiplying the discharge current (in Amps) by the discharge time (in hours) and decreases
with increasing C-rate.
The cyclability of a battery is the number of cycle of charge-discharge the battery experiences before it fails to meet specific performance criteria.
1.2 Open problems
Lithium-ion batteries power our life: cellphones and computers count in billions of units, all with a lithium-ion battery inside. Technology aims to scale-up batteries to the automotive industry and stationary energy storage systems.[21] Towards this goal, batteries having high efficiency, long-life and low-cost are the best choices to effectively transition to electric vehi-cles and decrease our dependency on fossil fuels; while electric storage units create a flexible and reliable grid system smoothing-out the fluctuating supply from renewable sources.[22] The cathode represents the bottle-neck of this technology, as its capacity is one order of magnitude lower than the graphite anode. LiCoO2, at 273 mA h g
−1, is the cathode of choice
for electric vehicles, but is costly and has safety and environmental issues.[23] LiFePO4 has
a lower capacity (170 mA h g−1) but costs less, is thermally stable, and its precursors are
en-vironmentally benign.[24, 25] Lithium-sulfur cells with a glass solid-state electrolyte promise to be the next generation batteries, but despite their outstanding cycle life (above 15000), and improved capacity (reaching 500 mA h g−1) this technology is still young and is unknown
whether it will be industrially scalable and cost-effective.[26] Commercial LiFePO4 batteries
discharging at 2.5C-rate maintain their temperature below 55◦C and in case of short-circuit
would not sustain a thermal-runaway and ignite.[27, 28] On the other hand, LiFePO4
mate-rial has a poor electrical conductivity and slow Li+ diffusivity in the crystalline matrix. The
addition of carbon black[29] and coating with a carbon layer or metal oxide increases the elec-trical conductivity[30, 31] while doping it with cations improve the Li+diffusivity.[32] Carbon
nanotubes (CNT) demonstrated high power output and excellent cycling performance in a ZnFe2O4−C/LiFePO4−CNT battery, but only at a laboratory scale (10000 cycles at 10C,
retained 85 % of the initial capacity).[33] Other laboratory scale innovations improve the wettability by nanostructuring the material: a greater specific surface area puts more mate-rial in contact with the electrolyte, which increases Li+ flow rate across the cathode while
nanoparticles shortens the diffusion path and lowers the mass transfer resistance across the material.[34] Moreover, flame-spray pyrolysis demonstrated the importance of controlling the size of the powder also at a micron-scale level.[35] Coupling LiFePO4 with iodine modifies
the redox cycle and improves the energy density[36] and different carbon precursors lead to a better conductive carbon layer.[37]
It is important to stress that in the optic of sustainable development, new materials, processes and products have to be sustainable. A patented melt-synthesis process[38] cuts the costs of raw material manufacturing by an order of magnitude, the melt-synthesized LFP achieves an optimal elemental dispersion and crystal structure[39] and it can potentially recycle the spent material at the end of its life. A melt-synthesis process can recover the inorganic
salt components of the cathode, burn-off the carbon and plastic components of the battery casing and separator, thus allowing battery’s recycling of the main components. The melt-synthesis process requires then to grind the melted ingots to nanometric particles: Li+ flow
increases six orders of magnitude by reducing the particle size from micron to nano size while creating a mesoporous structure: both specific power and cyclability improve.[40] In fact, lithium ion diffusivity through the olivine crystal matrix of LFP is low compared to the more open structures of LiMnO2, LiCoO2 and TiS2 (Figure 4.1) and varies from 10
−11m2s−1 to
10−18m2s−1.[41] LFP electrical conductivity is also low at 10−7Ω−1m−1.
Figure 1.1 Crystal structures that intercalate lithium ion.[1] (a) Olivine LiFePO4 confines Li +
through a tunnel-like structure, this nearly close-packed hexagonal array of oxides centers provides little free volume for Li+ to diffuse. The layered structure of LiCoO
2 (b) and TiS2
(c) is more open and lets Li+ to migrate bidimensionally.
We solve those shortcomings by reducing the LFP powders to the submicron and nano particle range,[42] and coating with a 2 nm electron-conductive carbon layer.[43, 1] Lithium ion diffuses through the olivine crystal structure of LiFePO4 to the electrolyte medium faster
when the specific surface area of the material is increased.
There are several commercial processes to synthesize the nano-structured cathode material for Li-ion batteries: sol-gel process, electrochemical synthesis, solution co-precipitation, hy-drothermal synthesis, and flame-spray pyrolysis.[44] All these methods involve processing large quantities of solvent with solid mass fractions ranging from 10 % to 70 %. Drying is a critical step and controlling the temperature during the process is important to maintain the desired material morphology.[45] Removing solvent in furnaces changes the nano-structure, oxidizes the surface, agglomerates the particles, occludes the pores and change the crystal structure.[46] Drying in fluidized bed dryers is a discontinuous process divided in multiple drying and comminution steps, each lasting 10 min to 60 min: as the powder dries, it ag-glomerates. Therefore the resulting granules need to be reduced in size between each step to be able to control the residual moisture of the final material.[47] Spouted bed dryers have 10 to 15 times the drying rate of a conventional spray dryers but only fluidize big particles (>200 µm).[48] Plasma-spraying is a novel technology for delivering nanometric (<30 nm)
dried particles,[49] but the cost for this technology discourages any industrial scale up for LFP. It is also unclear if it is possible to maintain the olivine crystal structure during the plasma process. Spray drying is a robust technology used in the pharmaceutical, food and catalyst industries to dry solutions or suspensions economically and quickly (0.1 s to 60 s) at low temperatures (60◦C to 200◦C), preventing degradation and achieving a fine granule size
(2 µm to 300 µm).
We demonstrate the scale-up feasibility for spray drying melt-synthesized LiFePO4 and
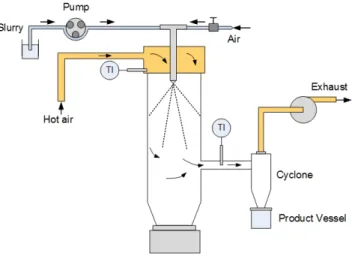
or-ganic precursors that self-assemble into a carbon cage, which increases the cathode cyclability, similarly to carbon nanotubes.[50] Melt-cast processes reduce the reactant cost by 40 %, start-ing from lower-grade purity precursors, but still yield a pure, crystalline material.[51, 52] In our process, a furnace produces LFP ingots. Subsequently, a jaw crusher, a roller grinder and a wet media mill reduce the size of the material to the nanoscale in water. Organic precursors are mixed and spray drying desiccates the suspension. In the process, a two-fluid nozzle at-omizes the suspension with compressed air. The hot air dries the microscopic droplets (from 1 µm to 100 µm), and the suspended nanoparticles (primary particles, facing sizes ranging from 0.07 µm to 0.2 µm) agglomerate into a porous, spherical or doughnut-shaped, secondary particles (from 5 µm to 50 µm) which forms the powder that is collected from the unit. The resulting porous powder is then calcined to pyrolyze the organic precursor to semi-graphitic carbon which enhances the electrical conductivity of the material. Finally, we established the electrochemical quality of the LFP/C active cathode material using coin-cell batteries.
1.3 General research objectives
Identify spray dry conditions to dry LiFePO4 nanoparticle’s suspensions that maximize the
bulk density, while maintaining high surface area, porosity and optimal electrical properties, including different carbon precursors.
1.4 Specific objectives
We aim to identify the optimal spray drying conditions and correlate the main factor of spray drying (temperature, atomization pressure, drying air flow, feed flow, solid loading, feed composition and particle size) with yield, residual moisture, secondary particle size and morphology, porosity and density. We want to establish on the laboratory unit, the scale-up criteria and use them on the pilot unit to investigate how carbon precursors and secondary particle size affect the electrochemical property of the cathode in a battery.
1.4.1 Identification of the optimal spray drying conditions
As inlet temperature augments, the drying thermal efficiency increases. However excessive temperature and residence time oxidize the material to Fe(III). At the laboratory scale, we ramp up temperature to 200◦C (in the pilot, up to 350◦C), to identify the optimal
drying conditions. We investigate the effect of temperature, feed concentration, atomization and primary particle size over the response variables: secondary particle size distribution, bulk density, residual moisture, surface area and porosity. Higher temperatures increase the mesoporosity, increasing the surface area. A faster drying rate leaves less time for particle agglomeration. Moisture level decreases as the heat flux is more intense and particles dried at a higher temperature will be bigger as the drying air density decreases. We will assess if the drying conditions oxidize the surface of the material with XRD. SEM will give us the microscopic material morphology and EDS mapping the phase segregation (in case drying segregates two or more phases or the melting process created a different material). A laser scattering diffractometer assesses the particle size distribution. Surface area, porosity and residual moisture are measured using a nitrogen physisorption instrument.
1.4.2 Deriving an empirical model for bulk density
Higher temperatures increase the powder mesoporosity (a microscopic property), but the bulk density of the powder is mostly affected by macroporosity (a macroscopic property). We established that the material porosity increases as the feed solid concentration decreases. A less concentrated material increases the amount of steam leaving the drying particle, thus pushing the primary particles away to create discharge channels for the leaving vapors. Also, smaller secondary particles increase the cohesive force, allowing less powder to compact during bulk and tapped density measurement.
1.4.3 Conceive scale-up criteria based on testing in the pilot and laboratory scale dryer, investigate interactions with carbon precursors and electro-chemical battery tests
Spray drying creates a mesoporous powder that promotes wettability. The addition to the suspension of lactose and high-Mw polyvinyl alcohol (PVA) and pyrolysis creates a carbon grid that interconnects the cathode nanoparticles, imparting better capacity (LiFePO4/C:
161 mA h g−1 at 0.1C-rate), discharge rate (flat plateau with 135 mA h g−1 at 10C), and
cy-clablity (88 % capacity retention after 950 cycles at 1C). Spray dried particle size affects battery stability; PVA increases the suspension’s viscosity and alters the powder
morphol-ogy, from spherical to hollow particles. A model describes the rheology of the non-Newtonian ternary system: water-LFP-PVA, for shear and temperature variation. We investigate the calcination mechanism by measuring the carbon content and chemical composition of the pyrolyzed species by XPS and Raman. Carbon precursors prevent sintering of the nanopar-ticles but lactose gasifies 50 % of the carbon. The PVA carbon grid imparts microporosity and we correlate the SEM and TEM powder’s morphology with N2 physisorption
porosime-try. Ultrasonication of the LFP-organic precursors suspension leads to the fragmentation of the PVA chain, which is detrimental for the final cathode material.
CHAPTER 2 LITERATURE REVIEW
Researchers use spray drying as a tool to dessicate materials and form particles, without investigating the effect of particle size, density, porosity, morphology on the material prop-erties. Spray drying scale-up is mainly carried-out based on experimental know-how and a list of carbon precursors gives a starting point for achieving an optimal electron-conductive carbon layer after pyrolysis. Moreover, the choice of the appropriate nozzle and surfactants impact on the atomization of the suspension during drying.
2.1 Spray drying
The process of milling, spray drying and powder’s pyrolysis has already been reported in liter-ature (called WSC: Wet milling, Spray drying, Carbothermal reduction).[53] The researchers mill the salt precursors to a <100 nm suspension, spray dry the material maintaining a meso-porous structure forming 5 µm to 10 µm aggregates, then synthesize the cathode material and carbon coat it with starch simultaneously at the carbothermal reduction step — solid state reaction at 650◦C for 8.5 h. Our methodology envisages ore-grade materials, thus is
economically more appealing. Controlling the primary particle size distribution is crucial to reach the desired electrochemical properties. As milling progresses, the material comminutes. Batches of different milling times — and different PSDs — have, however, counterintuitive properties. After spray drying each batch material with the same conditions, a battery ca-pacity test demonstrates that the process is nonlinear.[54] Specific surface area and battery capacity are maximized at 2.5 h of milling, with a D50 primary particle of 110 nm. After,
the assembled battery performance decreases. It is unknown however, if different drying conditions enhance the smaller particles’ rheological suspension.
Spray drying a suspension instead of a solution achieves better results.[55] Three different drying methods are reported to make LFP/C, including particle morphology analysis and elemental distribution. Directly spray drying a solution of the precursor salts resulted in phase segregation that could not be resolved during annealing. Two different crystalline products lead to no energy storage property. Gelification of the starting solution intimately mixed the components, leading to pure LFP/C product during annealing. However poor specific surface area leads to poor battery performance. Spray drying the sol–gel material creates a mesoporous structure with higher surface area and battery capacity. To avoid thin-shell particles from spray drying a solution, a sol-gel process precipitates the molecules into nano-sized primary particles that then agglomerate into a micro-sized network. This
forms an homogeneous mesoporous structure upon spray drying.[56] Another paper reports the effect of pH over the stability of a nanoparticle suspension. Breaking the isoelectric point and letting the nanoparticles flocculate together (pH 8) avoid blow-holes and improve the density of the material, thus maximizing the battery’s energy density.[57] Supercritical synthesis of 80 nm LFP crystals starting from salt precursors and subsequent spray drying to 60 µm particles, created a material with poor electrical properties.[58] The material surface area is undisclosed as well as the spray drying conditions, in fact, 2 µm to 10 µm spray dried particles would maximize the battery’s performance, by exposing high surface for Li+ flow.[6]
Particle engineering of pharmaceutical ingredients via spray drying is an intense field of research that has already established several criteria and dimensionless numbers to describe the process. The definition of the dimensionless Peclet number discriminates between particle morphologies (Figure 2.1).[2]
Figure 2.1 Schematic representation of particle morphologies. a) Layered with central core. b) Layered with central void. c) Solid foam, closed cell. d) Solid foam, open cell. e) Particle with embedded nanoparticles. f) Composite shell. g) Irregular, with external voids and internal concentration gradients.[2]
Each particle morphology is examined — doughnut, hollow-shell, deflated balloon, homo-geneous isotropic shrinkage (Figure 2.2) — and a drying mechanism is associate for each phenomena. For Pe <1 we have isotropic shrinkage to a dense spherical particle. For Pe >10 the dried particle resembles a deflated balloon. The effect of nanoparticle interaction (Figure 2.3) and shell permeability are introduced to model the drying mechanism .[3]
The spray of a solution of salt precursors in water gives a thin-shell dried particle. Wet milling overcomes the material inherent low particle density, while forming a compact dense spray dried particle.[59] However, the methodology is unrepeatable due to the lack of the experimental conditions. The initial particle morphology could have been engineered from the beginning to obtain a void-less material by changing the drying rate or the pH of the solution. There is no information regarding the drying step, and again all effort has been put in the precursors choice and battery testing, rather then the powder technology. An alloy of 2 LiFePO4Li3V2(PO4)3 is prepared by wet ball milling and spray drying, along with
Figure 2.2 Summary of the behaviors according to the nanoparticle interactions, which de-termine the shell permeability and consequently the Darcy pressure.[3]
Figure 2.3 Buckling time as a function of ionic strength. The experimental data measured for drying droplets of zirconia suspensions (circles) are well described by the model. The photographs show the grains obtained after full drying for different initial ionic strengths of the suspension, corresponding to different initial states (fully dispersed or suspension of fractal aggregates).[3]
disclosed, the focus is only on the novel cathode material and its testing. On the other hand, spray drying of APIs is well described in literature. A Monte-Carlo stochastic approach is used to model the impact of the feed material’s different particle sizes on the dried material.[5] The crystallization time, versus the time required to dry the solid into an amorphous state, plays a role in defining the particle morphology during spray drying.[61] Indeed LFP is
insoluble in water, at pH 6.5, but in acidic conditions LFP is partially soluble which alters the viscosity of the feed material. The importance of drying rate for achieving a dense, compact spray dried particle relies on the spray dryer dimensions.[62] A bigger spray dryer unit allows more contact time for the drying particle, thus allowing the suspended particles to compact more and achieve a superior attrition resistance material. Lower inlet temperatures — lower drying rates — allows the suspended nanoparticles to compact into a less porous dried material.
2.2 Scale-up
The scale-up of spray drying has been mainly carried-out based on experimental experience (Figure 2.4).[4] The whole process depends on the feed properties, equipment dimensions and design. However, some theoretical engineering models approaches can be found in the literature.[63]
Figure 2.4 Modeling droplet size distribution, temperature profiles, relative humidity, and cyclone efficiency give a better basis for spray-drying scale up, instead of trial-and-error approaches.[4]
The humidity of the air leaving the drying chamber is a critical control parameter. Ther-modynamic calculations estimate the humidity of the exhaust air for a particular set of temperature, pressure, flow and heat loss conditions. However, this methodology was inca-pable to predict particle and powder related characteristics (particle size and moisture level in the particle).[64]
Further investigations looked for the ability to produce identical powders, in different scale instruments, by matching the droplet size distribution atomized. However, the methodology was unsuccessfully implemented, because the differences in droplet temperature and contact time were ignored as the scale of the instrument changes.[65]
A methodology that takes advantage of thermodynamics calculations, droplet drying kinetics simulations, particle formation, computational fluid dynamic and atomization principles give an alternative to traditional empirical spray-drying process development methods.[66] Spray-dryer scale-up presents some advantages when scaling suspensions feed materials. The atomization process gives a more uniform droplets size distributions and the drying rate is slower, the possibility to work in different fluid-dynamic regimes around the droplet (pure diffusion to laminar), controls the density of the powder.[67] However, the need for more feed material poses critical evaluations over the choice of liquids’ volumes. Spray-drying small volumes of suspensions lead to uncertainty at the beginning and at the end of the spray, as the material mixes with the air or pure solvents and solid loading drops. The internal fluid dynamic of the drying air changes to a turbulent regime, as the internal chamber diameter increases. The more complex design and faster air flows increase the attrition of the dried material with the piping, leading to particle fracture.[68]
A thermodynamic model predicts outlet temperature and powder’s residual moisture con-tent during the spray drying process and Monte-Carlo simulation analyzes the effects of the aerodynamic size of the droplets. These modeling techniques allows to order the relative im-portance of the process variables and aids in understanding the drying unit operation (Figure 2.5).[5]
The biggest challenge in spray dryer scale-up is the formation of the same particle size and structure with respect to the laboratory unit, and therefore the same powder properties. The numerous interacting mechanisms that happen across all length scales make standard process scale-up approaches, (like dimensional analysis), of limited use in a spray dryer. There is no linear correlation between the mechanisms and associated dimensionless groups, even if the geometry of the instrument is preserved. A starting point in process scale-up is to recognize the scale-independent process factors that are necessary to achieve the desired particle properties. Ideally, one would match the following important parameters across the different scales:
• Feed properties and feed solid content. • Atomized droplet size distribution • The droplet drying rate.
• The (if present) desired particle to droplet collisions which form agglomerates. • Avoid wall contacts and build-up.
However, in most cases it is not possible to conciliate all factors and differences are seen in particle size, morphology, and product residual moisture content, due to differences in tower design at different scales.[68]
On the laboratory scale, dilute feeds tend to be sprayed due to small-scale pump performance in achieving a good pressure drop during atomization. The particle size is also small due to the low residence times available for drying at the laboratory scale (< 1 s), pilot scale towers have shorter residence times (20 s) and on the production scale (> 40 s). Laboratory scale spray dryers are typically equipped with two-fluid nozzles which make small droplets whereas large scale spray dryers use pressure nozzles that create larger droplets and therefore larger particles. Adjusting the feed composition can lead to variation in product quality and heat loss from the dryer walls and yield varies between the scales. Yields on small scale spray dryers are generally below 70 % due to a large fraction of fine particles lost in the cyclone or filters and the formation of wall deposits. The latter phenomena happens due to incomplete drying of the droplets and changes the product properties and texture.[67]
2.3 Carbon coating
A three-component carbon precursor forms a hierarchical conductive architecture as high-performance cathode for Li-ion batteries after spray drying a precursor solution (160 mA h g−1
at 1C) (Figure 2.6).[6] However the methodology is unrepeatable due to the lack of the experimental conditions related to the spray drying step.
Figure 2.6 Illustration of the preparation process and the microscale structure of triple carbon coated LiFePO4 composite.[6]
Doped graphene oxide sheets (GO) achieve superior battery performance, with respect to traditional graphene (anode). In this process researchers spray dry GO and doping salts together and provide some information regarding the drying mechanism but the main aspects — surface area vs. drying rate or temperature, particle density — remain undisclosed.[69] Exfoliated graphene flakes (EG) were synthesized, imparting superior properties with respect to a commercial grade LFP/C (25 % better capacity vs. commercial grade LFP/C).[70] This technology can be applied to our situation since we want to impart electrical conductivity to a pre-synthesized LFP and the EG nano-sheets can effectively coat our primary particles. However, spray drying remains a poorly reported step in literature. The authors prepare a novel formulation for carbon coating the LFP, spray dry it and test the assembled battery performance.[71] They use chemicals to reduce the graphene particle size (to undisclosed size). Due to the lack of spray drying informations and methodology, it is unknown whether the battery performance can be attributed to the novel formulation or drying conditions. It is relevant to experiment whenever is possible to grind the graphene along with LFP during the wet ball milling, spray dry it and test the material properties. This would eliminate the pyrolysis step during manufacture, to limit costs and particle sintering. The PSD of spray dried LiFePO4 increases during the pyrolysis step for the carbon coating, as the particles
sinter together. An increase in the carbon content limits the sinter growth. An excess of carbon limits the Li+diffusion, blocks the pores and lowers the amount of LFP in the battery.
Pyrolysis at 600◦C for 10 h with a 4 % remaining carbon, optimizes the battery capacity.[72]
Another methodology to limit particle sintering is to increase the porosity. Mesoporosity increases surface area for Li+ intercalation, but macroporosity wastes space as it creates a
low density particle. Hollow morphology is a result of too rapid drying rates[73] as a result, Li+ takes more time to diffuse.[74] With an hollow structure the material loses 20 % of the
capacity by increasing the discharge current C-rate from 0.2C to 1C. Commercial batteries have 5 % loss.
Cycling stability is also known to be dependent on the synthesis conditions, and pouch-cells batteries would demonstrate the material performance in more realistic conditions. In fact, there are several mechanisms related to capacity loss of coin-cells batteries over cycling, including loss of Li due to side reactions, dendrite formation,[75] materials dissolution,[14] acidic side reactions,[76] and losing active materials due to particle cracking.[77, 78] In order to conclude which ones are involved, further post-mortem characterization would be neces-sary. A pouch-cell tests more active material (grams) and is assembled in a machine, with a standardized procedure; pouch-cells are also one of the main standards in industry for cell-pack assembly.
2.4 Surfactant
Nanoparticle suspensions tend to agglomerate and sediment overtime. To counteract this phenomena, a surfactant stabilizes the system, coating each solid particle at the interface. The resulting dipole moment polarizes the surface with the same charge and repels each particle by electrostatic repulsion.[79] The choice of surfactant is particularly important at the micronization stage, in fact a suitable formulation has been developed using 0.8 % Tween-20 R.[15] During the atomization stage in spray drying, the surfactant reduces the surface
tension of water, creating smaller droplets.
2.5 Nozzles
All Li-ion batteries are built using the thin-film application: the gap between the electrodes is generally 200 µm to 400 µm.[80] The thickness of the cathode is 60 µm.[81] This aspect de-mands the formulation of a dried particle as small as possible, to maximize packing efficiency.
2.5.1 Pressure jet
The jet forms from a single fluid nozzle where the suspension is heavily compressed and forced through a tiny orifice. The difference in pressure sets the liquid in motion at high speed, while the impact with the surrounding air, breaks the jet into finer and finer droplets.[82] Although it is the least expensive to operate (by eliminating the need of compressed air for atomization), it requires a huge pressure to achieve a fine droplet atomization (1000 bar for a 20 µm droplet). Therefore, this nozzle is impractical for laboratory use, but is best suited

![Figure 2.5 Control volume and transport terms for the spray dryer energy balance.[5]](https://thumb-eu.123doks.com/thumbv2/123doknet/2346165.34902/37.918.240.673.735.1010/figure-control-volume-transport-terms-spray-energy-balance.webp)