HAL Id: hal-00781689
https://hal.inria.fr/hal-00781689
Submitted on 28 Jan 2013HAL is a multi-disciplinary open access archive for the deposit and dissemination of sci-entific research documents, whether they are pub-lished or not. The documents may come from
L’archive ouverte pluridisciplinaire HAL, est destinée au dépôt et à la diffusion de documents scientifiques de niveau recherche, publiés ou non, émanant des établissements d’enseignement et de
Automatic building extraction from DEMs using an
object approach and application to the 3D-city modeling
Florent Lafarge, Xavier Descombes, Josiane Zerubia, Marc Pierrot-Deseilligny
To cite this version:
Florent Lafarge, Xavier Descombes, Josiane Zerubia, Marc Pierrot-Deseilligny. Automatic build-ing extraction from DEMs usbuild-ing an object approach and application to the 3D-city model-ing. ISPRS Journal of Photogrammetry and Remote Sensing, Elsevier, 2008, 63 (3), pp.365-381. �10.1016/j.isprsjprs.2007.09.003�. �hal-00781689�
Automatic Building Extraction from DEMs
using an Object Approach and Application to
the 3D-city Modeling
Florent Lafarge
a,bXavier Descombes
aJosiane Zerubia
aMarc Pierrot-Deseilligny
b aAriana Research Group - INRIA/I3S 2004, routes des Lucioles, BP93 06902 Sophia Antipolis, Cedex, France
b
French Mapping Agency (IGN) 2/4 avenue Pasteur
94165 Saint-Mand´e, Cedex, France
Abstract
In this paper, we present an automatic building extraction method based on an object approach from Digital Elevation Models. First, a rough approximation of the building footprints is realized by a method based on marked point processes: the building footprints are modeled by rectangle layouts. Then, these rectangular footprints are regularized by improving the connection between the neighboring rectangles and detecting the roof height discontinuities. The obtained building foot-prints are structured footfoot-prints: each element represents a specific part of an urban structure. Results are finally applied to a 3D-city modeling process.
Model, 3D-reconstruction, dense urban areas, marked point processes, RJMCMC
1 Introduction
Three dimensional models of urban areas are very useful for many kinds of applications. Urban planning, radiowave reachability tests for wireless commu-nications, disaster recovery or creation of virtual realities require to be able to automatically build 3D-models with connected planar facets of towns. However the 3D building reconstruction is a difficult problem, mainly due to the complexity of the scenes. Urban environments are very dense and com-posed of many types of buildings. Therefore, it makes their analysis difficult.
Many methods have been developed in various contexts which depend on the automaticity of the methods and the kind of data. (Flamanc and Maillet, 2005) and (Gruen and Wang, 1998) propose semi-automatic processes which require human operator interventions. However, the 3D building reconstruc-tion demands automaticity which is the case of the methods menreconstruc-tioned be-low. In (Lin and Nevatia, 1998), the input is a single view image - build-ing shadows are used to extract 3D information. Multiple view aerial images are the most common input. Such data are rich in terms of 3D information and allow to extract 3D primitives. For example, (Scholze et al., 2002) and (Kim and Nevatia, 2004) use 3D lines in their 3D reconstruction methods. In (Jibrini et al., 2000), planes are extracted and then arranged in a polyhedral approach. (Baillard and Zisserman, 2000) and (Taillandier and Deriche, 2004) propose generic models by combining several kinds of primitives. Laser scan-ning is also very popular since the decrease of the acquisition cost and the
accuracy of the measures. Some interesting models have been proposed us-ing laser data such as (Maas and Vosselman, 1999; Haala and Brenner, 1999; Fr¨uh and Zakhor, 2003). Several methods, such as (Vinson and Cohen, 2002; Weidner and F¨orstner, 1995), are based on Digital Elevation Models (DEMs). The use of DEMs is motivated by the fact that they already provide a geo-metric description of a scene from aerial imagery or airborne scanner data.
Nowadays, this problem can be tackled by another type of data: the sub-metric satellite images. The future PLEIADES satellites are especially well adapted to deal with 3D building reconstruction through the high resolution of images (0.7 meter) and the stereoscopic characteristics (three views -B/H=0.2). The main advantages of satellite data compared to aerial images are a high swath width and ground coverage. However, such data have a “rel-atively low” resolution and a “low” Signal to Noise Ratio (SNR) to deal with 3D reconstruction problems compared to aerial data. For example, PLEIADES simulations have 2 pixels per square meter density contrary to aerial images used in (Taillandier and Deriche, 2004) or (Fuchs and Le Men, 2000) which have about 25 pixels per square meter. In this paper, we aim at automati-cally extracting buildings by exploiting satellite images, and more precisely PLEIADES simulations.
A robust process is necessary to face up the ”low” quality of such data. Ba-sic 3D-primitive extraction is not especially adapted to our data quality. For instance, the 3D-segment extraction by using (Taillandier and Deriche, 2002) does not provide convincing results. This context leads us to propose a method based on important prior knowledge concerning urban structures. An object approach is well adapted since it allows the introduction of prior knowledge on
the object layout. Most of the methods using such an approach need building localization masks in order to initialize the footprint extraction algorithm, as for example active contours based methods in (Oriot, 2003; Bailloeul et al., 2005).
We propose an object approach which does not need localization informa-tion and only use a single input well adapted to geometric descripinforma-tion: a DEM. DEMS are generated from 3-view satellite images (more precisely from
PLEIADES simulations) by an algorithm detailed in (Pierrot-Deseilligny and Paparoditis, 2006) and based on a multi-resolution implementation of a Cox and Roy
op-timal flow matching image algorithm (Roy and Cox, 1998). PLEIADES sim-ulations were derived from aerial images which have been degraded by the French Space Agency, taking into account various PLEIADES satellite char-acteristics such as the image resolution and the SNR. In this paper, an approx-imation of the global shape of buildings is first extracted by a method based on marked point processes: the building footprints are modeled by rectangle layouts. Then, these rectangular building footprints initiate a process leading to a polygonal description of the footprints while detecting the roof height dis-continuities. The obtained building footprints are structured footprints: each element represents a specific part of an urban structure. Then, these results drive a 3D-city modeling process.
2 Rectangular approximation of the building footprints by marked point processes
The first step consists in extracting a rough description of the global shape of buildings. High density of urban areas and complexity of human made objects make the building extraction process difficult to achieve. We aim at developing an automatic method which is robust with respect to the DEM noise and does not need building localization maps or initialization states. To do so, a rectangular footprint extraction algorithm based on marked point processes is used (Ortner, 2004; Ortner et al., 2007).
2.1 Principle
This method is based on an object approach: it provides rectangle layouts which represent the building footprints. Faced with the complexity and the diversity of the building forms, such an approach is well adapted since it pro-vides a modeling by simple geometric objects (i.e rectangles) and allows the introduction of a prior knowledge concerning the object layout and doesn’t need any initialization. An energy is associated to each configuration. The global minimum of this energy is then found by applying a Reversible Jump Markov Chain Monte Carlo (RJMCMC) sampler embedded into a simulated annealing scheme (Green, 1995).
2.2 Marked point process
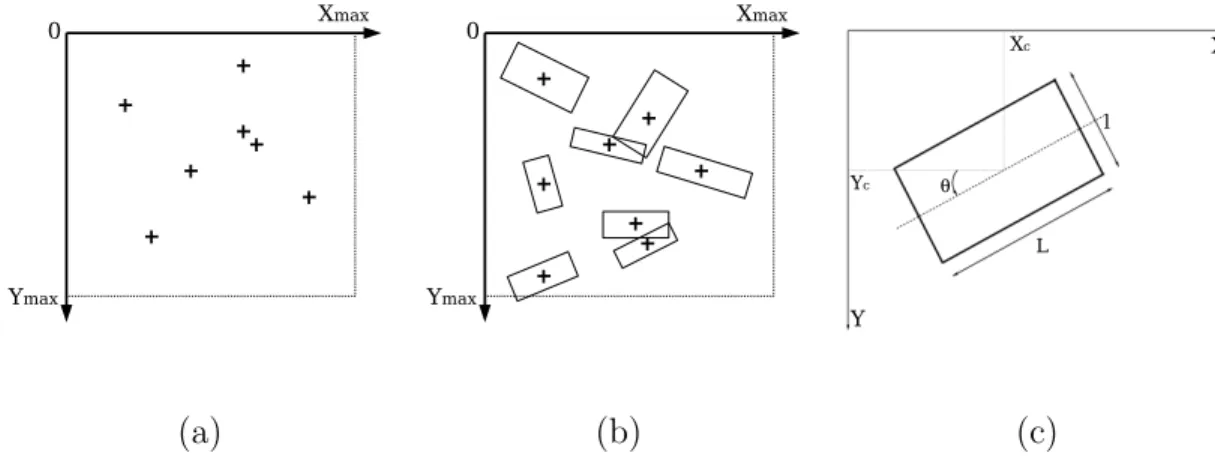
Let us consider a point process X living in K = [0, Xmax] × [0, Ymax] which
represents an image. X is a measurable mapping from a probability space (Ω, A, P) to configurations of points of K:
∀ω ∈ Ω, xi ∈ K, X(ω) = {x1, ..., xn} (1)
A marked point process in S = K × M is a point process where each point is associated with a mark which allows to define an object. M is the mark space which allows, in our case, to describe random configurations of rectangles:
M = [−π 2,
π
2] × [Lmin, Lmax] × [lmin, lmax] (2)
We denote C the set of all finite configurations of objects of S. Fig. 1-(c) shows an element of S. Fig. 1-(a)&(b) represents a realization of a point process in K and a realization of a marked point process in S. More details on point processes and their applications can be found in (Van Lieshout, 2000).
(a) (b) (c)
Fig. 1. A realization of a point process in K (a), a realization of a marked point process in S (b), an element of S - (Xc, Yc) ∈ K, the center of the rectangle
2.3 Density formulation
We consider a marked point process X defined by an unnormalized density h(.) from C to R and a reference intensity measure ν (defining a reference Poisson point process distribution).
The unnormalized density h(.) derives from three energies presented in the fol-lowing. More details concerning these energy terms can be found in (Ortner et al., 2007; Ortner, 2004).
For a configuration x ∈ C, the density is given by:
h(x) = exp − [Uext(x) + Uint(x) + Uexcl(x)] (3)
2.3.1 External energy Uext
This term measures the quality of a configuration given the data, i.e. the DEM. It can be decomposed as a sum of energies Ud(.) per object such as
Uext(x) =Pu∈xUd(u).
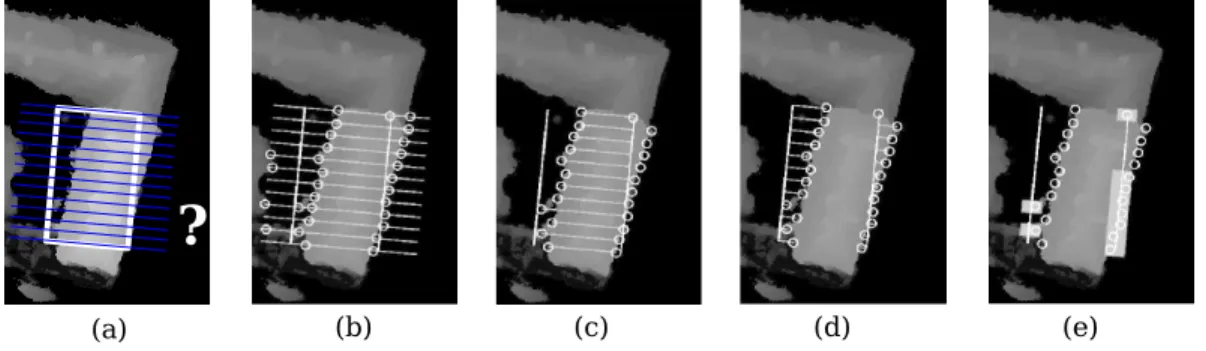
For each object u ∈ x, a local data energy Ud(u) is computed by using a
method which compares the DEM discontinuities to the borders of the object. Fig. 2-(a) shows a part of a DEM , a rectangle (in white) and slices evenly disposed. We aim at extracting some points of interest from each slice and checking the coherence between these points and the rectangular shape of the object. Points of interest are detected using a profile simplification algorithm detailed in (Ortner et al., 2003) - they represent DEM discontinuities on the slices (see Fig. 2-(b)). Then, three criteria of coherence are used to compute Ud(u). The first criterion measures a volume rate (see Fig. 2-(c) - grey lines
corre-sponds to a moment rate (see Fig. 2-(d) - grey lines represent segments used to compute the moment rate). Eventually, the third criterion measures a lo-calization rate (see Fig. 2-(e) - a gradient is boxed if it is close enough to the corresponding rectangle side).
Fig. 2. External energy: a part of a DEM with a proposed rectangle (in white) and its slices (a), detected points of interest (b), volume rate (c), moment rate (d), localization rate (e).
2.3.2 Internal energy Uint
The internal energy Uint(x) allows to give a particular spatial structure to
the configuration x. It can be seen as a regularizing term composed of three kinds of interactions between objects which favor alignment between rectan-gles, completion and some paving behavior. Fig. 3 represents these three types of interactions.
2.3.3 Exclusion energy Uexcl
This term avoids redundant objects by penalizing the intersection of paral-lel rectangles. Such an exclusion energy allows to ensure that the attractive interactions do not provoke object accumulations.
Fig. 3. Internal energy: alignment interaction (a), paving interaction (b), comple-tion interaccomple-tion (c).
2.4 Optimization
Once the model is defined, we want to find the configuration maximizing the density h(.). We search for the Maximum A Posteriori (MAP) estimator xM AP:
xM AP = arg max
x h(x) (4)
This is a non convex optimization problem in a high and variable dimension space C. A Reversible Jump Monte Carlo Markov Chain sampler (Geyer and Moller, 1994; Green, 1995; Van Lieshout, 2000) embedded in a simulated annealing scheme is particularly well adapted to this problem.
2.4.1 RJMCMC
It consists in simulating a discrete Markov Chain (Xt)t∈Non C, having π as an
invariant measure (specified by the density h(.)), which performs small jumps between spaces of variable dimensions. One of the main advantages of such a sampler is that the chain asymptotically converges towards π for any initial configuration X0. It means that the initialization steps or building localization
masks are not needed. The transitions of this chain are managed by some proposition kernels (denoted Qi), which are moves (or jumps) proposed from
the current configuration.
The RJMCMC algorithm is described below: Algorithm 1 .
At iteration k, with Xk= xk:
• Choose uniformly one of the proposition kernels Qi(xk, .).
• According to Qi, propose a new state y.
• Compute the acceptance ratio of this move αi(xk, y) = min π(y)Qi(y, xk) π(xk)Qi(xk, y) ,1 ! (5) • take Xk+1 = y with probability αi(xk, y), and Xk+1 = xk otherwise.
2.4.2 Proposition kernels
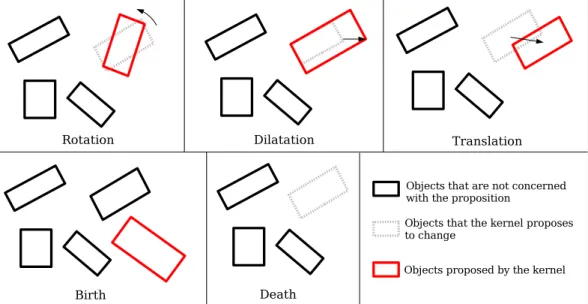
The proposition kernels allow to define the transformations applied to objects in the current configuration. The kernels we used are birth, death, rotation, dilatation and translation (see Fig. 4). Birth and death kernels allow to respec-tively add / remove an object from / in the current configuration. These two transformations, which correspond to jumps in spaces of higher (birth) / lower (death) dimension, guaranty that the Markov chain visit the whole configura-tion space. However, it is important to define relevant moves in order to speed up the convergence of the Markov chain. That is why we introduce other moves (rotation, dilatation and translation) which correspond to perturbations of the current configuration (i.e. without jumping in a space of different dimension). The computation of these kernels are specified in (Ortner et al., 2007).
Fig. 4. Mixture of the kernels.
2.4.3 Simulated annealing
In practice, the RJMCMC sampler is embedded into a simulated annealing scheme: the density h(.)Dt1 is substituted to h(.) where D
t is a sequence of
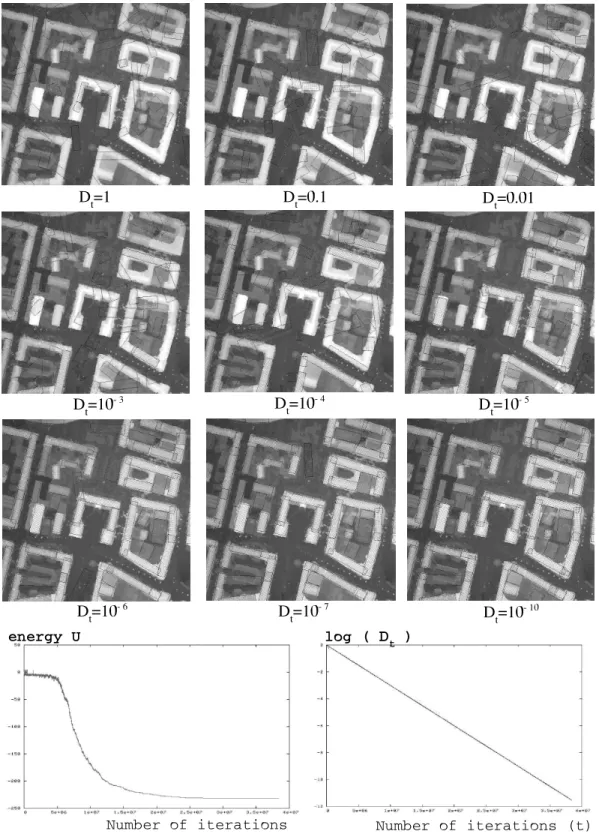
temperatures which tends to zero as t tends to infinity. At the beginning of the algorithm (i.e. when the temperature is high), the process is not really selective: it allows to explore the density modes. When the temperature de-creases, configurations which have a high density are favored. Fig. 5 shows an example of this optimization process.
The simulated annealing theoretically ensures the converge to the global op-timum for any initial configuration x0 by using a logarithmic temperature
decrease (see (Salamon et al., 2002)). In practice, we prefer to use faster de-creases which provide an approximate solution close to the optimal one. More precisely, we use a geometrical decrease, detailed in (Van Laarhoven and Aarts, 1987), and defined as follows:
where α < 1 and close to 1 and D0 is the initial temperature. In practice,
we take α = 0.99999. The initial and ending temperatures D0 and Df inal are
estimated through the variations of the energy by (White, 1984).
2.5 Comments
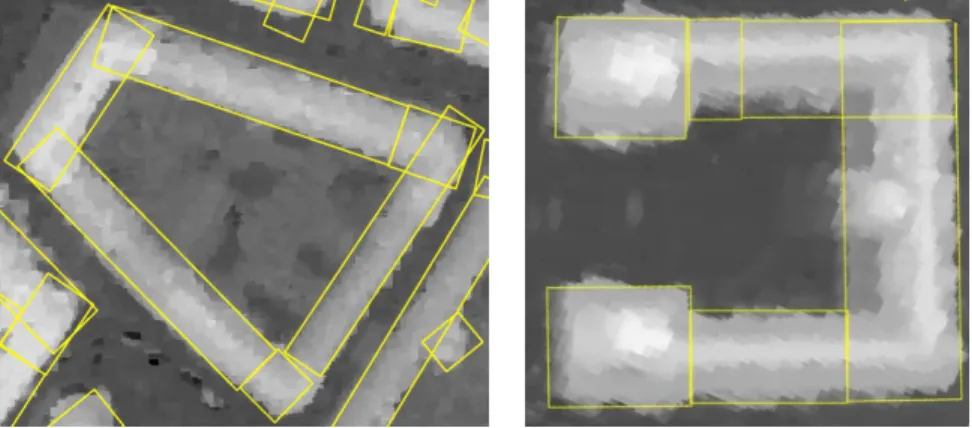
Fig. 6 presents two results from PLEIADES simulations on buildings of the city of Amiens (France). The results are satisfactory considering a satellite and automatic context. However, applying directly a 3D reconstruction pro-cess from these rectangular building footprints engenders artifacts in the 3D-results as it is shown in (Lafarge et al., 2006a). These artifacts are mainly due to non optimal connections between neighboring rectangles (see Fig. 7). The proposed approach is fully automatic but requires heavy computation. To reduce the computation time, we had proposed to only estimate a caricature of the building footprints consisting of a collection of rectangles. To reach a 3D reconstruction, these rectangle layouts need to be regularized, especially the linking up between neighboring rectangles. We address this problem in the following section.
3 Regularization: towards structured footprints
The rectangle layouts are regularized by improving firstly the connections between neighboring rectangles (through a local fusion of rectangles) and, secondly, the position of facades (through a roof height discontinuity detec-tion). At the end, we obtain structured building footprints whose elements are
Fig. 5. Example of the optimization process - Evolution of the configuration (top) associated with the energy decrease and temperature decrease schemes (bottom).
Fig. 6. Examples of building extraction results.
Fig. 7. Examples of non optimal connections between neighboring rectangles. correctly connected: each one represents a specific part of an urban structure.
3.1 Connection between neighboring rectangles
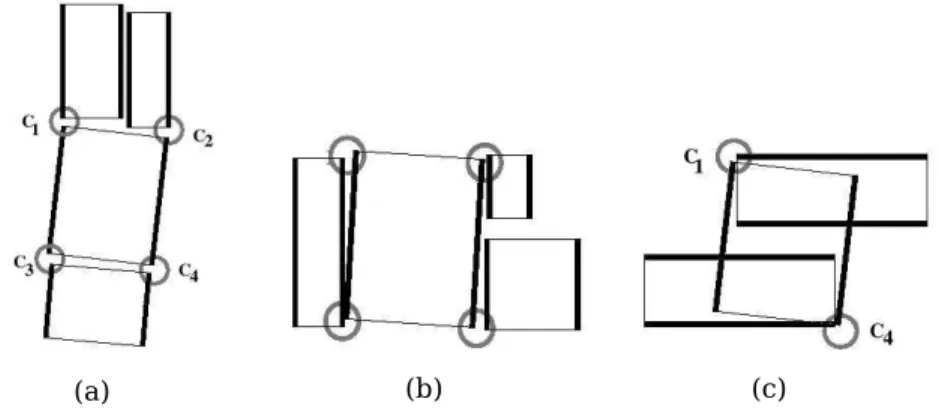
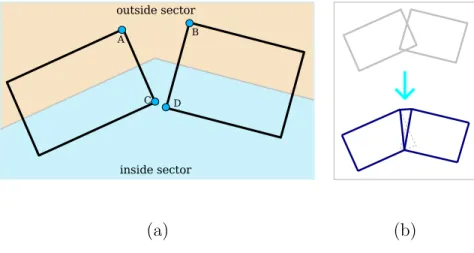
We aim at improving the connection between neighboring rectangles. Fig. 8-(a) represents a typical configuration of two neighboring rectangles that we want to connect.
Generalizing 3D volumes, such as in (Kada, 2006), could allow to improve the linking up between neighboring rectangles, nevertheless some building details would be lost. Applying small perturbations on the rectangle parameters could improve the connection. However, such a method cannot be used since the information related to the general layout of rectangles will be lost. The chosen
solution consists in merging the neighboring rectangles, i.e. morphing two rectangles into polygons which are perfectly connected as we can see on Fig. 8-(b).
(a) (b)
Fig. 8. Two neighboring rectangles (a), example of a fusion (b).
3.1.1 Fusion
We aim at merging two neighboring rectangles (R1, R2), which means that we
search for connecting both points A and B (outside sector), and points C and D (inside sector) of Fig. 8-(a) in order to create polygons (Pi)i∈N⋆ which are
perfectly connected (see Fig. 8-(b)).
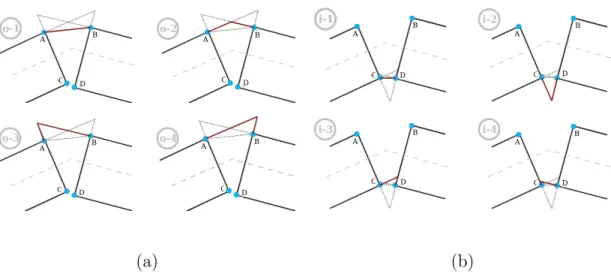
It exists many relative positions of two neighboring rectangles which depend on the width of the rectangles, their orientation and their distance. Faced with the high number of possibilities, an exhaustive description of all the fu-sion configurations will be very heavy. We have chosen to restrict the number of possibilities to 16 fusion configurations.
the connection between point A and point B). These configurations are based on intersections of straight lines defined by the width and length of rectangles. Concerning the inside sector (i.e the connection between point C and point D), the 4 same configurations are allowed (see Fig. 9-(b)). Eventually, 16 fusion configurations are proposed. They allow to describe a large range of the most realistic cases. Fig. 10 shows a fusion configuration in three different rectangle relative positions.
(a) (b)
Fig. 9. The 4 connection configurations of the outside sector (a), the 4 connection configurations of the inside sector (b).
Fig. 10. A fusion configuration (o-3 ”outside sector - configuration 3”/ i-3 ”inside sector - configuration 3”) in three different rectangle relative positions.
3.1.2 Cost function
In order to select the most adapted fusion configuration, we define a cost function which measures the coherence between the proposed configuration and the data represented by both the DEM and the two initial rectangles. This cost is composed of three terms:
C = CDEM + ω1Crecovering+ ω2Ccontour (7)
where ω1 and ω2 represent weights which are tuned by trial and error. In
practice, we choose ω1 = 0.5 and ω2 = 0.8. These values are stable for all scenes
and various ranges of DEMs since they weight geometric criterion related to rectangle layouts provided by the same algorithm.
3.1.2.1 DEM cost The DEM term allows to define the quality of the pro-posed configuration, given the DEM. To do so, we estimate the rate of high Z values which are inside the proposed footprint (i.e. pixels which correspond to pieces of building). The higher the rate, the lower the cost. The high in-tensity pixels are detected by thresholding: the threshold value corresponds to half a floor height with respect to the ground altitude. Let us consider N, the number of these high intensity pixels inside the proposed footprint, and Nt, the area of the footprint (i.e. the total number of pixels). Then, the DEM
cost can be written as follows:
CDEM = 1 −
N Nt
(8)
3.1.2.2 Recovering cost This term provides a area criterion: it corre-sponds to the recovering rate between the proposed configuration and the two
rectangles. Let us consider R1 and R2, the two initial rectangles, and P , the
union of polygons defined by the proposed fusion. Then, the recovering term is given by:
Crecovering =
| Area(P ) − Area(R1 ∪ R2) |
Area(R1 ∪ R2) (9)
For example, the configuration of Fig. 10-(b) is favored (in term of recovering cost) contrary to the one of Fig. 10-(a).
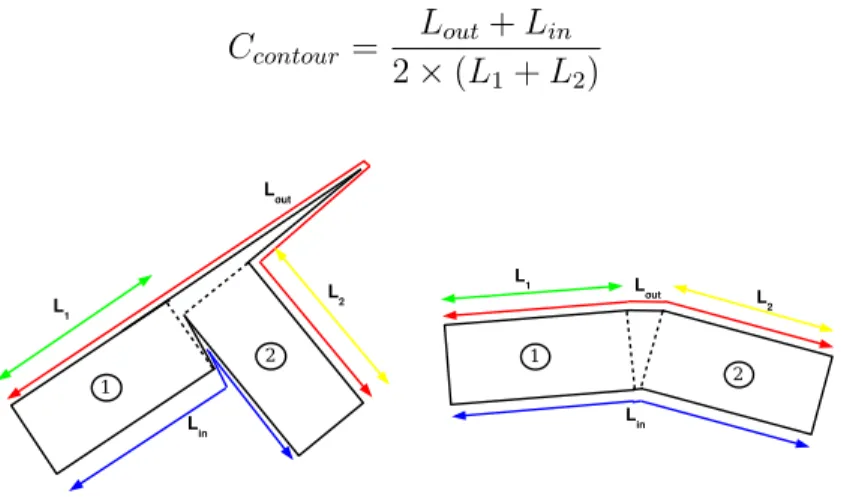
3.1.2.3 Contour cost This term allows to estimate the contour coherence between the proposed configuration and the two initial rectangles. This cost penalizes complex fusions as we can see on Fig. 11. Let us consider Lin
(re-spectively Lout), the total length of the inside sector polygons P (respectively
outside sector) and L1 and L2, the length of the two rectangles. The contour
cost is defined as follows:
Ccontour =
Lout+ Lin
2 × (L1 + L2)
(10)
Fig. 11. Contour cost: configuration penalized by the contour cost (left), favored configuration (right).
3.1.3 Algorithm
Rectangular footprints are morphed into polygonal footprints whose elements are perfectly connected. To do so, the fusion process between two rectangles
is applied for each couple of neighboring rectangles which are positioned in se-ries (a rectangle is positioned in sese-ries if it has at most two neighbors). These fusions ”in series” are well adapted to these rectangle layouts since a large majority of rectangles is positioned in series. It is due to the internal field of the rectangular footprint extraction method (see section 2.3.2) which allows to regularize the rectangles, and especially favors their alignments.
The algorithm consists in merging all the neighboring rectangles which are po-sitioned ”in series”. However, some buildings owning complex junctions can-not be considered as a single sequence of quadrilaterals since some neighboring rectangles are positioned ”in parallel” as we can see in Fig. 12. In this case, the result corresponds to several sequences of quadrilaterals where the main sequence is realized by considering the longest train of fusions (i.e. the longest sequence of rectangles).
Fig. 12. Building footprints represented by a single sequence of rectangles (left) -Building footprints represented by two sequences of quadrilaterals (right).
Consequently, instead of considering parts of buildings represented by rect-angles, we work on complete buildings. Each building b is associated with a set of connected polygons Pb. Fig. 13 presents the result from the rectangular
footprints of Fig. 6 (left). This result is satisfactory: the artifacts of rectangle connections have disappeared.
Fig. 13. Rectangular footprints (left), footprints with fusion of rectangles (right).
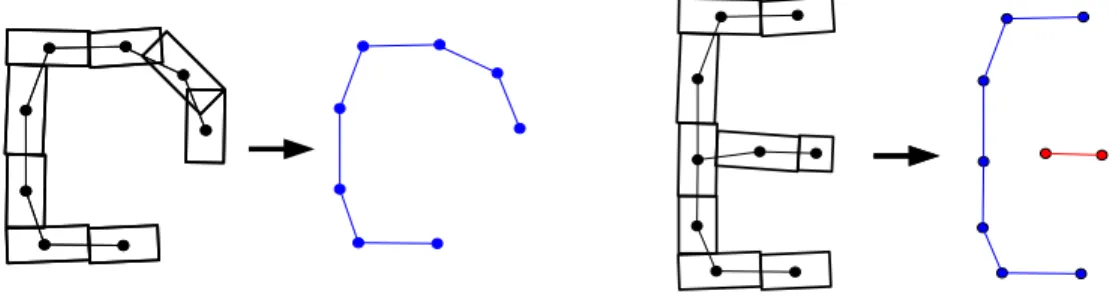
3.2 Roof height discontinuity detection
The second improvement consists in detecting the roof height discontinuities in the building footprints. In fact, several roof heights can exist inside a foot-print as we can see in Fig. 14-(a).
To do so, a rooftop profile is computed for each footprint (see Fig. 14-(b)). This profile is obtained by estimating the average roof height (i.e. Z) in a slid-ing window. Then, the high gradients are detected by applyslid-ing a thresholdslid-ing on the profile derivative (see Fig. 14-(c)). The threshold is a parameter which has been set up to 3 (this value corresponds to the Z-variation / X-variation ratio) w.r.t. a reference building containing various roof height discontinuities of one floor height. Finally, the selected gradients are accumulated (Fig. 14-(d)) in order to obtain the roof height discontinuities presented on Fig. 14-(e). Fig. 15 shows the result from the footprints of Fig. 6. This result represents ”structured building footprints” since each element represents a specific part of an urban structure.
Fig. 14. Roof height discontinuity detection : initial footprint (a), rooftop profile (b), gradient selection (c), gradient accumulation (d), resulted footprint with roof height discontinuities (e).
4 Results
Two sets of parameters exist. They correspond to weights which respectively tune energy terms of the global shape extraction step (equation 3) and cost function terms of the regularizing step (equation 7). They are chosen by trial and error. The calibration of these parameters is made for a range of DEMs. In the future, it could be interesting to work on the estimation of these pa-rameters in order to have a fully-automatic process.
Fig. 15. Building footprints with roof height discontinuities.
Fig. 16, 17 and 18 show results of structured building footprints (c) associated with PLEIADES simulations (a) and the rectangular footprints (b). These results are satisfactory since the footprints are now regularized: rectangle con-nections have been improved and roof height discontinuities have successfully been detected.
Fig. 19 represents the error maps. The True Negative (TN) rate is quite high (15.3%). However, TN mainly correspond to low flat buildings of inner court-yards (no more than two floor height) that the proposed method cannot detect since these buildings have low DEM discontinuities. Without taking into ac-count these low flat buildings, the TN rate is 4.5%. The False Positive (FP) rate is satisfactory with respect to the satellite context (9.7%). This rate can be improved by introducing a vegetation mask in the process in order to pre-vent the detection of trees (see Fig. 16). The error rates are detailed in Tab. 1. The computing time is quite high. For example, 3 hours are necessary to obtain the result of Fig. 17 with a Pentium IV-3Ghz. It is due to the use of a RJMCMC sampler which is a quite heavy stochastic optimization process.
(a) (b)
(c)
Fig. 16. PLEIADES simulation on a piece of Amiens (a), rectangular building foot-prints (b), structured building footfoot-prints (c).
(a) (b)
(c) Fig. 17. PLEIADES simulation on Amiens downtown (a), rectangular building foot-prints (b), structured building footfoot-prints (c).
(a) (b)
(c)
Fig. 18. PLEIADES simulation on a piece of Amiens (a), rectangular building foot-prints (b), structured building footfoot-prints (c).
False Positive True Negative
(white) low flat buildings (dark grey) other (black)
Area 1 11.6% 8.1% 5.4% (Fig. 19-a) Area 2 7.9% 14.3% 2.9% (Fig. 19-b) Area 3 9% 11.3% 4.6% (Fig. 19-c) Table 1 Table of errors
5 Application to 3D-city modeling
This section presents an application of the previous results: the 3D-city mod-eling. The structured building footprints provide useful knowledge concerning the localization of buildings, the change of rooftop direction and the roof height discontinuities. It means that these footprints help to do the 3D inter-pretation of the scenes. We propose a simple 3D-reconstruction process using these structured footprints. It is based on a parametric approach which has been chosen since it is particularly robust. However, this approach deals with restricted 3D-models.
Fig. 19. Evaluation maps of Fig. 16, 17 and 18 (respectively (a)&(b)&(c)). 5.1 Skeleton process of the footprints
The proposed parametric method is based on a skeleton process of the struc-tured footprints which allows to model the rooftops of buildings. It is a very simple process: roofs are constrained to be symmetric two-planes. Such a pro-cess has been used in (Haala and Brenner, 1998; Flamanc and Maillet, 2005) for instance. In other words, for each building b, we consider the median axis of the connected polygon set Pb as the rooftops. The roof forms are
fully determined by the structured building footprints: it allows to reduce the computing time compared to other approaches such as (Lafarge et al., 2006a;
Jibrini et al., 2000; Taillandier and Deriche, 2004).
5.2 Setting of the building heights
The different heights of buildings constitute the parameters of the model. For each polygon of Pb, a roof gutter height and a rooftop height are estimated by
a method developed in a previous work (Lafarge et al., 2005). These heights are then regularized on all the building b by using the ”K-means” algorithm including a regularizing term. A similar algorithm using an entropic term has been proposed in (Palubinskas et al., 1998). The advantage of such an algo-rithm is that the number of classes does not need to be known a priori. It allows to favor the rooftop continuity and reduces the presence of artifacts.
Let us consider a set of N connected polygons Pb representing the footprint of
a building b (see, for example, Fig. 13) and Hgi, the estimated height of the
roof gutter of the ithpolygons (i ∈ [1, N]). The proposed ”K-means” algorithm
including a regularizing term consists in searching for cj, the centroid of the
jth class, which minimizes the criterion J defined as follows:
J = C X j=1 N X i=1 d2 (Hgi, cj) − αC (11)
where C represents the number of classes (which is unknown).
The criterion J is composed of two terms. The first one corresponds to the clas-sical criterion of the ”K-means” algorithm. The second one, which is weighted by the parameter α ∈ R+⋆, represents a priori knowledge on the classes. This
with its centroid cj which represents the final regularized height of the roof
gutter. The parameter α is tuned by trial and error for a range of DEMs (in our case, we choose α = 100). If the value of α decreases, models will have a bad regularization. On the contrary, if α is too high, the roof height disconti-nuities will disappear. The same process is applied for the rooftop heights.
Fig. 20 presents examples of a reconstructed building. The first one (a) is obtained without regularizing building heights: we can see the presence of ar-tifacts through the bad adjustments of the rooftop heights and roof gutter heights. The second building (b) is regularized.
(a) (b)
5.3 Results
Fig. 21 presents an example of building 3D-reconstruction (a) associated with the structured building footprints (b) and the 3D-ground truth (c). This result is satisfactory compared to the 3D-ground truth. The proposed modeling does not allow to represent some details. However, the global shape is respected and the generalization level is acceptable for satellite data in an automatic context. Fig. 22 shows the 3D-results on three Amiens areas used in section 4. These results are satisfactory compared to the associated 3D-ground truths which can be found in (Lafarge et al., 2006b) and have been semi-automatically es-tablished by the French Mapping Agency (IGN) from aerial images (0.2 meter resolution) and ground maps. Even if the 3D-modeling is simple (the roof forms are constrained to be symmetric two-planes), a majority of urban struc-tures is close to reality. Moreover, these results are aesthetically satisfactory compared, for example, to results presented in (Lafarge et al., 2005). The com-puting time is negligible with respect to the footprint extraction process (11 seconds for the result presented in Fig. 22-b).
6 Conclusion
A method for the building footprint extraction has been proposed in this pa-per. This method is automatic: building localization maps or initialization states are not needed. It provides structured footprints where each element represents a specific part of a building and is perfectly connected to the neigh-boring ones. The obtained results are satisfactory and the method seems to
(a) (b) (c)
Fig. 21. 3D-result of Amiens city hall (a), structured building footprints (b), 3D-ground truth (c).
be efficient on dense urban areas using high resolution satellite data.
An extension to the 3D building reconstruction has been proposed: it gives satisfactory 3D city models. Even if this method is very simple (the roof forms are constrained to be symmetric two-planes), a majority of urban structures is close to reality and results are aesthetically correct thank to the lack of artifacts in the structured building footprints.
In the future, we should extend the roof form possibilities in order to have more realistic models. To do so, we could use a grammar of 3D-models which include more complex roof forms such as dissymmetric two-planes or gambrel roofs. Moreover, it could be interesting to work on parameter estimation in order to set a fully-automatic process.
(a)
(b)
(c)
Acknowledgments
The first author would like to thank the French Mapping Agency (IGN) and the French Space Agency (CNES) for partial financial support during his PhD. The authors thank the French Space Agency (CNES) for providing PLEIADES simulations.
References
Baillard, C., Zisserman, A., 2000. A plane-sweep strategy for the 3D recon-struction of buildings from multiple images. International Archives of Pho-togrammetry, Remote Sensing and Spatial Information Sciences 33 (Part B2), 56–62.
Bailloeul, T., Prinet, V., Serra, B., Marthon, P., 2005. Spatio-temporal prior shape constraint for level set segmentation. In: Energy Minimization Meth-ods in Computer Vision and Pattern Recognition. St. Augustine, USA, pp. 503–519.
Flamanc, D., Maillet, G., 2005. Evaluation of 3D city model production from PLEIADES HR satellite images and 2D ground maps. In: URBAN. Tempe, USA, pp. 46–51.
Fr¨uh, C., Zakhor, A., 2003. Constructing 3D city models by merging aerial and ground views. IEEE Trans. Computer Graphics and Applications 23 (6), 52–61.
Fuchs, F., Le Men, H., 2000. Efficient subgraph isomorphism with a-priori knowledge. Application to building reconstruction for cartography. Lecture Notes in Computer Science (1876).
Geyer, C., Moller, J., 1994. Simulation and likelihood inference for spatial point processes. Scandinavian Journal of Statistics Series B (21), 359–373. Green, P., 1995. Reversible Jump Markov Chains Monte Carlo computation
and Bayesian model determination. Biometrika 57, 97–109.
Gruen, A., Wang, X., 1998. CC-Modeler : a topology generator for 3D city models. ISPRS Journal of Photogrammetry and Remote Sensing 53 (5), 286–295.
Haala, N., Brenner, C., 1998. Interpretation of urban surface models using 2d building information. Computer Vision and Image Understanding 72 (2), 204–214.
Haala, N., Brenner, C., 1999. Extraction of buildings and trees in urban envi-ronments. ISPRS Journal of Photogrammetry and Remote Sensing 54 (2-3), 130–137.
Jibrini, H., Pierrot-Deseilligny, M., Paparoditis, N., Maˆıtre, H., 2000. Auto-matic building reconstruction from very high resolution aerial stereopairs using cadastral ground plans. International Archives of Photogrammetry, Remote Sensing and Spatial Information Sciences 33 (Part B2), 213–219. Kada, M., 2006. 3D building generalization based on half-space modeling.
International Archives of Photogrammetry, Remote Sensing and Spatial In-formation Sciences 36 (Part 2/w40), 58–64.
Kim, Z., Nevatia, R., 2004. Automatic description of complex buildings from multiple images. Computer Vision and Image Understanding 96 (1), 60–95. Lafarge, F., Descombes, X., Zerubia, J., Pierrot-Deseilligny, M., 2005. A para-metric model for automatic 3D building reconstruction from high resolution satellite images. Research Report 5687, INRIA, France.
Lafarge, F., Descombes, X., Zerubia, J., Pierrot-Deseilligny, M., October 2006a. An automatic building reconstruction method : A structural
ap-proach using high resolution images. In: Proc. IEEE International Confer-ence on Image Processing. Atlanta, USA, pp. 1205–1208.
Lafarge, F., Trontin, P., Descombes, X., Zerubia, J., Pierrot-Deseilligny, M., 2006b. An automatic building extraction method : Application to the 3D-city modeling. Research Report 5925, INRIA, France.
Lin, C., Nevatia, R., 1998. Building detection and description from a single intensity image. Computer Vision and Image Understanding 72 (2), 101– 121.
Maas, H., Vosselman, G., 1999. Two algorithms for extracting building mod-els from raw laser altimetry data. ISPRS Journal of Photogrammetry and Remote Sensing 54 (2-3), 153–163.
Oriot, H., 2003. Statistical snakes for building extraction from stereoscopic aerial images. International Archives of Photogrammetry, Remote Sensing and Spatial Information Sciences 34 (Part 3/W8), 65–70.
Ortner, M., 2004. Processus ponctuels marqu´es pour l’extraction automatique de caricatures de bˆatiments `a partir de mod`eles num´eriques d’´el´evation. Ph.D. thesis, University of Nice-Sophia Antipolis.
Ortner, M., Descombes, X., Zerubia, J., 2003. Automatic 3D land register extraction from altimetric data in dense urban areas. Research Report 4919, INRIA, France.
Ortner, M., Descombes, X., Zerubia, J., 2007. Building outline extraction from Digital Elevation Models using marked point processes. International Jour-nal of Computer Vision 72 (2), 107–132.
Palubinskas, G., Descombes, X., Kruggel, F., August 1998. An unsupervised clustering method using the entropy minimization. In: Proc. International Conference on Pattern Recognition. Brisbane, Australia, pp. 1816–1818. Pierrot-Deseilligny, M., Paparoditis, N., 2006. A multiresolution and
optimization-based image matching approach : an application to surface reconstruction from SPOT5-HRS stereo imagery. International Archives of Photogrammetry, Remote Sensing and Spatial Information Sciences 36 (part 1/w41), 73–77.
Roy, S., Cox, I., 1998. A maximum-flow formulation of the n-camera stereo correspondence problem. In: Proc. International Conference on Computer Vision. Bombay, pp. 492–499.
Salamon, P., Sibani, P., Frost, R., 2002. Facts, conjectures, and improvements for simulated annealing. SIAM Monographs on Mathematical Modeling and Computation. Society for Industrial and Applied Mathematics, Philadel-phia.
Scholze, S., Moons, T., Gool, L. J. V., 2002. A probabilistic approach to build-ing roof reconstruction usbuild-ing semantic labellbuild-ing. In: Proceedbuild-ings of the 24th DAGM Symposium on Pattern Recognition. Springer-Verlag, London, UK, pp. 257–264.
Taillandier, F., Deriche, R., 2002. Reconstruction of 3d linear primitives from multiple views for urban areas modelisation. International Archives of Pho-togrammetry, Remote Sensing and Spatial Information Sciences 34 (Part 3B), 267–272.
Taillandier, F., Deriche, R., 2004. Automatic Builings Reconstruction from Aerial Images : a Generic Bayesian Framework. International Archives of Photogrammetry, Remote Sensing and Spatial Information Sciences 35 (Part B3).
Van Laarhoven, P., Aarts, E., 1987. Simulated Annealing : Theory and Appli-cations. D. Reidel, Boston.
Van Lieshout, M., 2000. Markov point processes and their applications. In: Imperial College Press. London.
Vinson, S., Cohen, L., 2002. Multiple rectangle model for buildings segmen-tation and 3D scene reconstruction. In: Proc. International Conference on Pattern Recognition. Quebec, Canada, pp. 623–626.
Weidner, U., F¨orstner, W., 1995. Towards Automatic Building Reconstruction from High Resolution Digital Elevation Models. Journal of Photogrammetry and Remote Sensing 50(4), 38–49.
White, S., 1984. Concepts of scale in simulated annealing. In: IEEE Proc. of International Conference on Computer Design. Port Chester, pp. 646–651.