Nephrol Dial Transplant (1996) 11: 109-116
Original Article
Nephrology
Dialysis
Transplantation
Haemodialysis activates phospholipase A
2enzyme
B. S. Vishwanath
1, C. A. Fux
1, D. E. Uehlinger
1, B. M. Frey
1, R. C. Franson
2and F. J. Frey
1 'Division of Nephrology, Department of Medicine, Inselspital, University of Berne, Switzerland, department ofBiochemistry and Molecular Biophysics, Medical College of Virginia, Virginia Commonwealth University, Richmond, USA
Abstract
Background. Clinical and experimental evidence
suggest that haemodialysis (HD) procedure is an inflammatory process. For the production of pro-inflammatory lipid mediators in many inflamma-tory reactions, the release of arachidonic acid by phospholipase A2 (PLA2) enzyme is a prerequisite.
Therefore, the purpose of the present investigation was to establish whether the activity of PLA2 increases
during HD and whether the increase depends on the type of dialyser used.
Methods. We performed dialysis in eight chronic HD
patients. Blood samples entering and leaving the dia-lyser were obtained before and at 15, 60, 120 and 180 min after the dialysis was started, on one occasion using a cuprophane and on another occasion a cellulose triacetate dialyser. PLA2 activity was assessed in crude
plasma and in plasma extract.
Results. PLA2 activity in plasma extract exhibited
sim-ilar biochemical properties to that of inflammatory human synovial fluid PLA2 enzyme which is of group
II PLA2. PLA2 activity in crude plasma represents a
type of PLA2 other than the synovial type. In HD
patients, baseline PLA2 activities in crude plasma and
plasma extract were significantly increased when com-pared to normal subjects. An increase in PLA2 activity
was observed in crude plasma with a peak appearing at 15 min when the patients were dialysed with cupro-phane and cellulose triacetate membranes. This increase was observed in both arterial and venous blood samples and was more pronounced when the patients were dialysed with cuprophane than with cellulose triacetate membranes. When PLA2 was
assessed in plasma extract, the activity increased only with cuprophane but not with cellulose triacetate membranes.
Conclusion. PLA2 activity in plasma is increased in
HD patients and increases during the dialysis proced-ure to a greater extent with a less biocompatible membrane. Continuous activation of PLA2 might be
relevant for long-term deleterious consequences of HD.
Correspondence and offprint requests to: Felix J. Frey MD, Division
of Nephrology, Department of Medicine, Inselspital, University of Berne, Freiburgstrasse 3, CH-3010 Berne, Switzerland.
Key words: arachidonic acid; biocompatible materials;
inflammation; membranes artificial
Introduction
Haemodialysis in humans and in experimental animals may result in adverse anaphylactic symptoms such as hypotension, respiratory distress, oedema of the skin, muscle cramps, nausea, headache, diaphoresis, feeling of fatigue, and lack of energy [1-3]. Some of these symptoms are used as clinical endpoints to assess acute side-effects due to the methods and materials used during dialysis [ 1 ]. One of the major cause for anaphyl-actic symptoms has been ascribed to the bioincompat-ibility of the blood/membrane contact [4-6]. For bioincompatibility, the cellulosic nature of the mem-branes has been implicated. In different memmem-branes the cellulose has been treated differently or different cellulose material has been used to form porous membranes. These membranes are treated with copper and ammonia in cuprophane membranes, whereas acetylated cellulose (CT 110, CT 190, Baxter, IL, USA) or saponified cellulose ester (135 see, C-D Medical) are used in other membranes. Cellulose is regenerated by removing acetate moities and other chemicals. In cellulose acetate membranes the acetate moities are retained [7]. The use of these membranes is associated with a variable incidence of side-effects. Compared to other membranes, cuprophane membranes are consid-ered to be less biocompatible [4-11].
As a result of blood/membrane interaction several studies reported leukopenia due to complement activa-tion [2,8], increased producactiva-tion of |32-microglobulin
[12], interleukin-1 (IL-1), interleukin-6(IL-6), tumour necrosis factor (TNF) [9-11,13,14], prostacyclin, thromboxane, platelet activating factor (PAF), hydro-xyeicosatetraenoic acids (HETS) [9,15-17] during haemodialysis. Many inflammatory cells release prosta-glandins and thromboxanes in situ with cuprophane membranes [9]. Proinflammatory autacoids like pros-taglandin, prostacyclin, thromboxanes, PAF, HETS are the metabolites of free arachidonic acid. Free arachidonic acid is primarily released by phospholipase
110 B. S. Vishwanath et at.
A2 (PLA2) enzyme from phospholipids by hydrolysing
a fatty acyl ester bond at sn-2 position [18]. PLA2
enzyme is activated by endotoxins and cytokines like interleukins and TNF [19-21]. Thus activation of PLA2 during haemodialysis might account for some of
the clinical signs and symptoms during dialysis. Therefore we investigated the impact of dialysis on the activation of PLA2 in vivo by comparing the effect of
a membrane considered to be rather bioincompatible with that of a biocompatible one.
Subjects and methods
Subjects and study design
Eight haemodialysis (HD) patients (4 males and 4 females) gave their written consent to participate in the following study which was approved by the ethical committee of the Inselspital, University of Bern. Their age ranged from 24 to 67 years (mean age 44.5 years). Eight healthy volunteers matched for age and sex with the HD patients (4 males and 4 females; range of age 26-64 years, mean age 45 years) were used for comparison of baseline PLA2 activity before the
dialysis was started. All HD patients had a history of at least 6 months on haemodialysis treatment and were undergoing haemodialysis regularly twice or three times a week using bicarbonate dialysate. These HD patients had the following underlying diseases causing endstage renal failure: pyelo-nephritis (4 patients), glomerulopyelo-nephritis (3 patients) and autosomal dominant polycystic kidney disease (1 patient). No medication known to interfere with PLA2 activity were
taken either by the patients or by the volunteers.
The patients were routinely dialysed with a cellulose triacet-ate hollow-fibre dialyser (CT 110, Baxter, IL, USA). For the study day, in addition a less biocompatible filter with a similar surface area was used for comparison (Cuprophan capillary dialyser, Hemoflow E4S, Fresenius). Dialysis was performed by puncturing a-v fistulas at the forearm with a 15-G needle. The first blood sample was collected before dialysis treatment. Additional blood samples were obtained either from the blood line coming directly from the body ('arterial') or from the blood line coming from the dialyser ('venous') at the following time points: 15 min after bolus injection of heparin (3000 U), 60 min and 120 min thereafter, and at the end of dialysis (— 180 min).
To study the effect of heparin, two patients were dialysed using cellulose triacetate hollow-fibre dialyser and with cup-rophane capillary dialyser without administering any heparin. Arterial blood samples were collected at the start of dialysis and at 15 min on dialysis. The dialysis was later on continued by administering heparin.
Analytical procedures
Blood collection and preparation of crude plasma. Four
milli-litres of whole blood was collected using 4-ml Monovette K.E tubes containing 1.6 mg EDTA/ml blood (Sarstedt, Neumbrecht Germany). Within 30 min the blood samples were centrifuged at 3000 g for 10 min. The upper cell free plasma was carefully collected and stored at — 20"C until further use.
Extraction of plasma for PLA2 activity measurements. Crude
plasma (750 ul) was extracted with equal volumes of 0.36 N sulphuric acid and was kept on ice water for 60 min. The
sulphuric acid was removed by dialysing (membrane with a molecular weight cut-off of 6000-8000 daltons) against 10 mM sodium acetate buffer pH 4.5. The dialysed plasma sample was incubated for 30 min at 80°C, which resulted in the formation of a white precipitate. This precipitate was resuspended in 10 mM sodium acetate pH 4.5 to a final volume of 5 ml. This sample was centrifuged at 20 000 g for 30 min. The supernatant was separated and stored at — 20°C until further use. This supernatant is designated below as 'plasma extract'.
In-vitro effect of heparin on plasma PLA2 activity. Crude
plasma was mixed with indicated concentrations of heparin and PLA2 activity was measured in crude plasma directly or
in the plasma extract.
Determination of protein concentrations. Protein
concentra-tions in crude plasma and in the plasma extracts were determined using the bicinchonic acid protein assay reagent (Pierce Chemical Co., Rockford, IL, USA).
Assay of PLA2 activity. [3H]-oleic-acid-(specific activity
lOCi/mmol, Amersham International pic. Buckinghamshire, UK)-labelled Escherichia coli was prepared according to the procedure of Patriarca et al. [22]. PLA2 activity in the crude
plasma and in the plasma extract was assayed using [3H]-oleate-labelled, autoclaved E. coli as the substrate [23]. The reaction mixture 350 ul contained 100 mM Tris-HCl pH 7.3/8.0 or sodium acetate buffer pH 6.0; 5 mM Ca2 + , 2.85 x 10⁸ cells of autoclaved E. coli cells (corresponding to 10000c.p.m. and 5.5 nmol lipid phosphorus). The amount of protein was chosen such that 6-15% hydrolysis of substrate was obtained when incubated at 37°C for 120 min. The reaction was terminated by adding 100 (il of 2 N hydrochloric acid. 100 ul of fatty acid-free BSA (100 mg/ml) was added, and the tubes were vortexed and centrifuged at 13000g for 5 min. An aliquot (140 JJ.1 ) of the supernatant containing released [3H]-oleic acid was mixed with scintillation cocktail (Dynagel, J. T. Baker, B. V. Deventer, Holland) and counted in a liquid scintillation counter. This method was further characterized for the hydrolysis products in the supernatant by extracting the fatty acids by the method of Bligh and Dyer [24]. The extracted products were separated on silicagel TLC plates (Merck, Basel, Switzerland) using the solvent system petroleum ethendiethyl ethenacetic acid (80:20:3 by v/v). Arachidonic acid (Sigma Chemie, Buchs, Switzerland) was used as a standard. The specificity of this assay method using E. coli as substrate was also characterized using phospholipase C (PLC) and phospholipase D (PLD) enzymes (Sigma Chemie, Buchs, Switzerland) using the same condition as described for PLA2 assay. The released fatty
acids were analysed by fatty acid entrapment with fatty acid free BSA as well as by separation on silica gel TLC plates as described above after extraction by the method of Bligh and Dyer [24].
Calculations and statistical analysis
The area under the activity of PLA2 versus time curve
(AUC) from plasma samples was calculated by the linear trapezoidal rule [25]. The values are expressed as mean (±SD). The significance of differences was determined using the Student t test for the paired observations or the Wilcoxon test.
Results
PLA2 activity measured in the crude plasma and in
Haemodialysis activates PLA2 enzyme o CD o ro 6 -O TO CNJ < -u-6 7 8
pH
10 10n o CD E 8 -"o CO £> is o 4-g
2
8 16Ca2+[mM]
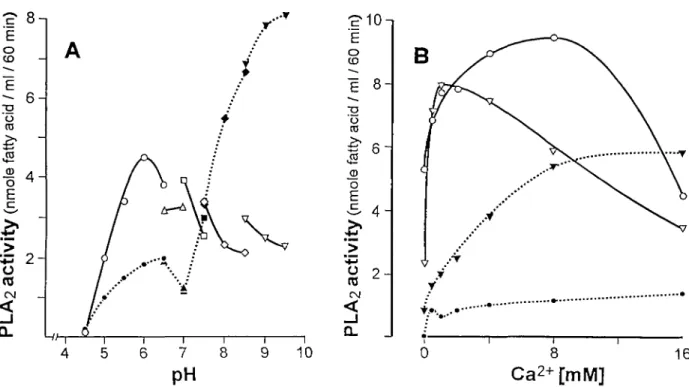
Fig. 1. Effect of pH (A) and calcium (B) on PLA2 enzyme activity in crude plasma ( , solid line and open symbols) and in plasma
extract ( , open line and closed symbols). Each value represents the average of three determinations. The buffers used were 100 mM sodium acetate for pH 4.5-6.5 ( • ) ; 100 mM bis-tris for pH 6.5-7.0 (A); 100 mM HEPES for pH 7.0-7.5 ( • ) ; 100 mM tris-HCl for pH 7.5-8.5 ( • ) and 100 mM glycyl-glycine for pH 8.5-9.5 (T) (optimum pH was measured in the presence of 5 mM calcium). The effect of calcium concentrations on PLA2 activity in crude plasma ( , solid lines) and in plasma extract ( , open lines) was measured at
p H 6 . 0 ( « ) a t pH8.5 (T).
E. coli as substrate showed specificity only for PLA2
enzyme. The measured radioactivity in the E. coli supernatant was due to the release of free fatty acid and not due to a mixture of hydrolysed fatty acids and unhydrolysed E. coli phospholipids, as determined by analysing the extracted lipids of the E. coli supernatant on silica gel TLC plates (data not given). No free fatty acids were measurable when PLC or PLD were used instead of PLA2.
In order to define the optimum conditions for the assessment of the PLA2 activity, the effect of variable
pH and calcium concentrations was determined. As shown in Figure 1, PLA2 activity measured in crude
plasma and in plasma extract showed different bio-chemical properties. In the presence of 5 mM Ca2+ PLA2 enzyme activity was optimal at pH 6.0 for crude
plasma, whereas in plasma extract the pH optimum was shifted from the acidic to basic pH with a max-imum activity at pH 8.0-9.0 (Figure 1A). PLA2
enzyme in the plasma extract was resistant to heat (80°C for 30 min). Based on this analysis the following conditions were chosen for all subsequent measure-ments: In the presence of 5 mM Ca2+ crude plasma was measured at pH 6.0 and plasma extract at pH 8.0. PLA2 activity in crude plasma and in plasma extract
was also measured at a physiological pH of 7.3. In all eight HD-patients the basal PLA2 activity was
higher than the corresponding activity from their matched controls, when PLA2 was assessed in crude
plasma (/5<0.001) (Figure 2). The mean (±SD) values for all patients and control subjects were
-£• 16-, E o t o 1 2 -^ 8 C J CtJ O CO CNJ O
4-Crude plasma Plasma-extract
o 8
o_ O- Patients Controls Patients Controls
Fig. 2. PLA2 activity in plasma samples from HD-patients before
dialysis and in control subjects. Open circles represent females and closed squares represent males. The individual values of all subjects and the mean values (bars) are shown. Matched controls had lower PLA2 activity than HD-patients when measured in crude plasma
(/>< 0.001) and in plasma extract I
9.95 +1.97 nmol fatty acid/ml/60 min and 3.93 ± 1.7 nmol fatty acid/ml/60 min respectively. The corresponding values for PLA2 activity in plasma
extract were 5.5 ± 1.6 nmol fatty acid/ml/60 min and 4.5+ 1.4 nmol fatty acid/ml/60 min respectively (Figure 2). Six of eight HD-patients had higher PLA2
activity in plasma extract than their matched control subjects (P<0.05). PLA2 activity was lower in plasma
extract than in crude plasma {P< 0.001) from patients, but not from controls. Female HD patients and female
112 B. S. Vishwanath el al.
controls had slightly higher PLA2 activities than males
(Figure 2).
The activation of PLA2 during dialysis was assessed
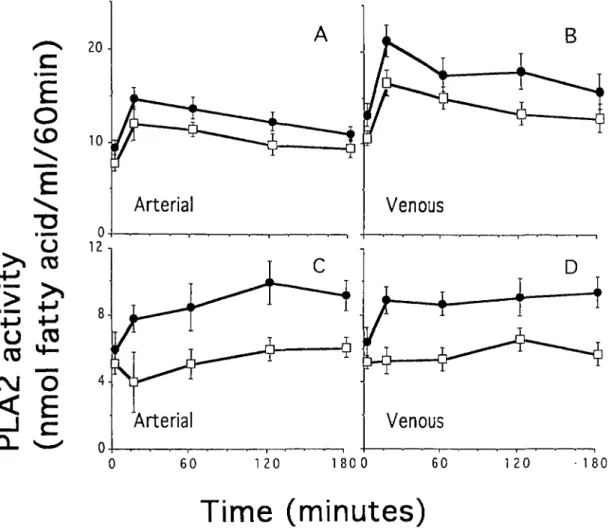
in eight HD patients with a cuprophane filter and with a cellulose triacetate filter (Figure 3). Measurements were performed both in arterial and in venous blood. PLA2 activities in crude plasma (Figure 3, A and B)
and in plasma extract (Figure 3, C and D) were significantly increased in HD patients dialysed with cuprophane filter compared to cellulose triacetate filter. The increase in PLA2 activity is not due to
haemocon-centration because, all the patients were under steady state and their protein levels in the samples did not increase during dialysis (data not shown). In order to get a quantitative estimate of the activation over time the AUC was determined for each patient (Figure 4). For each patient the AUC of the PLA2 activity was
calculated for venous and arterial blood while dialysed with a cuprophane or with a cellulose triacetate mem-brane. When the values derived from PLA2
measure-ments in crude plasma were considered, each patient had a higher AUC value in arterial and in venous blood during dialysis with cuprophane than with cellulose triacetate membranes (arterial, cuprophane
vs cellulose triacetate membrane 2243 ±404 vs 1756±320nmol fatty acid/ml/60 min, P< 0.001; ven-ous, cuprophane vs cellulose triacetate membrane 3129 + 890 vs 2499 + 611 nmol fatty acid/ml/60 min,
P<0.001) (Figure 3 A and 3 B). Similarly the values
of PLA2 activity obtained from measurements in
plasma extracts from venous blood were higher in eight of eight patients when cuprophane than when cellulose triacetate membranes were used (1559 + 397 vs 997 ±340 nmol fatty acid/ml/60 min, P< 0.001 (Figure 3D). Seven of eight patients had higher AUCs in plasma extracts from arterial blood when dialysed with cuprophane than with cellulose triacetate membranes (1713 ±436 vs 1035 ±472 nmol fatty acid/ml/60 min P<0.02) (Figure 3C). PLA2 activity
measured at physiological pH in crude plasma and in plasma extract also increased more, when the samples were obtained during cuprophane than cellulose tri-acetate membrane dialysis. Both plasma extract and crude plasma showed a similar profile when determined at pH 7.3 as measured at the optimal conditions (data not shown).
For each individual the values of the AUC of PLA2
activity derived from measurements in crude plasma
c
E
o
CD
"o
u
2
OJ
o
< E
B
60 120 1 8 0 0 60 120 180Time (minutes)
Fig. 3. PLA2 activity measurements in crude plasma (A and B) and in plasma extract (C and D) before (0 min) and at several time points
during dialysis. The patients were dialysed with cuprophane ( • ) and cellulose triacetate (Z) membranes. Each value represents the mean value (±SD) from eight patients.
Haemodialysis activates PLA2 enzyme 113
1.0 2 . 0 3 . 0 4 . 0 0 . 0 1 . 0 2 . 0 3 . 0 4 . 0
Venous PLA2 activity, AUC x 1 000
Fig. 4. The AUC of PLA2 activity was calculated for crude plasma and plasma extract in venous blood and plotted against the corresponding
AUC of PLA2 activity in arterial blood for each patient. The patients were dialysed using cuprophane ( • ) and cellulose triacetate
membranes (D). The oblique line is the line of identity. The activity measured in crude plasma was higher in venous blood than in arterial blood (/><0.02), whereas no such difference was found for measurements of plasma extract.
and plasma extract were calculated. The individual AUC value of the PLA2 activity of arterial blood was
plotted against the corresponding AUC value of the PLA2 activity of venous blood (Figure 4). In crude
plasma 13 of 16 values were below the line of identity indicating higher PLA2 activity in venous than in
arterial blood (/><0.02). In plasma extract the values were randomly distributed on both sides of the line of identity, indicating similar PLA2 activity in both
arter-ial and venous plasma extract.
Figure 5 depicts the effect of heparin on PLA2
activity in vitro. Heparin inhibited PLA2 activity in
crude plasma as well as in plasma extract when high concentrations of heparin were used. During dialysis the concentrations of heparin following an i.v. bolus dose of 3000 U are probably much lower than one unit
80 60 c o % 40 IE _c £ 20 0J 4 8 Heparin (units/ml) 12
Fig. 5. In-viiro effect of heparin on PLA2 activity. Following the
addition of heparin (0.1, 0.5, 1.0, 2.0, and 10.0 units/ml) to plasma, PLA2 activity was measured directly in crude plasma ( • ) and in
plasma extract (A). PLA2 activity was expressed asnmol fatty
acid/ml/60 min incubation. Each value represents the average of three determinations.
per millilitre. To exclude the effect of heparin, in vivo PLA2 activity was measured in two patients when
dialysed without heparin administration for 15 min. Compared to zero min sample PLA2 activity measured
in crude plasma (at pH 6.0 or 7.3) and plasma extract increased similarly after 15 min in both with and without heparin administration (data not shown).
Discussion
PLA2 enzymes characterized so far are classified into
group I, II, III and IV based on their primary and secondary structure [26,27]. PLA2 enzymes purified
from human platelets and from human synovial fluid are classified under group II and are considered to account for inflammatory reactions, whereas the group I from pancreas appears not to be involved in inflammation [28-30]. Group III enzyme has not been detected in mammalians and the function of cytosolic PLA2 (Group IV) is not very well defined yet [27].
Inflammatory human synovial fluid PLA2 (group II)
is resistant to low pH, optimally active in the presence ofmM concentrations of calcium and at basic pH [31,32]. PLA2 activity measured in plasma extract in
the present investigation exhibited similar biochemical/ biophysical properties as those known for PLA2
derived from inflammatory human synovial fluid PLA2.
The PLA2 assessed in crude plasma showed an
optimum activity at acidic pH. PLA2 activity measured
at pH 6.0 was abrogated when plasma was treated with acid and heat suggesting that the activity meas-ured in crude plasma represents a different type of PLA2 than the synovial type (group II PLA2). A
similar pH optimum was observed by others in crude plasma of uremic patients [33].
114
bolus dose of heparin (~3000 U). When added in vitro heparin inhibited PLA2 activity in crude plasma and
in plasma extract. This observation is in line with a previous publication [33], but is at variance with an observation made by Nakamura et ah, who showed that heparin enhanced plasma PLA2 activity in patients
undergoing cardiac surgery [34]. Dialysis with and without heparin administration resulted in a similar increase in PLA2 activity. Thus, the increase in PLA2
activity during dialysis cannot be attributed to the administered dose of 3000 U of heparin. Furthermore, the increase in PLA2 activity in plasma cannot be
related to haemoconcentration because in all patients ultrafiltration during dialysis was negligible as shown by the absence of an increase in the concentrations of plasma proteins.
When PLA2 activity was measured in crude plasma
the peak PLA2 activity was observed in all patients at
15 min after dialysis was started (Figure 3 A and B). Previous investigations revealed similar peaks of biolo-gical events during the initial 15 min on dialysis. These changes comprise among others, a decline in the leuko-^ cyte count in peripheral blood, evidence for activation of the complement system, release of TNF and interleu-kins, including IL-ip and arachidonic acid metabolites, such as PGE2, TXB2, PAF and HETS [2,8-17]. The
release of many arachidonic acid derivatives suggests
activation of PLA2, as shown by the present
investigations. The question arises what mediator(s) activate (s) PLA2 activity during dialysis? Potential
candidates are TNF, possibly complement and IL-ip [21,35]. IL-ip is a well established activator of group II PLA2 [25]. Thus the link between IL-ip and PLA2
activity during dialysis is an attractive hypothesis. However, in vivo this has to be considered carefully for the following reasons.
In vitro studies clearly demonstrate that first,
cyto-kine releasing agents cross the membranes from the dialysate to the blood side, second, complement factors induced during blood contact with dialysis membranes
in vitro enhance transcription of IL-1 and third,
cellu-lose directly stimulates cytokine production [9,36,37]. Thus in-vitro data clearly support the hypothesis of IL-1 to account for PLA2 activation. However, the
in-vivo observations are more difficult to reconcile with
that hypothesis, since only some [38-40] but not all [41—43] studies reveal increased concentrations of IL-1 P in blood. In line with our observation of a more pronounced PLA2 activation possibly mediated
through IL-1 release with a more complement-activating membrane is the recent report from Schindler et ah [14] demonstrating an increased gene expression of IL-1 (3 in peripheral blood mononuclear cells leaving the dialyser 5 min after start of haemodia-lysis. These authors found a significant correlation between the increase in IL-ip mRNA and increase in activated complement C5a. It is likely that IL-1 P contributes significantly to the increase in PLA2
activ-ity. However, it is open to speculation whether differ-ential activation of IL-1 P by cuprophane and cellulose triacetate membranes accounts for the differences in
B. S. Vishwanath et al.
PLA2 activity observed during dialysis with these
two membranes. Note that no difference^ between complement- and non-complement-activating mem-branes has recently been found with respect to IL-1 release [38]. Besides differential activation of IL-1, a different binding capacity of cuprophane and triacetate membranes for PLA2 could also account for the
differ-ences in PLA2 increase.
The origin of the PLA2 in plasma is open to
specula-tion. We have recently shown that lung tissue exhibits much higher activities of group II PLA2 than liver,
spleen, and kidney [28]. The lung is considered to account for leukocyte sequestration during dialysis [44]. It is conceivable that part of the activity of PLA2
in peripheral blood originates from lung tissue. Alternatively activated and/or sequestered leukocytes might account directly for the increase in PLA2 activity
[45,46]. The presence of PLA2 activity in granulocytes
and blood mononuclear cells was previously seen by several groups [32,47] including our own (unpub-lished data).
A higher PLA2 activity was measured in venous
than in arterial blood, when measurements were per-formed in crude plasma (Figure 4), suggesting an activation process or removal of an inhibitor by mem-brane material. This venoarterial difference is in line with the increased transcription of IL-ip in peripheral blood mononuclear cells obtained from venous, but not from arterial blood, as previously described by Schindler et al. [14] and the increased production of TXB2 in venous when compared with arterial blood
by Gawaz and Ward [16]. Interestingly the PLA2
activity in the plasma extract was the same in arterial and venous blood (Figure 3C and D). PLA2 from
plasma extract (presumably group II) has different biochemical properties than that measured in crude plasma. Furthermore the regulation and tissue distribu-tion of the PLA2 enzymes assessed in crude plasma
and plasma extract might be different and by that explain the different behaviour with respect to the activation during dialysis. With respect to the regula-tion we and others have recently shown a differential effect of glucocorticoids on group I and II PLA2 in
rats [28,29].
Recently PLA2 has been considered as a relevant
factor for another type of arthropathy, i.e. rheumatoid arthritis [48]. High levels of PLA2 (presumably
group II) had been found in blood and synovial fluid from these patients [49,50]. Injection of PLA2
(group II) into animal joints resulted in a massive inflammatory response with synovial cell swelling and hyperplasia [51,52]. These changes eventually cause periarticular subchondral bone erosions [53]. Periarticular erosions, albeit with a distinct distribution from that in patients with rheumatoid arthritis, is a feature of dialysis arthropathy [54-56]. It has been suggested that dialysis arthropathy has an inflammat-ory basis, since increased C-reactive protein concentra-tions had been found in patients with dialysis arthropathy [57]. Furthermore amyloid deposits con-sisting of p2-microblobulin in joints and periarticular
Haemodialysis activates PLA2 enzyme
tissue were described in patients with dialysis arthropa-thy [58]. The synthesis of pVmicroglobulin might locally be increased by activation of mononuclear cells [59] and by that mechanism favour p2-microglobulin
amyloid deposition in the presence of a decreased renal clearance of that protein. Thus it is conceivable that repeated PLA2 activation due to inflammatory effects
caused by extracorporeal circulation are relevant for the understanding of some of these signs and symp-toms, such as the pathogenesis of dialysis arthropathy.
Acknowledgements. This project was supported by grants from Swiss
National Foundation for Scientific Research (No. N F 32-40492-94), Wissenschaftlicher Fonds fur die Forschung an der Universitat Bern.
References
1. Blagg CR. Acute complications associated with hemodialysis, In: Maher JF. ed. Replacement of Renal Function by Dialysis. KJuwer Academic Publishers, Dordrecht, 1989, 750
2. Blumenstein M, Schmidt B, Ward RA et al. Altered interleukin-1 production in patients undergoing hemodialysis. Nephron 1988; 50: 277-281
3. Walker JF, Lindsay RM, Peters SD et al. A sheep model to examine the cardiopulmonary manifestations of blood dialyzer interactions. ASAIO J 1983; 6: 123
4. Cheung AK, Parker CJ, Wilcox LA et al. Activation of comple-ment by hemodialysis membranes: polyacrylonitrile binds more C3a than cuprophan. Kidney Int 1990; 37: 1055-1059
5. Pascual M, Schifferli JA. Absorption of complement factor D by polyacrylonitrile dialysis membranes. Kidney Int 1993; 43: 903-911
6. Deppisch R, Tirz E, Hansch GM et al. Bioincompatibility— Perspectives in 1993. Kidney Int 1994; 45 [Suppl 44]: S77-S84 7. Daugirdas JT, Ing TS, Roxe DM et al. Severe anaphylactoid
reactions to cuprammonium cellulose hemodiayzers. Arch Intern
Med 1985; 145: 489-194
8. Chenoweth DE, Cheung AK, Henderson LW. Anaphylatoxin formation during hemodialysis: effects of different dialyzer mem-branes. Kidney Int 1983; 24: 764-769
9. Betz M, Haensch G, Rauterberg E et al. Cuprammonium membranes stimulate interleukin 1 release and arachidonic meta-bolism in monocytes in the absence of complement. Kidney Int 1988; 34: 67-73
10. Laude-Sharp M, Caroff M, Simard L et al. Induction of IL-1 during hemodialysis: transmembrane passage of intact endotox-ins (LPS). Kidney Int 1990; 38: 1089-1094
11. Memoli B, Libetta C, Rampino T et al. Hemodialysis related induction of interleukin-6 production by peripheral blood mono-nuclear cells. Kidney Int 1992; 42: 320-326
12. Schoels M, Jahn B, Hug F et al. Stimulation of mononuclear cells by contact with cuprophan membranes; Further increase of p2-microglobulin synthesis by activated late complement
components. Am J Kidney Dis 1993; 21: 394-399
13. Herbelin A, Nguyen AT, Zingraff J et al Influence of uremia and hemodialysis on circulating interleukin-1 and tumor necrosis factor. Kidney Int 1990; 37: 116-125
14. Schindler R, Linnenweber S, Schulze M et al. Gene expression of interleukin-1 b during hemodialysis. Kidney Int 1993; 43: 712-721
15. Tetta C, David S, Biancone L et al. Role of platelet activating factor in hemodialysis. Kidney Int 1993; 43 [Suppl 39]: S154-S157
16. Gawaz MP, Ward RA. Effect of hemodialysis on platelet-derived thrombospondin. Kidney Int 1991; 40: 257-265
17. Malaise M, Lust C, Foidart JB el al Letter to the Editor. N
EnglJ Med 1985; 312: 514-515
18. Bonventre JV. Phospholipase A2 and signal transduction. J Am
Soc Nephr 1992; 3: 128-150
19. Glaser KB, Asmis R, Dennis EA. Bacterial lipopolysaccharide
115 priming of P388D! macrophage-like cells for enhanced arachi-donic acid metabolism. J Biol Chem 1990; 265: 8658-8664 20. Nakazato Y, Simonson MS, Herman WH et aL Interleukin-la
stimulates prostaglandin biosynthesis in serum-activated mes-angial cells by induction of a non-pancTeatic (type II) phospho-lipase A2. J Biol Chem 1991; 266: 14119-14127
21. Schalwijk C, Pfeilschifter J, Marki F et al. Interleukin-1 b, tumor necrosis factor and forskolin stimulate the synthesis and secretion of group II phospholipase A2 in rat mesangial cells. Biochem
Biophys Res Commun 1991; 174: 268-275
22. Patriarca P, Beckerdite S, Elsbach P. Phospholipases and phospholipid turnover in Escherichia coli spheroplasts. Biochem
Biophys Ada 1972; 260: 593-600
23. Rothut B, Russo-Marie F, Wood J et al. Further characterization of the glucocorticoid-induced antiphospholipase protein 'Renocortin'. Biochem Biophys Res Commun 1983; 117: 878-884 24. Bligh EG, Dyer WJ. A rapid method of total lipid extraction
and purification. Can J Biochem Physicol 1959; 37: 911-917 25. Gibaldi M, Perrier D. Pharmacokinetics. Marcel Dekker, New
York, 1975; 293-296
26. Hendrikson RL, Krcuger ET, Keim PS. Amino acid sequence of phospholipase A2-a from the venom of Crotalus adamanteus.
J Biol Chem 1977; 252: 4913-4921
27. Mayer RJ, Marshall LA. New insights on mammalian phos-pholipase A2(s); comparison of arachidonoyl-selective and
-nonselective enzymes. FASEB J 1993; 7: 339-348
28. Vishwanath BS, Frey FJ, Bradbury MJ et al. Glucocorticoid deficiency increases phospholipase A2 activity in rats. J Clin
Invest 1993; 92: 1974-1980
29. Nakano T, Ohara O, Teraoka H et aL Group II phospholipase A2 mRNA synthesis is stimulated by two distinct mechanisms
in rat vascular smooth muscle cells. FEBS 1990; 261: 171-174 30. Buchler M, Malfertheiner P, Schadlich H et al. Role of
phospho-lipase A2 in human acute pancreatitis. Gastroenterology 1989;
97: 1521-1526
31. Kramer RM, Hession C, Johanson B et al. Structure and properties of a human non-pancreatic phospholipase A2. J Biol
Chem 1989; 264: 5768-5775
32. Marshall La, Roshak A. Coexistence of two biochemically distinct phospholipase A2 activities in human platelet, monicyte,
and neutrophil. Biochem Cell Biol 1993; 71: 331-339 • 33. Costello J, Franson RC, Landwehr K et al. Activity of
phospho-lipase A2 in plasma increases in uremia. Clin Chem 1990;
36: 198-200
34. Nakamura H, Kim DK, Philbin DM et al. Heparin-enhanced plasma phospholipase A2 activity and prostacyclin synthesis in patients undergoing cardiac surgery. J Clin Invest 1995; 95: 1062-1070
35. Brady HR, Serbian CN. The prostaglandins, leukotrienes, lipo-xins, and platelet-activating factor. In: Sigal LH, Ron Y, eds.
Immunology and Inflammation, McGraw-Hill, New York, 1994;
271-286
36. Schindler R, Lonnemann G, Shaldon S et al. Transcriptional activation but not synthesis of interleukin- lb and tumor necrosis factor by complement. Kidney Int 1990; 37: 85-93
37. Lonnemann G, Behme TC, Lenzner B et al. The permeability of dialyzer membrane to TNF alpha inducing substances derived from water bacteria. Kidney Int 1992; 42: 61-68
38. Honkanen E, Gronhagen RC, Teppa AM et al. Acute-phase proteins during hemodialysis: correlations with serum interleukin-1 beta levels and different dialysis membranes.
Nephron 1991; 57: 283-287
39. Lonnemann G, Bingel M, Koch KM et aL Plasma interleukin-1 activity in humans undergoing hemodialysis with regenerated cellulosic membranes. Lymphokine Res 1987; 6: 63-70 40. Luger A, Kovarik J, Stummvoll HK et al. Blood-membrane
interaction in hemodialysis leads to increased cytokine produc-tion. Kidney Int 1987; 32: 84-88
41. Caruana RJ, Lobel SA, Leffell MS et aL Tumor necrosis factor, interleukin-1 and beta 2-microglobulin levels in chronic hemodia-lysis patients. Int J Artif Organs 1990; 13: 794-798
42. Tetta C, Camussi G, Turello E et al. Production of cytokines in hemodialysis. Blood Purif 1990; 8: 337-346
116 B. S. Vishwanath et al. beta and tumor necrosis factor alpha do not increase during
unfavorable hemodialysis conditions. / Am Soc Nephrol 1991; 2: 1007-1013
44. Kolb G, Hoffken H, Muller T el al Kinetics of pulmonary leukocyte sequestration in man during hemodialysis with differ-ent membrane-types. Int J Anif Organs 1990; 13: 729-736 45. Nguyen AT, Lethias C, Zingraff J et al. Hemodialysis
membrane-induced activation of phagocyte oxidative metabolism detected in vivo and in vitro within microamounts of whole blood. Kidney
Int 1985; 28: 158-167
46. Vanholder R, Ringoir S, Dhondt A et al. Phagocytosis in uremic and hemodialysis patients: a prospective and cross sectional study. Kidney Int 1991; 39: 320-327
47. Marki F, Franson R. Endogenous suppression of neutral active and calcium-dependent phospholipase A2 in human
polymor-phonuclear leukocytes. Biochim Biophys Ada 1986; 879: 149-156 48. Bomalaski JS, Clark MA. Phospholipase A2 and arthritis.
Arthritis Rheum 1993; 36: 190-198
49. Bomalaski JS, Clark MA, Douglas SD et al. Enhanced phospho-lipase A2 and C activities of peripheral blood polymorphonuclear
leukocytes from patients with rheumatoid arthritis. J Leukocyte
Biol 1985; 38: 649-654
50. Bomalaski JS, Clark MA, Zurier RB. Enhanced phospholipase activity in peripheral blood monocytes from patients with rheum-atoid arthritis. Arthritis Rheum 1986; 29: 312-318
51. Vishwanath BS, Fawzy AA, Franson RC. Edema-inducing activity of phospholipase A2 purified from human synovial fluid
and inhibition by aristolochic acid. Inflammation 1988; 12: 549-561
52. Bomalaski JS, Lawton P, Browning JL. Human extra-cellular recombinant phospholipase A2 induces an inflammatory
response in rabbit joints. J Immunol 1991; 146: 3904-3910 53. Harris ED JR. Rheumatoid arthritis: pathophysiology and
implications for therapy. TV" Engl J Med 1990; 322: 1277-1289 54. Gerber B, Horber FF, Robotti G et al. Distinct distribution of
periarticular erosions of the bones of the hand in chronic renal failure. Am J Nephrol 1987; 7: 459-463
55. Ritz E, Krempien B, Mehls O et al. Skeletal abnormalities in chronic renal insufficiency before and during maintenance hemo-dialysis. Kidney Int 1973; 4; 116-127
56. Brown EA, Arnold IR, Gower PE. Dialysis arthropathy: com-plication of long-term treatment with haemodialysis. Br Med J 1986; 292: 163-166
57. Sethi D, Muller BR, Brown EA et al. C-reactive protein in haemodialysis patients with dialysis arthropathy. Nephrol Dial
Transplant 1988; 3: 269-271
58. Ritz E, Bommer J. Beta-2-microglobulin-derived amyloid— problems and perspectives. Blood Purif 1988; 6: 61-68 59. Knudsen PJ, Ng AK, Liu Z. Beta-2-microglobulin synthesis is
increased during activation of human monocytes. Blood Purif 1988; 6: 178-187
Received for publication: 7.4.95 accepted in revised form: 19.9 95