HAL Id: inserm-03172160
https://www.hal.inserm.fr/inserm-03172160
Submitted on 17 Mar 2021
HAL is a multi-disciplinary open access
archive for the deposit and dissemination of
sci-entific research documents, whether they are
pub-lished or not. The documents may come from
teaching and research institutions in France or
abroad, or from public or private research centers.
L’archive ouverte pluridisciplinaire HAL, est
destinée au dépôt et à la diffusion de documents
scientifiques de niveau recherche, publiés ou non,
émanant des établissements d’enseignement et de
recherche français ou étrangers, des laboratoires
publics ou privés.
AMPAR-mediated plasticity and socio-cognitive deficits
in mice
Marta Prieto, Alessandra Folci, Gwénola Poupon, Sara Schiavi, Valeria
Buzzelli, Marie Pronot, Urielle François, Paula Pousinha, Norma Lattuada,
Sophie Abelanet, et al.
To cite this version:
Marta Prieto, Alessandra Folci, Gwénola Poupon, Sara Schiavi, Valeria Buzzelli, et al.. Missense
mutation of Fmr1 results in impaired AMPAR-mediated plasticity and socio-cognitive deficits in mice.
Nature Communications, Nature Publishing Group, 2021, 12 (1), pp.1557.
�10.1038/s41467-021-21820-1�. �inserm-03172160�
Missense mutation of
Fmr1 results in impaired
AMPAR-mediated plasticity and socio-cognitive
de
ficits in mice
Marta Prieto
1,6
, Alessandra Folci
1,6
, Gwénola Poupon
1
, Sara Schiavi
2
, Valeria Buzzelli
2
, Marie Pronot
1
,
Urielle François
3
, Paula Pousinha
1
, Norma Lattuada
4
, Sophie Abelanet
1
, Sara Castagnola
1
, Magda Chafai
1
,
Anouar Khayachi
1
, Carole Gwizdek
1
, Frédéric Brau
1
, Emmanuel Deval
1
, Maura Francolini
4
, Barbara Bardoni
5
,
Yann Humeau
3
, Viviana Trezza
2
& Stéphane Martin
5
✉
Fragile X syndrome (FXS) is the most frequent form of inherited intellectual disability and the
best-described monogenic cause of autism. CGG-repeat expansion in the
FMR1 gene leads to
FMR1 silencing, loss-of-expression of the Fragile X Mental Retardation Protein (FMRP), and is
a common cause of FXS. Missense mutations in the
FMR1 gene were also identified in FXS
patients, including the recurrent FMRP-R138Q mutation. To investigate the mechanisms
underlying FXS caused by this mutation, we generated a knock-in mouse model (
Fmr1
R138Q)
expressing the FMRP-R138Q protein. We demonstrate that, in the hippocampus of the
Fmr1
R138Qmice, neurons show an increased spine density associated with synaptic
ultra-structural defects and increased AMPA receptor-surface expression. Combining biochemical
assays, high-resolution imaging, electrophysiological recordings, and behavioural testing, we
also show that the R138Q mutation results in impaired hippocampal long-term potentiation
and socio-cognitive deficits in mice. These findings reveal the functional impact of the
FMRP-R138Q mutation in a mouse model of FXS.
https://doi.org/10.1038/s41467-021-21820-1
OPEN
1Université Côte d’Azur, CNRS, IPMC, Valbonne, France.2RomaTre University, Dept. Science, Rome, Italy.3University of Bordeaux, CNRS, IINS,
Bordeaux, France.4Università degli Studi di Milano, Dept. of Medical Biotechnology and Translational Medicine, Milan, Italy.5Université Côte d’Azur,
Inserm, CNRS, IPMC, Valbonne, France.6These authors contributed equally: Marta Prieto, Alessandra Folci. ✉email:martin@ipmc.cnrs.fr
123456789
T
he formation of functional synapses in the developing
brain is fundamental to establishing efficient neuronal
communication and plasticity, which underlie cognitive
processes. In the past years, synaptic dysfunction has clearly
emerged as a critical factor in the etiology of neurodevelopmental
disorders including Autism Spectrum disorder (ASD) and
Intel-lectual Disability (ID). X-linked ID (XLID) accounts for 5–10% of
ID patients and is caused by mutations in genes located on the X
chromosome. The Fragile X Syndrome (FXS) is the most frequent
form of inherited XLID and the
first monogenic cause of ASD
with a prevalence of 1:4000 males and 1:7000 females
1. The
majority of FXS patients exhibit mild-to-severe ID associated with
significant learning and memory impairments, Attention Deficit
Hyperactivity Disorder (ADHD), and autistic-like features
2–4. To
date, no effective therapeutic strategies are available.
FXS generally results from a massive expansion of the
trinu-cleotide CGG (> 200 repeats) in the 5′-UTR region of the FMR1
gene leading to its transcriptional silencing and consequently, the
lack of expression of the encoded Fragile X Mental Retardation
Protein (FMRP)
2,5. FMRP is an RNA-binding protein that binds
a large subset of mRNAs in the mammalian brain and is a key
component
of
RNA
granules.
These
granules
transport
translationally-repressed mRNAs essential for the synaptic
func-tion along axons and dendrites
1,3. Neuronal activation triggers
the local translation of these critical mRNAs at synapses allowing
spine maturation and elimination, which are essential processes
to shape a functional neuronal network in the developing brain.
Accordingly, the lack of FMRP expression in FXS patients and
Fmr1 knockout (Fmr1-KO) animal models leads to a pathological
increase in immature dendritic protrusions due to a failure in the
synapse maturation and/or elimination processes
6. These defects
correlate with significant alterations in glutamatergic
α-amino-3-hydroxy-5-methyl-4-isoxazolepropionic acid receptor
(AMPAR)-mediated synaptic plasticity, including Long-Term Depression
(LTD) and Potentiation (LTP)
1,7. Consequently, these defects
lead to learning and memory deficits and underlie the abnormal
socio-emotional behaviors in Fmr1-KO mice
1,7.
While the CGG-repeat expansion is the most frequent cause of
FXS, other mutagenic mechanisms have been reported, including
deletions, promoter variants, missense, and nonsense mutations.
To date, more than 120 sequence variants have been identified in
the FMR1 gene. However, only three missense mutations (I304N,
G266E, and R138Q) have been functionally studied and showed
an association with the etiology of FXS
8–13. Among them, the
R138Q mutation is of particular interest since it has been
iden-tified in three unrelated individuals presenting clinical traits of
FXS. The
first male patient sequenced displayed ID, anxiety, and
seizures
11,13, while the second presented the classical features of
FXS including ID, ADHD, seizures, and ASD
14. Interestingly, a
female with mild ID and attention deficits was recently identified
bearing the R138Q mutation
15.
The R138Q mutation does not affect the ability of FMRP to
bind polyribosomes and repress the translation of specific target
mRNAs
13. In addition, the intracellular perfusion of a short
N-terminal version of FMRP-R138Q in Fmr1-KO CA3 hippocampal
neurons failed to rescue the action potential broadening,
sug-gesting a functional alteration of the FMRP-R138Q truncated
mutant form
13. However, the cellular and network alterations
underlying the phenotype described in FMRP-R138Q FXS
patients remain to be elucidated. Here, we have engineered a
knock-in mouse model expressing the recurrent missense R138Q
mutation in FMRP (Fmr1
R138Q). We demonstrate that Fmr1
R138Qmice exhibit postsynaptic alterations in the hippocampus,
including an increased dendritic spine density, AMPAR-mediated
synaptic plasticity defects associated with severe impairments in
their socio-cognitive performances.
Results
Fmr1 mRNA and FMRP protein levels in Fmr1
R138Qmice. To
assess the pathophysiological impact of the recurrent R138Q
mutation in vivo, we generated a specific knock-in mouse line
expressing the R138Q FXS mutation using classical homologous
recombination in murine C57BL/6 embryonic stem (ES) cells
(Fig.
1
a). The R138Q coding mutation was introduced in exon 5
by changing the CGA arginine codon into a CAA nucleotide
triplet coding for a glutamine (R138Q: c.413G > A). The integrity
of the FXS mutation in the Fmr1
R138Qmice was confirmed by
genomic DNA sequencing (Fig.
1
a). Fmr1
R138Qmice were viable,
showed a standard growth and normal fertility and mortality
rates (Supplementary Fig. 1).
The expression pattern of the FMRP protein is
developmen-tally regulated
16. To assess whether the R138Q mutation affects
the developmental profile of FMRP, we compared the FMRP
protein levels in the brain of WT and Fmr1
R138Qmice at different
postnatal days (PND) (Fig.
1
b). As expected from the literature
2,5,
the FMRP protein level peaked at PND10–15 (WT PND15: 1.330
± 0.246) and then significantly decreased in the adult brain of WT
mice (WT PND90: 0.441 ± 0.078). FMRP-R138Q protein levels
showed a similar pattern in the developing Fmr1
R138Qbrain
(Fig.
1
b; Fmr1
R138QPND15: 1.300 ± 0.303; Fmr1
R138QPND90:
0.491 ± 0.072), indicating that the R138Q mutation does not alter
the protein expression of the pathogenic FMRP.
Since FMRP is an RNA-binding protein regulating the local
translation of a large number of mRNAs important to the
synaptic function, we compared the total levels of a subset of its
target mRNAs in PND90 WT and Fmr1
R138Qmale littermate
brains by RT-qPCR (Fig.
1
c). We found no significant differences
in the total mRNA levels of the FMRP targets tested.
To determine whether the R138Q mutation alters the brain
morphology, we next performed a Nissl staining on 20-µm-thick
brain coronal slices from PND90 WT and Fmr1
R138Qmale
littermates. There were no apparent macroscopic defects in the
Fmr1
R138Qbrain and the structural organization of the
hippocampus was preserved (Fig.
1
d).
Fmr1
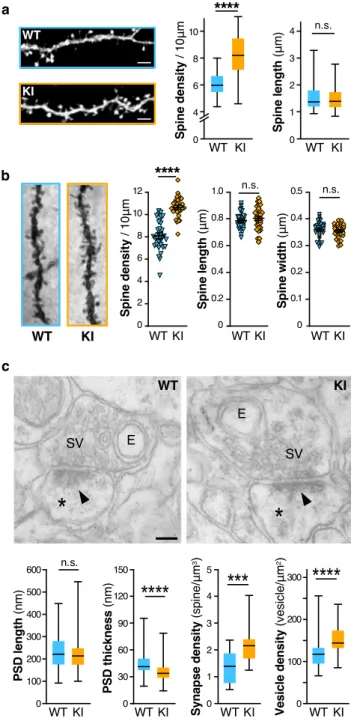
R138Qmice show an increase in hippocampal spine
den-sity. FMRP is essential to proper spine elimination and
matura-tion
3. A hallmark of the classical FXS phenotype is a pathological
excess of long thin immature dendritic protrusions
17, resulting
from a failure in postsynaptic maturation and/or elimination
processes. To understand if the R138Q mutation impacts spine
maturation and/or elimination, we analyzed the morphology and
density of dendritic spines in the Fmr1
R138Qhippocampus
(Fig.
2
). We
first used attenuated Sindbis viral particles in WT
and Fmr1
R138Qcultured hippocampal neurons at 13 days in vitro
(13 DIV) to express free GFP and outline the morphology of
dendritic spines
18,19. We then compared the density and
mor-phology of dendritic spines 20 h post transduction (Fig.
2
a).
Interestingly, while the length of dendritic spines was similar for
both genotypes (WT: 1.563 ± 0.0717
μm; Fmr1
R138Q: 1.521 ±
0.06193
μm), Fmr1
R138Qneurons displayed a significant increase
in spine density compared to WT neurons (WT: 6.06 ±
0.126 spines per 10
μm; Fmr1
R138Q: 8.16 ± 0.207 spines per
10
μm).
We also evaluated the characteristics of dendritic spines in the
CA1 region of the hippocampus of PND90 WT and Fmr1
R138Qmale littermates using Golgi-Cox staining (Fig.
2
b;
Supplemen-tary Fig. 2). While there was no difference in spine length and
width, Fmr1
R138Qhippocampal neurons displayed a significant
increase in spine density both in basal (Fig.
2
b; WT: 8.096 ±
0.232 spines per 10
μm; Fmr1
R138Q: 10.62 ± 0.167 spines per
10
μm) and apical dendrites (Supplementary Fig. 2; WT: 8.996 ±
0.189 spines per 10
μm; Fmr1
R138Q: 9.96 ± 0.152 spines per 10
μm). Taken together, these data indicate that the R138Q mutation
rather impairs the elimination of dendritic spines than their
maturation given that dendritic spines are morphologically
similar in WT and Fmr1
R138Qbrains.
To go deeper into the characterization of dendritic spines, we
performed ultrastructural analyses of WT and Fmr1
R138Qhippocampi using transmission electron microscopy (TEM).
Stereological analyses pointed out a significant increase in the
density of excitatory synapses in the Fmr1
R138Qhippocampus
(Fig.
2
c; WT: 1.371 ± 0.129 synapses per
μm
3; Fmr1
R138Q: 2.187 ±
0.161 synapses per
μm
3) in agreement with the Golgi-Cox
staining data (Fig.
2
b, Supplementary Fig. 2). Interestingly, while
there was no difference in the length of the postsynaptic densities
(PSD; WT: 232.63 ± 6.26 nm; Fmr1
R138Q: 222.73 ± 5.64 nm), the
PSD thickness in Fmr1
R138Qhippocampal neurons was largely
reduced (Fig.
2
c; WT: 44.70 ± 0.99 nm; Fmr1
R138Q: 34.96 ± 0.76
nm). We also measured a significant increase in the density of
synaptic vesicles in Fmr1
R138Qhippocampal presynaptic termini
(Fig.
2
c; WT: 120.48 ± 4.65 vesicles per
μm
2; Fmr1
R138Q: 148.97 ±
4.25 vesicles per
μm
2). Altogether, these data reveal that the
R138Q mutation leads to ultrastructural alterations both in the
pre- and postsynaptic compartments.
Increased surface-expressed AMPAR levels in
Fmr1
R138Qmice.
To characterize the effect of the R138Q mutation on the
com-position of synapses, we compared the total protein levels of
several pre- and postsynaptic proteins in brain homogenates
prepared from WT and Fmr1
R138Qmale littermates (Fig.
3
a;
Supplementary Fig. 3). Interestingly, we measured a significant
increase in the total amount of the GluA1 AMPAR subunit in the
Fmr1
R138Qbrain (GluA1 Fmr1
R138Q: 1.45 ± 0.12 vs WT). All the
other proteins investigated in the Fmr1
R138Qbrain, including
proteins involved in the trafficking of AMPAR, showed levels
similar to their WT littermates (Fig.
3
a; GluA2 Fmr1
R138Q: 1.16 ±
0.18; PSD95 Fmr1
R138Q: 1.13 ± 0.12; GRIP1 Fmr1
R138Q: 1.27 ±
0 1.0 0.5WT
KI
3
0 1.0 0.5 1.57
10 15 21 90
* *
n.s.WT
KI
b
a
KI (R138
Q) Q
KI allele
A
B C
E
D
PrimersWT
WT
KI
(-) 100 200 bp 153 bp Primer A/B 400 600 bpWT
KI
(-) 429 bp (WT) Primer C/D 508 bp (KI) 100 200 bpWT
KI
(-) 155 bp Primer C/EWT allele
Targeted
allele
R138Q mutation NEO Cassette LoxP LoxPA
B
C
D
Targeted exon 5R
Frt Frt exon 5 CGA > CAA exon 5WT
KI
c
d
Mr(K) 70 50Fig. 1 Generation and characterization of theFmr1R138QKnock-in (KI) mouse line. a Schematic representation of theFmr1 WT allele, the targeting vector used and the allele carrying the missense FXS R138Q mutation. Representative PCR profiles and DNA sequences obtained upon genotyping and genomic DNA sequencing of WT andFmr1R138Qlittermates.b Immunoblots showing FMRP protein levels at the indicated postnatal days (PND) in WT andFmr1R138Q mice.β3-tubulin loading control is also shown. Data are presented as mean values ± s.e.m. of normalized FMRP-WT and FMRP-R138Q protein levels in developing brains of age-matched littermate animals.N = 3 biologically independent experiments. Statistical significance determined by Two-way analysis of variance (ANOVA) with Sidak’s post test; *p = 0.0219 versus PND3–21; ns not significant. c Relative abundance of several mRNA targets of FMRP measured by qPCR in PND90 WT andFmr1R138Qbrains. Data are presented as mean values ± s.e.m. of three biologically independent experiments. No significant differences were observed between the genotypes. d Representative images of the hippocampal formation in PND90 WT and Fmr1R138Q littermates. Scale bar, 300μm. Source data are provided as a Source Data file.
0.19; PICK1 Fmr1
R138Q: 0.92 ± 0.15; Stargazin Fmr1
R138Q: 1.02 ±
0.03).
To further explore the AMPAR defects in the Fmr1
R138Qbrain,
we compared the levels of surface-expressed GluA1 in DIV15 WT
and Fmr1
R138Qcultured hippocampal neurons (Fig.
3
b). Using
surface-immunolabeling assays with specific GluA1
anti-bodies, we showed that the surface levels of GluA1 in Fmr1
R138Qneurons were significantly increased (Fig.
3
b; Mean surface
GluA1 intensity, WT: 1 ± 0.087; Fmr1
R138Q: 1.42 ± 0.13), with a
higher density of surface GluA1-containing clusters (Fig.
3
b;
Surface cluster density, WT: 1 ± 0.049; Fmr1
R138Q: 1.22 ± 0.06).
Since AMPARs are often concentrated in dendritic spines, this
finding corroborates the increased number of dendritic spines
measured in Fmr1
R138Qneurons (Fig.
2
). We further confirmed
the significant increase in GluA1 surface expression in Fmr1
R138Qneurons using cell surface biotinylation assays (Fig.
3
c; GluA1
Fmr1
R138Q: 1.85 ± 0.19 vs WT). Interestingly, while there was no
alteration in the total levels of GluA2 in the Fmr1
R138Qbrain
(Fig.
3
a), the surface expression of GluA2 was significantly higher
in cultured Fmr1
R138Qhippocampal neurons (Fig.
3
c; GluA2
Fmr1
R138Q: 1.50 ± 0.09 vs WT).
We then examined the surface expression of AMPARs in acute
hippocampal slices using BS3-crosslinking assays (Fig.
3
d).
Consistent with the above data, the surface expression of both
GluA1 and GluA2 was also significantly increased in the
Fmr1
R138Qhippocampus
(Fig.
3
d,
Lanes
+BS3; GluA1
Fmr1
R138Q: 1.76 ± 0.21 vs WT; Lanes
+BS3; GluA2 Fmr1
R138Q:
1.58 ± 0.17 vs WT). Altogether, these data clearly indicate that the
R138Q mutation leads to increased surface levels of both GluA1
and GluA2 in vitro and in vivo.
Altered synaptic transmission in the
Fmr1
R138Qhippocampus.
We showed that the recurrent FXS R138Q missense mutation
leads to an increase in AMPAR surface expression. To assess
whether this increase occurs at least in part synaptically, we
performed super-resolution STimulated Emission Depletion
(STED) microscopy on surface-labeled GluA1 or GluA2 in WT
and Fmr1
R138Qcultured hippocampal neurons (Fig.
4
a–d). We
first measured the mean fluorescence intensity from
surface-expressed GluA1 and GluA2 at Homer1-labeled postsynaptic sites
(Fig.
4
a-c). We found that the mean surface GluA1
fluorescence
intensity per synapse is significantly increased in Fmr1
R138Qneurons (Fig.
4
c, WT: 797 ± 28; Fmr1
R138Q: 1013 ± 34), whereas
the
fluorescence associated with surface-expressed GluA2 is
reduced (Fig.
4
c, WT: 1373 ± 34; Fmr1
R138Q: 1148 ± 29). At the
postsynapse, AMPARs are organized in 80–90 nm nanodomains
facing presynaptic glutamate release sites for efficient synaptic
transmission
20. Thus, we compared the mean number of
nano-domains containing surface-expressed GluA1 and GluA2 in WT
and Fmr1
R138Qhippocampal neurons (Fig.
4
a, b, d). Consistent
with the literature
20, we measured a density of ~2–2.1
nanodo-mains per spine for both surface-associated GluA1 and GluA2 in
WT neurons (Fig.
4
d, WT sGluA1: 2.023 ± 0.107; WT sGluA2:
2.121 ± 0.099
nanodomains
per
spine).
Interestingly,
in
Fmr1
R138Qspines there was a significant increase in the mean
WT KI 3 1 2 4 0 n.s. WT KI 8 4 6 10 0****
KI WTa
c
E
SV
KI
*
*
E
SV
WT
0.4 0.2 0.3 0.1 n.s. 0.5 WT KI 0 0.8 0.4 0.6 0.2 1.0 WT KI 0 n.s. WT KI 0****
10 6 8 4 12 2KI
WT
b
WT KI 500 200 400 0 100 600 n.s. 300 WT KI 120 60 90 0 30 150****
WT KI 4 2 3 0 1 5***
WT KI****
100 0 300 200Fig. 2 TheFmr1R138Qhippocampus exhibits increased dendritic spine density and ultrastructural alterations. a Confocal images of secondary dendrites from GFP-expressing WT andFmr1R138QKI cultured hippocampal neurons. Scale bar, 5µm. Box plots indicate median (middle line), 25th, 75th
percentile (box), and min to max values (whiskers) obtained for spine density and length in WT andFmr1R138Qneurons.N = 48–54 neurons for ~1400–2200 spines analyzed per genotype from six biologically independent experiments. Two-tailed Mann–Whitney test. ****p < 0.0001. b Representative images of Golgi-stained basal secondary dendrites of CA1 hippocampal neurons from PND90 WT andFmr1R138Qlittermates. Histograms show the density of spines, spine length and width from WT andFmr1R138QCA1 secondary dendrites. Error bars represent the mean ± s. e.m.N = 30 neurons per genotype from three biologically independent experiments (1500–2000 spines analyzed per genotype). Two-sided Mann–Whitney test; ****p < 0.0001. c Representative EM images of pre-and postsynaptic (*) elements in CA1 synapses of PND90 WT pre-and Fmr1R138Qhippocampi. E endosomes, SV synaptic vesicles, Arrowheads,
postsynaptic densities (PSD). Scale bar, 100 nm. Box plots indicate median (line), 25th, 75thpercentile (box), and min to max values (whiskers) for
PSD length and thickness, the density of synapses and synaptic vesicles in WT andFmr1R138QCA1 hippocampal neurons. Approximately 130 PSD (length and thickness), 60 presynaptic boutons, and 350µm2of total
surface area (synapse density) per genotype were analyzed from three independent sets of the experiment. Unpairedt test. ns not significant. ***p = 0.0003; ****p < 0.0001. Source data are provided as a Source Data file.
number of both surface-associated GluA1 and GluA2
nanodo-mains (Fig.
4
d, Fmr1
R138QsGluA1: 2.582 ± 0.106; Fmr1
R138QsGluA2 2.554 ± 0.078). These data indicate that the missense
R138Q mutation leads to a significant increase in the number of
postsynaptic nanodomains containing AMPARs. However, while
the mean
fluorescence associated with surface-expressed GluA1 is
also increased in hippocampal Fmr1
R138Qsynapses, the synaptic
fluorescence level from surface-labeled GluA2 is decreased
revealing that the upregulation of surface GluA2 measured in
biochemical experiments is rather due to its extrasynaptic
increase. This indicates that the FXS mutation not only impacts
the surface expression of both GluA1 and GluA2 but also
dif-ferentially perturbs their synaptic targeting, trafficking, and
nanoscale organization.
Finally, to better understand whether the increase in
surface-expressed AMPARs measured in the Fmr1
R138Qhippocampus
(Figs.
2
,
3
, and
4
a–d) is associated with alterations in glutamatergic
transmission, we performed whole-cell patch-clamp recordings
in CA1 neurons from hippocampal slices of PND90 WT and
Fmr1
R138Qlittermates (Fig.
4
e–k). We showed that the amplitude of
AMPAR-mediated miniature Excitatory PostSynaptic Currents
(mEPSCs) is significantly enhanced in Fmr1
R138Qmice (Fig.
4
e, f;
WT: 17.09 ± 0.539 pA; Fmr1
R138Q: 18.97 ± 0.405 pA). Interestingly,
we did not measure any significant differences in the frequency
of mEPSCs (Fig.
4
g, h; WT: 0.178 ± 0.040 Hz; Fmr1
R138Q: 0.143 ±
0.025 Hz) or the kinetics of these events (Fig.
4
i, j) between the two
genotypes.
Altogether the data from the above experiments (Figs.
2
–
4
)
revealed that the R138Q FXS mutation leads to important
pre-and postsynaptic alterations resulting in synaptic transmission
deficits in the Fmr1
R138Qhippocampus.
Impaired long-term potentiation in the
Fmr1
R138Qhippo-campus. We next investigated the consequences of the R138Q
mutation in hippocampal plasticity. Since the level of
surface-expressed AMPARs is enhanced in the Fmr1
R138Qhippocampus,
we wondered whether the induction of LTP could trigger a further
increase in synaptic AMPARs (Fig.
5
and Supplementary Fig. 4). To
test this hypothesis, we
first combined surface immunolabeling
assays with the chemical induction of LTP (cLTP
21) on WT and
Fmr1
R138Qhippocampal neurons (Fig.
5
a, b). In line with the
lit-erature
21, the level of surface GluA1 was significantly increased
upon cLTP in WT neurons (Mean surface GluA1 intensity, WT:
1.427 ± 0.129 vs basal; Surface cluster density, WT: 1.308 ± 0.08596
vs basal) whereas the surface level of GluA1 in Fmr1
R138Qneurons
was unexpectedly decreased (Mean surface GluA1 intensity,
Fmr1
R138Q: 0.6354 ± 0.08647 vs basal; Surface cluster density,
Fmr1
R138Q: 0.7455 ± 0.08227 vs basal).
Fig. 3 Increased surface expression of AMPAR in hippocampal neurons ofFmr1R138QKI mice. a Immunoblots showing the levels of the indicated synaptic proteins in brain homogenates from PND21 WT andFmr1R138Q littermate animals. GAPDH was used as a loading control. Quantification shows the mean ± s.e.m. of the total levels of the indicated proteins.N = 6 (GluA1, GluA2),N = 7 (PSD95), and N = 4 (GRIP1, PICK1, Stargazin) biologically independent experiments. Unpairedt test. ns not significant. **p = 0.0034. b Secondary dendrites from TTX-treated WT and Fmr1R138Q hippocampal neurons at 15 DIV stained for surface GluA1 (green) and MAP2 (red). Scale bar, 5µm. Histograms show mean ± s.e.m. of both surface intensity and cluster density for GluA1 in WT andFmr1R138Q neurons. Values were normalized to their respective basal conditions.N = 47 neurons per genotype fromfive biologically independent experiments. Two-tailed Mann–Whitney test. *p = 0.0147 (intensity) and *p = 0.0124 (density).c Immunoblots showing the surface expression of GluA1 and GluA2 in TTX-treated WT andFmr1R138Qcultured hippocampal neurons at 15 DIV using biotinylation assays. Histograms show the mean ± s.e.m. of the normalized level of GluA1 and GluA2 subunits at the neuronal surface in WT andFmr1R138Qneurons.N = 7 (GluA1) and 4 (GluA2) biologically independent experiments respectively. Two-sided ratiot test. **p = 0.0011 (GluA1); **p = 0.0074 (GluA2). d Immunoblots showing the basal surface expression of GluA1 and GluA2 in PND90 TTX-treated WT andFmr1R138Q hippocampal slices using the BS3-crosslinking assay. Control tubulin immunoblot is included to confirm the absence of BS3 crosslinking intracellularly. The surface/intracellular ratio in the WT was set to 1 and Fmr1R138Qvalues were calculated respective to the WT. Error bars show the
mean values ± s.e.m.N = 6 independent experiments. Two-tailed ratio t test. **p = 0.0041 (GluA1); **p = 0.0056 (GluA2). Source data are provided as a Source Datafile.
We confirmed these results using surface biotinylation assays
in WT and Fmr1
R138Qhippocampal neurons in basal and
cLTP-induced conditions (Supplementary Fig. 4a–c). The cLTP
treatment
triggered
the
increase
in
both
GluA1
and
GluA2 surface expression in WT neurons (WT GluA1 cLTP:
1.578 ± 0.107; WT GluA2 cLTP: 1.203 ± 0.008). In contrast, the
surface levels of AMPARs upon cLTP were not increased but as
above, rather decreased in Fmr1
R138Qhippocampal neurons
(Fmr1
R138QGluA1 cLTP: 0.490 ± 0.073; Fmr1
R138QGluA2 cLTP:
0.899 ± 0.157).
In addition to the data obtained on hippocampal cultures, we
performed BS3-crosslinking assays and showed that the induction
KI
WT
5 s 10 pA 100 50 75 0 25 10 20 30 40WT
KI
f
KI
20 10 15 0 5*
WT
WT KI
0.4 n.s. 0.3 0 0.1 0.2 100 50 75 0 25 0 1 3 5WT
KI
2 4g
h
50 ms 10 pAKI
WT
WT KI
40 30 0 10 20WT KI
e
i
j
k
WT
KI
sGluA2(STED) (confocal)HOMER1
WT
KI
sGluA1
(STED) (confocal)HOMER1
a
c
d
b
WT KI
***
2000 0 40000 20000 1000 30000WT KI
***
2000 0 15000 5000 1000 10000WT KI
1.5 2.5 0 0.5 3.0 3.5 4.0***
2.0 1.0WT KI
1.5 2.5 0 0.5 3.0 3.5 4.0**
2.0 1.0of cLTP in Fmr1
R138Qhippocampal slices led to a significant
reduction in the levels of surface-expressed AMPARs (Fig.
5
c–e,
Fmr1
R138QGluA1 cLTP: 0.706 ± 0.008 vs basal; Supplementary
Fig. 4d–f, Fmr1
R138QGluA2 cLTP: 0.860 ± 0.05 vs Fmr1
R138Qbasal), further confirming that the R138Q mutation impairs the
AMPAR trafficking. As expected, the cLTP treatment was able to
increase the surface levels of AMPARs in hippocampal slices from
WT littermate brains (Fig.
5
c, e, WT GluA1 cLTP: 3.691 ± 0.675
vs basal; Supplementary Fig. 4d–f, WT GluA2 cLTP: 1.953 ± 0.315
vs WT basal).
Altogether, these data indicate that the hippocampal plasticity
is severely impaired in the Fmr1
R138Qmice.
It has been demonstrated that the LTP induction promotes a
reorganization of the AMPAR nanodomains
22. Thus, to further
assess the impact of the R138Q mutation in cLTP-activated
neurons, we performed super-resolution STED microscopy on
surface-labeled GluA1 in cLTP-treated WT and Fmr1
R138Qhippocampal cells (Fig.
5
f–h). As expected, the mean fluorescence
intensity per synapse (Fig.
5
f, g; WT basal: 797 ± 28; WT cLTP:
1076 ± 35), as well as the density of the postsynaptic
nanodo-mains (Fig.
5
f, h; WT basal: 2.023 ± 0.107; WT cLTP: 2.783 ± 0.09
nanodomains per spine) containing the surface-expressed
GluA1 subunits were both significantly increased in WT
cLTP-treated neurons. In contrast, Fmr1
R138Qneurons exhibited a
significant decrease in the mean postsynaptic surface GluA1
fluorescence intensity upon cLTP (Fig.
5
f, g; Fmr1
R138Qbasal:
1013 ± 34; Fmr1
R138QcLTP: 890 ± 30) while the mean density of
surface GluA1-containing nanodomains remained unchanged
(Fig.
5
f, h; Fmr1
R138QsGluA1 basal: 2.582 ± 0.05; Fmr1
R138QsGluA1 cLTP: 2.599 ± 0.040 nanodomains per spine). These data
thus reveal that the R138Q mutation also impacts the synaptic
reorganization of AMPARs upon cLTP in Fmr1
R138Qcultured
hippocampal neurons, further confirming that the
activity-dependent trafficking of these receptors is impaired in the
Fmr1
R138Qmice.
Altogether, these data indicate that, contrary to WT neurons,
the induction of cLTP does not promote any increase in the
surface nor the synaptic levels of AMPARs in the Fmr1
R138Qhippocampus. Therefore, to determine if the expression of the
FMRP-R138Q mutant also physiologically impacts the
AMPAR-mediated responses, we induced LTP by high-frequency
stimulation (HFS) in acute WT and Fmr1
R138Qhippocampal
slices and recorded the postsynaptic responses in CA1 neurons
(Fig.
5
i–k). First, we tested the impact of the R138Q mutation on
the CA3 to CA1 synaptic transmission and did not
find any
significant differences with the WT responses in Input/Output
curves established following the stimulation of the Schaffer
collaterals (Supplementary Fig. 5). This indicates that the
connectivity between the pre- and postsynaptic sites is preserved
in the Fmr1
R138Qhippocampus. Next, we found that the
induction of LTP by HFS was evoked as expected in the WT
hippocampus (WT LTP: 157.2 ± 6.52% vs basal) but was
drastically reduced in Fmr1
R138Qmale littermates (Fmr1
R138QLTP: 122.4 ± 10.12% vs basal), in line with the impaired cLTP
seen in both biochemical and imaging experiments (Fig.
5
a–h).
In addition, we did not measure any significant difference in the
mean
fiber volley (FV) slope between genotypes (Fig.
5
i-k),
suggesting that the impaired LTP in the Fmr1
R138Qhippocampus
rather arises from postsynaptic impairments than from
pre-synaptic alterations.
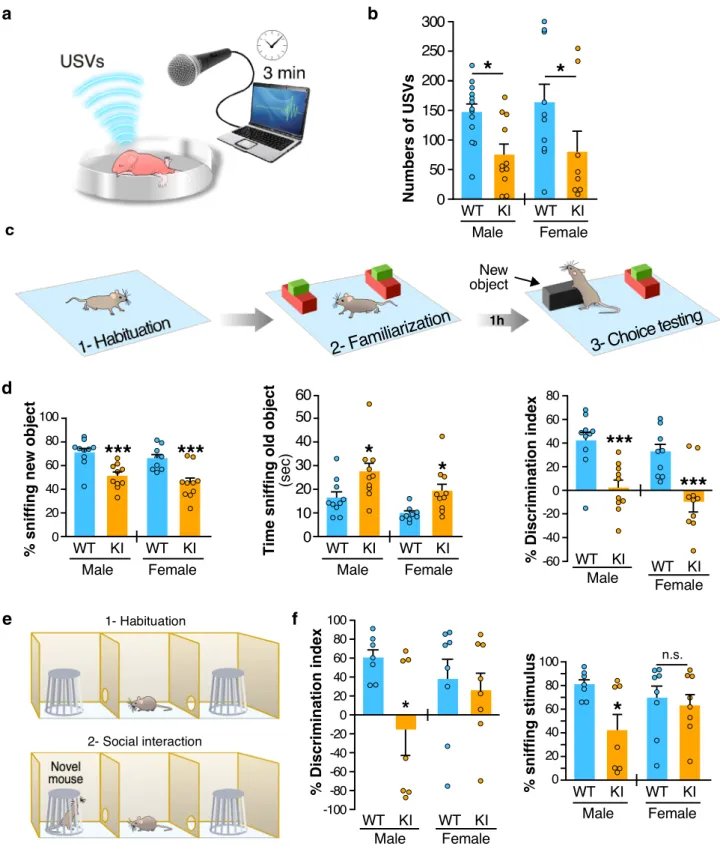
Fmr1
R138Qmice display ID- and ASD-like features. The R138Q
mutation has been identified in both male and female
patients
11,13,15. Since the mutation affects the surface levels of
AMPARs and directly impacts synaptic plasticity in the
hippo-campus, we investigated whether male and female Fmr1
R138Qmice display altered cognitive and/or social performances (Fig.
6
).
To avoid possible pitfalls due to an impact of the R138Q mutation
on locomotion, we
first tested PND40–45 mice using the open
field test to detect any potential motor defects. We did not
measure any significant differences in the number of crossings
between the two genotypes demonstrating that there is no motor
alteration in the Fmr1
R138Qmice (Supplementary Fig. 6).
Communication skills are altered in some FXS patients and
Fmr1-KO mice
19. We therefore compared the ultrasonic
vocalization (USV) profile in PND7 WT and Fmr1
R138Qpups
removed from the nest and found a ~50% decrease in the number
of USVs in Fmr1
R138Qcompared to WT animals in both genders
(Fig.
6
a, b; Fmr1
R138Qmale: 75.36 ± 17.71 USVs; WT male: 147.4
± 14.06 USVs; Fmr1
R138Qfemale: 79.88 ± 35.68 USVs; WT
female: 163.4 ± 31.49 USVs). These data indicate that the
R138Q mutation leads to severe communicative deficits in infant
Fmr1
R138Qmice.
Next, we evaluated the cognitive performance in PND40–45
males and females with the novel object recognition test (Fig.
6
c, d).
We found a profound deficit for both genders as the Fmr1
R138Qmice spent significantly less time than WT animals exploring
the novel object (Fmr1
R138Qmale: 51.18 ± 3.26%; WT male:
71.16 ± 3.72%; Fmr1
R138Qfemale: 45.27 ± 4.37%; WT female:
66.42 ± 3.31%). In addition, the Fmr1
R138Qmice were spending
significantly more time sniffing the old object (Fmr1
R138Qmale:
27.27 ± 3.85 s;
WT
male:
16.46 ± 2.46 s;
Fmr1
R138Qfemale: 19.22 ± 3.13 s; WT female: 9.77 ± 0.98 s), thus showing a
lower discrimination index (Discrimination index Fmr1
R138Qmale:
2.36 ± 6.51%; WT male: 42.31 ± 7.45%; Discrimination index
Fmr1
R138Qfemale:
−9.45 ± 8.73%; WT female: 32.84 ± 6.63%).
These data indicate that the R138Q mutation substantially alters the
cognitive function in the Fmr1
R138Qmice.
About 25% of FXS patients present ASD traits, including social
avoidance and decreased social skills. Therefore, to evaluate the
impact of the R138Q mutation in ASD-like behaviors, we tested
sociability in both male and female WT and Fmr1
R138Qmice
using the three-chamber test (Fig.
6
e, f). As expected, WT animals
from both sexes spent significantly more time sniffing the novel
mouse rather than the empty cage. We showed that both the time
spent sniffing the social stimulus and the ability to discriminate
Fig. 4 Increased synaptic surface expression of AMPAR and basal excitatory transmission in hippocampalFmr1R138Qneurons. a, b Super-resolution STED images of surface-expressed GluA1 and GluA2 (STED, green) in postsynaptic Homer1 sites (confocal, red) of TTX-treated WT andFmr1R138Q hippocampal neurons. Scale bar, 500 nm.c, d Quantification of (a) and (b). Box plots indicate median (middle line), 25th, 75thpercentile (box), and min tomax values (whiskers) obtained for the mean surface GluA1 and GluA2fluorescence intensity (c) and nanodomains (d) in WT and Fmr1R138Qneurons.N = 17–30 (WT) and 15–30 (Fmr1R138Q) neurons were analyzed from three biologically independent experiments with a total of dendritic spines analyzed ranging from 878 to 4246. Unpairedt test. ***p < 0.0001; **p = 0.0011. e–k mEPSCs recordings from acute hippocampal slices obtained from PND90 WT andFmr1R138Qlittermates. Quantification shows the mean values ± s.e.m. (e, g) and cumulative curves ± s.e.m. (f, h) of mEPSC amplitude and frequency. N = 10–11 neurons per genotype from three independent experiments. Unpaired t test. ns not significant. *p = 0.0111. i Example traces of WT and Fmr1R138Q
single events.j Computed Tau rise and decay. k Representative traces of mEPSC recordings from WT andFmr1R138Qhippocampal slices. Source data are provided as a Source Datafile.
between the novel mouse and the empty cage was dramatically
reduced in Fmr1
R138Qmales (Fmr1
R138Qmale sniffing time:
42.45 ± 13.84%; WT male: 80.48 ± 4.39%; Discrimination index
Fmr1
R138Qmale:
−15.10 ± 27.69%; WT male: 60.96 ± 8.78%).
However, there was no significant difference between the WT and
Fmr1
R138Qfemale mice (Fmr1
R138Qfemale sniffing time: 63.21 ±
9.25%; WT female: 69.29 ± 10.69%; Discrimination index
Fmr1
R138Qfemale: 26.41 ± 18.51%; WT female: 38.58 ± 21.37%).
Altogether, our behavioral data are in line with our
biochemical and physiological data and reveal that Fmr1
R138Qmice display important communicative, cognitive, and social
deficits.
***
500 750 0 250 1000 1250**
cLTP
WT
KI
*
cLTP
WT
KI
1.0 1.5 0 0.5 2.0 2.5 3.0 n.s.Discussion
Synaptic transmission and/or plasticity defects have been clearly
linked to the development of many, if not all, neurological
dis-orders. Therefore, a better understanding of the pathways
underlying these alterations is essential to develop strategies to
rescue the identified dysfunctions and design innovative targeted
therapies to treat these diseases. Here, we generated and
char-acterized a novel mouse model for FXS expressing the recurrent
R138Q missense mutation in the FMRP protein. We show that
the R138Q mutation leads to an increase in spine density,
alterations in both the pre- and postsynaptic organization, and an
impaired LTP in the Fmr1
R138Qhippocampus. The consequence
of this plasticity defect is an abnormal socio-cognitive behavior in
Fmr1
R138Qmice that resembles the ID and ASD-like traits
described in FXS patients bearing the R138Q mutation.
Alto-gether, our data validate the Fmr1
R138Qmouse line as a
com-pelling preclinical model to investigate the molecular mechanisms
underlying the pathology.
To date, only two studies have provided some insights into the
impact of the R138Q mutation on neuronal function
13,23. FMRP
is known to participate in the regulation of AMPAR trafficking
1,7,
which is critical to maintaining the synaptic function. Alpatov
and colleagues
23investigated the impact of the R138Q mutation
on the basal trafficking of AMPAR and reported that the
exo-genous expression of FMRP-R138Q does not impact the
con-stitutive endocytosis of AMPAR in an Fmr1-KO background.
Here, we revealed an altered surface expression of both GluA1
and GluA2 AMPAR subunits within the postsynaptic membrane
of the Fmr1
R138Qhippocampus, participating in an LTP
impairment in these mice. We also identified that the R138Q
mutation leads to alterations in the postsynaptic organization of
AMPAR-containing nanodomains (Fig.
4
). Nanoscale scaffolding
domains at the PSD are essential to organize and concentrate
AMPARs to allow an efficient synaptic transmission
20,24. These
80-nm AMPAR nanodomains facing presynaptic glutamate
release sites are dynamic and cLTP induction promotes their
nanoscale reorganization
20,22,24. Importantly,
the
calcium-dependent function of AMPARs also relies on the presence of
edited GluA2 subunits at the synapse, which confers a low Ca
2+permeability
to
GluA2-containing
heteromers
(calcium
impermeable, CI-AMPARs). Conversely, GluA1 homomers,
which lack the GluA2 subunit, are permeable to Ca
2+and refer as
CP-AMPARs
25–27. In basal conditions, the majority of AMPAR
assemblies in the adult hippocampus contain edited Ca
2 +-impermeable GluA2 subunits, which is essential to maintaining
a low intracellular Ca
2+concentration. In the Fmr1
R138Qhip-pocampal synapses, there is an excess of GluA1 subunits
asso-ciated with a decrease in the overall amount of surface-expressed
GluA2 at the synapse (Fig. 4a–d). This likely reflects a different
AMPAR subunit composition in Fmr1
R138Qsynapses, potentially
favoring the formation of AMPARs. The recruitment of
CP-AMPARs to postsynaptic sites plays a key role in the initial phase
of LTP
22,25,26. Interestingly, while we measured an overall
synaptic increase in CP-AMPARs upon cLTP induction in WT
neurons, this event is compromised in the Fmr1
R138Qhippo-campus (Fig.
5
g). Thus, it is tempting to speculate that the
enhanced expression of synaptic CP-AMPARs in basal conditions
in Fmr1
R138Qneurons likely impairs the recruitment of additional
GluA1-containing CP-AMPARs that are necessary to initiate the
LTP. Furthermore, we showed here that, contrary to the WT
synapse, there is no increase in GluA1-containing nanodomains
upon LTP in Fmr1
R138Qneurons (Fig.
5
h), which could also
participate in the impaired postsynaptic response measured in the
Fmr1
R138Qhippocampus.
The Fmr1
R138Qpostsynaptic compartment also presents
important ultrastructural alterations and displays an increase in
the density of presynaptic neurotransmitter vesicles and a
sig-nificant reduction of the PSD thickness (Fig.
2
). This could lead to
defective synaptic responses including altered diffusive properties
and/or anchoring of AMPARs within the postsynaptic
mem-branes, which is critical to recruiting AMPARs at the
hippo-campal synapse upon LTP induction
28,29.
Altogether, these data uncover a previously unsuspected
postsynaptic impact of the R138Q mutation leading to both basal
and activity-dependent AMPAR trafficking defects in the
Fmr1
R138Qhippocampus.
The second study investigating the functional impact of the
R138Q mutation reported that the exogenous overexpression of a
truncated (FMRP
1–298) version of the FMRP-R138Q mutant fails
to rescue action potential (AP) broadening in Fmr1-KO
neu-rons
13, which correlates with an increased presynaptic release
30.
However, the presynaptic release per se was not assessed in this
work. The authors also showed that the R138Q mutation disrupts
the interaction of the short FMRP
1–298form with the
β4 subunit
of BK channels, thus underlying AP duration
13,30. To conclude,
they hypothesized that an alteration of the presynaptic function is
likely responsible for the ID and seizures exhibited by the
first
FXS R138Q patient
13. Importantly, BK channels are localized
both at pre- and postsynaptic sites
31. Consequently, alterations in
FMRP/BK channel interaction may not only be linked to a
Fig. 5 LTP is impaired inFmr1R138Qmice. a Secondary dendrites from TTX-treated WT andFmr1R138Q15 DIV neurons stained for MAP2-positive microtubule (green) and surface-expressed GluA1 (red) in basal conditions and upon cLTP induction. Bar, 20µm. b Boxplots indicate median (line), 25th,75thpercentile (box), and min-to-max values (whiskers) obtained for surface GluA1 intensity and cluster density in WT andFmr1R138Qneurons in control
and cLTP conditions. Values were normalized to their basal conditions.N = 39–42 neurons per genotype from four independent experiments. Two-tailed Mann–Whitney test. *p = 0.0103; **p = 0.0053 (WT sGluA1 intensity); **p = 0.0034 (KI sGluA1 intensity); **p = 0.0036 (KI sGluA1 cluster). c, d Immunoblots showing the surface expression of GluA1 in basal and cLTP-induced conditions in PND90 TTX-treated WT (c) andFmr1R138Q(d) hippocampal slices using BS3-crosslinking assays. Control Tubulin immunoblot is included to control the absence of intracellular BS3-crosslinking.e The surface/ intracellular ratio in the WT was set to 1 andFmr1R138Qvalues were calculated respective to the WT. Bars show the mean ± s.e.m.N = 7 independent experiments. Two-tailed ratiot test. *p = 0.0358; ***p = 0.0004. f STED images of surface-expressed GluA1 (STED, green) in postsynaptic Homer1 sites (confocal, red) of cLTP induced WT andFmr1R138Qhippocampal neurons. Scale bar, 500 nm.g, h Box plots indicate median (middle line), 25th, 75th
percentile (box), and min to max values (whiskers) obtained for the postsynaptic surface-associated GluA1fluorescent intensity (g) and nanocluster density (h) computed from STED imaging data in basal and cLTP-treated WT andFmr1R138Qneurons.N = 13–17 (WT) and 15–18 (Fmr1R138Q) neurons were analyzed from three independent experiments.g, h Unpairedt test. ***p < 0.0001; **p = 0.0079. ns not significant. Values for control surface GluA1 in (f– h) are taken from Fig.4(c, d) since these experiments were performed in parallel. i Schematic diagram of the stimulating and recording areas in the mouse hippocampus.j fEPSPs were recorded at CA1 synapses on hippocampal slices from P35-42 WT andFmr1R138Qlittermates in basal conditions and upon LTP induction by high-frequency stimulation (HFS, 3 x 100Hz, 1 s).k Histograms show the mean ± s.e.m. offiber volley (FV) and fEPSP slopes from 12–16 neurons per genotype in four independent experiments. Unpairedt test with Welch’s correction. ns not significant; **p = 0.0092. Source data are provided as a Source Datafile.
WT
KI
Male
WT KI
Female
40
80
0
60
20
-20
-40
-60
WT
KI
20
50
0
*
40
10
30
WT
KI
*
Male
Female
60
1h
d
***
***
WT
KI
40
100
0
***
80
20
60
WT
KI
***
Male
Female
New
object
WT
KI
50
200
0
150
100
WT
KI
Male
Female
*
*
*
40
100
0
80
20
-20
-40
-60
60
-80
-100
e
f
*
WT
KI
40
100
0
80
20
60
WT
KI
Male
Female
n.s.
a
b
c
1- Habituation
2- Social interaction
250
300
WT
KI
Male
Female
WT KI
Fig. 6Fmr1R138Qmice show communication deficits and socio-cognitive alterations. a Schematic of the isolation-induced ultrasonic vocalizations (USVs) test.b Compared to WT animals,Fmr1R138QKI mice (PND7) emit ~50% less USVs when removed from the nest. Histogram shows the mean values ± s.e.m. of USVs in WT andFmr1R138Qmales and females. WT,N = 13 males, 11 females; Fmr1R138Q,N = 10 males, 8 females. *p = 0.028. c Schematic of the object recognition test used to assess the cognitive domain.d Quantification shows the mean values ± s.e.m. of time sniffing the new object (%), the old object (s), and the discrimination index (%) for both PND40–45 WT and Fmr1R138Qmales and females. WT,N = 10 males, 9 females; Fmr1R138Q,N = 10 males, 10 females. *p = 0.011 (male), *p = 0.028 (female), ***p < 0.001. e Scheme of the three-chamber test used to assess sociability. f Histograms show the mean percentage ± s.e.m. of discrimination index and time sniffing the stimulus mouse for both PND40–45 WT and Fmr1R138Qmales and females. WT,N = 7 males, 8 females;Fmr1R138Q,N = 7 males, 8 females. *p = 0.017. Two-way ANOVA with genotype and sex as factors followed by Newman–Keuls post-hoc test for individual group comparisons were computed for all behavioral studies. Source data are provided as a Source Datafile.