Structural and electron charge density studies of a nonlinear
optical compound 4,4 di-methyl amino cyano biphenyl
Naima Boubegra, Abdelkader Chouaih†, Mokhtaria Drissi, and Fodil Hamzaoui
Laboratoire de Technologie et Propri´et´es du Solide (LTPS), Universit´e Abdelhamid Ibn Badis de Mostaganem, 27000 Mostaganem, Algeria (Received 25 March 2013; revised manuscript received 29 June 2013; published 3 December 2013)
The 4,4 dimethyl amino cyano biphenyl crystal (DMACB) is characterized by its nonlinear activity. The intra molec-ular charge transfer of this molecule results mainly from the electronic transmission of the electro-acceptor (cyano) and electro-donor (di-methyl-amino) groups. An accurate electron density distribution around the molecule has been calculated based on a high-resolution X-ray diffraction study. The data were collected at 123 K using graphite-monochromated Mo Kα radiation to sin(θ )/λ = 1.24 ˚A−1. The integrated intensities of 13796 reflections were measured and reduced to 6501 independent reflections with I ≥ 3σ (I). The crystal structure was refined using the experimental model of Hansen and Cop-pens (1978). The crystal structure has been validated and deposited at the Cambridge Crystallographic Data Centre with the deposition number CCDC 876507. In this article, we present the thermal motion and the structural analysis obtained from the least-square refinement based on F2and the electron density distribution obtained from the multipolar model. Keywords: electron charge density, 4,4 dimethyl amino cyano biphenyl crystal (DMACB), multipolar
refine-ment
PACS: 61.66.Hq, 42.65.–k, 31.15.A–, 71.20.–b DOI:10.1088/1674-1056/23/1/016103
1. Introduction
In the nonlinear optical (NLO) field, organic molecu-lar crystals have attracted much interest mainly because of their optical transparency and optical efficiency, which can be superior by several orders of magnitude to those of the best known mineral materials. Among them, organic second-order NLO molecules have been widely investigated by ex-perimental and theoretical chemists due to their high electro-optic (EO) coefficients, facile processing, as well as low di-electric constants.[1–5]These molecules are prepared with suit-able donor-acceptor (D, A) couples connected by a transmitter group T (π-electron). These kinds of molecules are known un-der the term push-pull molecules.[6–10]A typical organic com-pound consists of strong electron acceptors (e.g. NO2or CN
groups) and donors (e.g. NR2or OR groups) connected by a
π -conjugated system. This arrangement ensures efficient in-tramolecular charge transfer and enables further fine-tuning of the polarisability of the compound.[11–14]
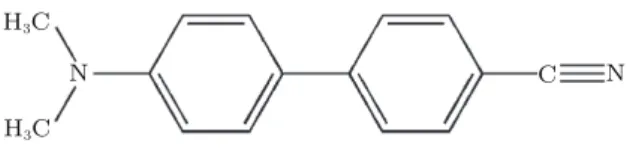
The 4,4 di-methyl amino cyano biphenyl compound (DMACB) is considered to be one of the most interesting ma-terials in non-linear optics because it crystallizes readily com-pared to other competitive crystals. A structural analysis has been already carried out at room temperature by Zyss et al.[15] The DMACB crystallizes in the noncentrosymmetric space group Cc with four molecules in the unit cell. Its structure is shown in Fig.1.
This work focuses on the thermal motion analysis and the electronic charge density distribution of the DMACB molecule using high-resolution X-ray diffraction data
per-formed at 123 K. To achieve this study, we used the XD pro-gram package based on the Hansen–Coppens charge density model.[16]One major component of this package is a program for the least-square fitting of the experimental data.[17]
H3C
H3C
N C N
Fig. 1. Chemical structure of DMACB.
2. Experiment
The crystallographic data were obtained at 123 K
on a CAD4 diffractometer using the graphite–
monochromated Mo Kα radiation. A crystal of dimensions 0.2 mm×0.2 mm×0.15 mm was used for the data collection. The crystal of high quality was cooled using a modified Enraf Nonius nitrogen gas-flow system. The cell parameters were determined from refinement by using the centered angular po-sitions of 25 reflections with 11 ≤ θ ≤ 25◦. The profiles of the different reflections were measured using the θ –2θ step scan method. A total of 13796 intensities were recorded up to 2θ of 59.7◦. Only selected reflections with significant intensities were collected in the high-order θ range. The data merged to give 6501 independent reflections. Only 5729 reflections for which I ≥ 3σ (I) were used for the refinement.
The H atoms were located by difference Fourier synthe-sis. The data reduction and error analysis were carried out by using the program of Blessing (1989).[18] The experimental
†Corresponding author. E-mail:[email protected]
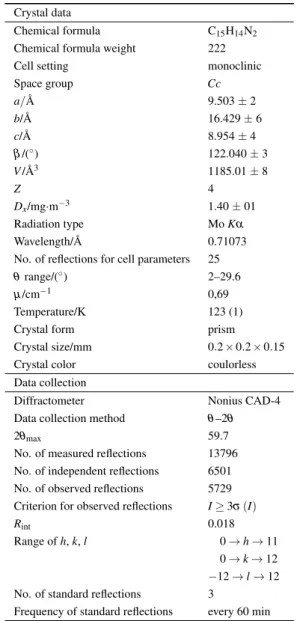
details and crystal data are displayed in Table 1. The crys-tal structure has been validated and deposited at the Cam-bridge Crystallographic Data Centre with the deposition num-ber CCDC 876507. The full details can be obtained free of charge from the Cambridge Crystallographic Data Centre.
Table 1. Experimental details. Crystal data
Chemical formula C15H14N2
Chemical formula weight 222 Cell setting monoclinic
Space group Cc a/ ˚A 9.503 ± 2 b/ ˚A 16.429 ± 6 c/ ˚A 8.954 ± 4 β /(◦) 122.040 ± 3 V/ ˚A3 1185.01 ± 8 Z 4 Dx/mg·m−3 1.40 ± 01 Radiation type Mo Kα Wavelength/ ˚A 0.71073 No. of reflections for cell parameters 25 θ range/(◦) 2–29.6
µ /cm−1 0,69
Temperature/K 123 (1) Crystal form prism Crystal size/mm 0.2 × 0.2 × 0.15 Crystal color coulorless Data collection
Diffractometer Nonius CAD-4 Data collection method θ –2θ
2θmax 59.7
No. of measured reflections 13796 No. of independent reflections 6501 No. of observed reflections 5729 Criterion for observed reflections I≥ 3σ (I)
Rint 0.018
Range of h, k, l 0 → h → 11 0 → k → 12 −12 → l → 12 No. of standard reflections 3
Frequency of standard reflections every 60 min
3. Refinement
In addition to the conventional least-square refinement of data sets, a separate refinement using only high-order reflec-tions (sin θ /λ ≥ 0.75 ˚A−1) was performed. For this latter set of reflections, the X-ray scattering was mainly from the core electrons. The high-order data were expected to yield atomic parameters less biased by the inadequacy of the spherical-atom model. We continued our refinement using the XD program based on the Hansen–Coppens charge density model, in which the atomic density is described as a series expansion in real spherical harmonic functions Ylmup to order four[15]
ρi = pi,cρi,c+ pi,vκ3ρi,v(κiri)
+ 4
∑
I=0 k03Rk,l(k00, r) + l∑
m=−1 Pk,lmYklm r |r|, (1)where ρcand ρvare spherically averaged Hartree–Fock core
and valence densities, with ρvnormalized to one electron, Ylm
are multipolar spherical harmonic angular functions in real form, Rl = Nlrnexp(−k0ξ r) are Slater–type radial functions
with Nl as the normalization factor and n = n(l) and ξ being
parameters chosen according to the criteria given by Hansen and Coppens.[15] The development was trunked to the third order lmax= 3 and the coefficients of the hexadecapole
func-tions (l = 4) were constrained to be zero. The coefficients of the radial functions were n1= 2, 2, 3 (for l = 1, 2, 3,
respec-tively) for non–H atoms and n1= l for H atoms.
The adjustable variables were the valence-shell contraction–expansion parameters k0, k00, the population pa-rameter Pvand the multipolar parameters Plm. To reduce the
number of variables, chemical constraints were imposed, with which atoms of similar environment were assumed to have the same deformation.
The scattering factors for the non-H atoms were taken from the international tables for X-ray crystallography.[19]The scattering factors of the H atoms were those of Stewart et al.[20] The results of this refinement are summarized in Ta-ble 2. An isotropic extinction correction as described by Becker and Coppens was applied.[21]
Table 2. Least-square refinement factors, where N is the number of refined parameters, R = ∑ |Fo| − |Fc|/ ∑ |Fo|, wR =
[∑ w(|Fo| − |Fc|)2/ ∑ w|Fo|2]1/2, S = [∑ w(|Fo| − |Fc|)2/(M − N)]1/2;
the atomic scattering factors come from the international tables for X-ray crystallography.[19]
Spherical refinement N R wR S 195 0.028 0.026 1.02
4. Structural analysis
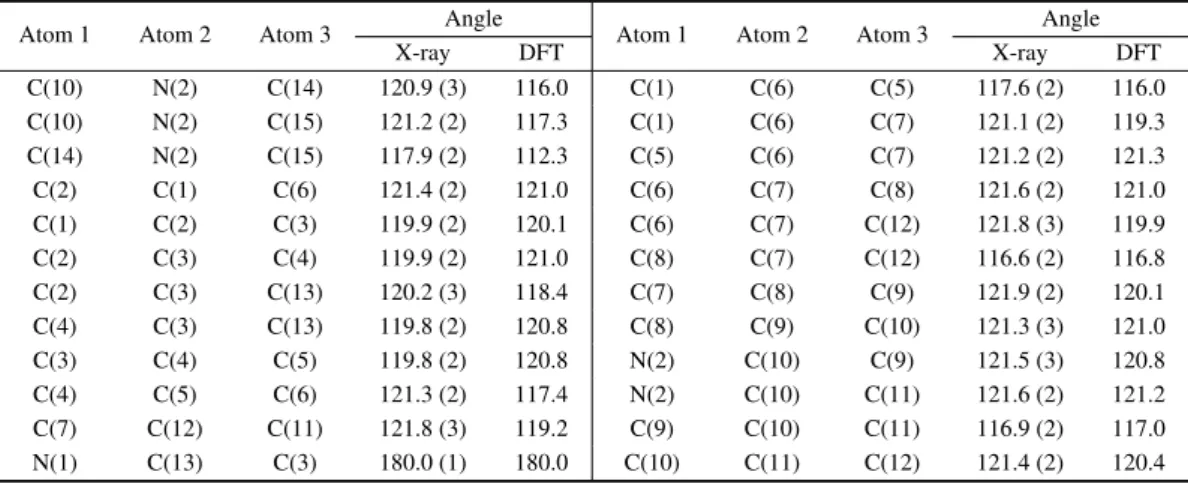
In order to investigate the theoretical calculations of the molecular structure parameters, we have applied ab intio methods. These calculations were performed with the density functional theory (DFT) at B3LYP (Becke’s three parameter hybrid functional using the correlation functional of Lee, Yang and Parr, which includes both local and non-local terms in the correlation functional) method at the 6-31G* level using the Gaussian 03 computational chemistry program package.[22] The parameters of the optimized structure (bond lengths and bond angles) are listed in Tables3and4. It can be seen that all the calculated parameters are in accordance with the X-ray results. In spite of the differences, the calculated geometric parameters represent a good approximation and can provide a starting point to calculate other parameters, such as vibrational wavenumbers, as will be described in the next work.
Table 3. Bond lengths of DMACB in units of ˚A, with estimated deviations in parentheses. Atom 1 Atom 2 Distance Atom 1 Atom 2 Distance
X-ray DFT X-ray DFT N(1) C(13) 1.144 (3) 1.137 C(4) C(5) 1.374 (3) 1.381 N(2) C(10) 1.372 (3) 1.410 C(5) C(6) 1.401 (3) 1.394 N(2) C(14) 1.435 (3) 1.453 C(6) C(7) 1.468 (3) 1.488 N(2) C(15) 1.436 (4) 1.445 C(7) C(8) 1.393 (4) 1.395 C(1) C(2) 1.377 (3) 1.381 C(7) C(12) 1.393(3) 1.386 C(1) C(6) 1.397 (4) 1.394 C(8) C(9) 1.382 (3) 1.377 C(2) C(3) 1.384 (4) 1.390 C(9) C(10) 1.393 (3) 1.398 C(3) C(4) 1.391 (4) 1.390 C(10) C(11) 1.394 (4) 1.387 C(3) C(13) 1.438 (3) 1.444 C(11) C(12) 1.382 (3) 1.391
Table 4. Bond angles of DMACB in units of (◦), with estimated deviations in parentheses. Atom 1 Atom 2 Atom 3 Angle Atom 1 Atom 2 Atom 3 Angle
X-ray DFT X-ray DFT C(10) N(2) C(14) 120.9 (3) 116.0 C(1) C(6) C(5) 117.6 (2) 116.0 C(10) N(2) C(15) 121.2 (2) 117.3 C(1) C(6) C(7) 121.1 (2) 119.3 C(14) N(2) C(15) 117.9 (2) 112.3 C(5) C(6) C(7) 121.2 (2) 121.3 C(2) C(1) C(6) 121.4 (2) 121.0 C(6) C(7) C(8) 121.6 (2) 121.0 C(1) C(2) C(3) 119.9 (2) 120.1 C(6) C(7) C(12) 121.8 (3) 119.9 C(2) C(3) C(4) 119.9 (2) 121.0 C(8) C(7) C(12) 116.6 (2) 116.8 C(2) C(3) C(13) 120.2 (3) 118.4 C(7) C(8) C(9) 121.9 (2) 120.1 C(4) C(3) C(13) 119.8 (2) 120.8 C(8) C(9) C(10) 121.3 (3) 121.0 C(3) C(4) C(5) 119.8 (2) 120.8 N(2) C(10) C(9) 121.5 (3) 120.8 C(4) C(5) C(6) 121.3 (2) 117.4 N(2) C(10) C(11) 121.6 (2) 121.2 C(7) C(12) C(11) 121.8 (3) 119.2 C(9) C(10) C(11) 116.9 (2) 117.0 N(1) C(13) C(3) 180.0 (1) 180.0 C(10) C(11) C(12) 121.4 (2) 120.4
It is worth noting that some of the optimized bond lengths and bond angles have slightly different values from the corre-sponding experimental ones due to the fact that the theoretical calculations consider only isolated molecules in the gaseous phase while the experimental results refer to molecules in a crystal environment.
The general features of the structure at room temperature have been described previously. The DMACB is a non-planar molecule. The dihedral angle between the two phenyl groups is 42◦. The main characteristic of this structure is that the four molecules in the unit cell are engaged in four chains formed by infinite chains of hydrogen-bonded coplanar molecules, as shown in Fig.2. Our results have not been subject to any struc-tural changes compared to the initial published results.
The design of the most efficient organic materials for the non-linear optical (NLO) effect is based on molecular units containing highly delocalized π-electron moieties and extra electron donor (D) and electron acceptor (A) groups on the opposite sides of the molecule at appropriate positions on the ring to enhance the conjugation. The π-electron cloud move-ment from donor to acceptor makes the molecule highly po-larized. The DMACB molecule is designed using acceptor group N≡C– (cyano group), which has the highest acceptor ability, and donor group –N(CH3)2 (dimethyl amino group)
that has the highest donor character. The ab initio optimiza-tion in this investigaoptimiza-tion shows that the molecule of DMACB
is almost planer. The planarity can affect the NLO properties of DMACB due to the free rotation of two benzene rings. The DMACB molecule has two benzene rings connected through a single covalent bond C–C, which can eventually stop the free rotation and facilitate the intramolecular charge transfer. To understand this phenomenon in the context of the molecular orbital picture, the highest occupied molecular orbitals (HO-MOs) and the lowest unoccupied molecular orbitals (LU(HO-MOs) should be examined.
B A
Fig. 2. (color online) Packing diagram of the structure.
5. Thermal motion analysis
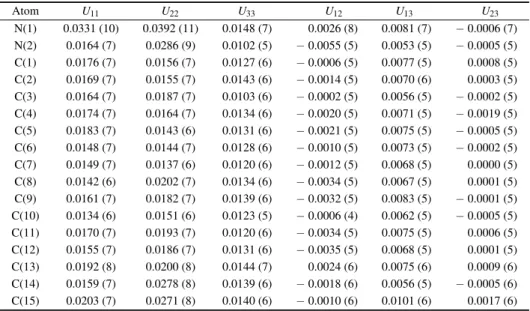
The thermal motion analysis of DMACB has been per-formed using the THMA11 program.[23]The rigid-body
mo-tion is described by three tensors, 𝑇 for the translamo-tion, 𝐿 for the liberation and 𝑆 for taking into account the correlation be-tween translation and liberation. These tensors are obtained by a least-square fit refinement using the observed atomic ther-mal motion parameters obtained by the refinement and given in Table5. This test indicates that the differences between the mean-square displacement amplitudes (MSDAs) along the in-teratomic directions have a magnitude ∆ ≤ 10.10−4A˚2for the most bonded pairs of the non-H atoms.[24]The MSDAs ∆
AB
in the AB direction for all pairs of atoms in the molecule have been calculated and reported in Table6.
In the general treatment of the molecular thermal motion in terms of rigid-body (𝑇 𝐿𝑆), the calculated anisotropic ther-mal parameters are given in the Trueblood notation, such as
Ui j= Ti j+ Gi jklLkl+ Hi jklSkl+ D2Ω2ninj, (2)
where 𝐺, 𝐻 and D are geometrical parameters. The last term corresponds to any additional intra-libration (Ω ) around a
cho-sen axis. The rigid-body fit suggests two independent libera-tion axes around bonds C(10)–N(10) and C(7)–C(6). The ther-mal motion of the H atoms is considered to consist of two con-tributions. The first is due to the rigid molecular motion and the second is from the C–H vibrations.[25–27]The 𝑇 , 𝐿 and 𝑆 obtained from the least-square fitting are given in Table7.
The C–H bond frequencies of the molecule were taken from Baert et al.[28]The corresponding mean-square displace-ments for the H atoms in phenyl group were 0.0056 ˚A2, 0.014 ˚A2 and 0.025 ˚A2 for bond stretching, in-plane bend-ing and out-of-plane bendbend-ing, respectively. While, for the H atoms of the methyl group, the internal vibration amplitudes used were 0.0057 ˚A2, 0.0116 ˚A2and 0.0224 ˚A2. The results
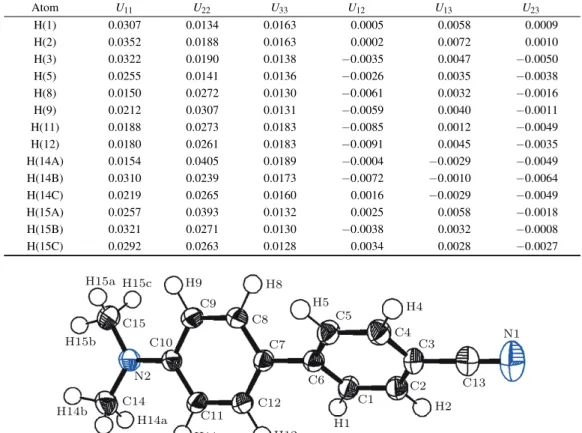
of the thermal motion parameters of the H atoms are summa-rized in Table8. The ellipsoids of the different atoms repre-senting their thermal motion described above are shown, using the ORTEPIII[29]diagram, in Fig.3.
Table 5. Atomic displacement parameters in units of ˚A2.
Atom U11 U22 U33 U12 U13 U23 N(1) 0.0331 (10) 0.0392 (11) 0.0148 (7) 0.0026 (8) 0.0081 (7) − 0.0006 (7) N(2) 0.0164 (7) 0.0286 (9) 0.0102 (5) − 0.0055 (5) 0.0053 (5) − 0.0005 (5) C(1) 0.0176 (7) 0.0156 (7) 0.0127 (6) − 0.0006 (5) 0.0077 (5) 0.0008 (5) C(2) 0.0169 (7) 0.0155 (7) 0.0143 (6) − 0.0014 (5) 0.0070 (6) 0.0003 (5) C(3) 0.0164 (7) 0.0187 (7) 0.0103 (6) − 0.0002 (5) 0.0056 (5) − 0.0002 (5) C(4) 0.0174 (7) 0.0164 (7) 0.0134 (6) − 0.0020 (5) 0.0071 (5) − 0.0019 (5) C(5) 0.0183 (7) 0.0143 (6) 0.0131 (6) − 0.0021 (5) 0.0075 (5) − 0.0005 (5) C(6) 0.0148 (7) 0.0144 (7) 0.0128 (6) − 0.0010 (5) 0.0073 (5) − 0.0002 (5) C(7) 0.0149 (7) 0.0137 (6) 0.0120 (6) − 0.0012 (5) 0.0068 (5) 0.0000 (5) C(8) 0.0142 (6) 0.0202 (7) 0.0134 (6) − 0.0034 (5) 0.0067 (5) 0.0001 (5) C(9) 0.0161 (7) 0.0182 (7) 0.0139 (6) − 0.0032 (5) 0.0083 (5) − 0.0001 (5) C(10) 0.0134 (6) 0.0151 (6) 0.0123 (5) − 0.0006 (4) 0.0062 (5) − 0.0005 (5) C(11) 0.0170 (7) 0.0193 (7) 0.0120 (6) − 0.0034 (5) 0.0075 (5) 0.0006 (5) C(12) 0.0155 (7) 0.0186 (7) 0.0131 (6) − 0.0035 (5) 0.0068 (5) 0.0001 (5) C(13) 0.0192 (8) 0.0200 (8) 0.0144 (7) 0.0024 (6) 0.0075 (6) 0.0009 (6) C(14) 0.0159 (7) 0.0278 (8) 0.0139 (6) − 0.0018 (6) 0.0056 (5) − 0.0005 (6) C(15) 0.0203 (7) 0.0271 (8) 0.0140 (6) − 0.0010 (6) 0.0101 (6) 0.0017 (6) Table 6. Matrix for differences in MSDAs (mean square displacements of atoms). Values listed are 104
MSDAs for column atom minus that for row atom, underlined values correspond to chemical bonds. C15 C14 C13 C12 C11 C10 C9 C8 C7 C6 C5 C4 C3 C2 C1 N2 N1 −4 4 13 −4 −6 −12 −4 −6 2 −7 −16 −17 −12 −15 −4 −16 N2 1 22 29 4 5 4 28 10 19 9 26 8 5 9 16 C1 −5 −1 15 −4 13 −17 −7 11 −8 4 −9 2 −6 7 C2 2 9 20 5 −2 −9 1 13 3 −3 −17 15 8 C3 13 17 25 12 9 −1 10 12 14 4 −10 8 C4 12 14 −2 15 10 −4 7 8 12 15 10 C5 −4 −4 15 3 −11 −24 −10 −7 −14 9 C6 8 10 20 4 0 −5 5 19 10 C7 −5 1 11 5 −6 −14 −10 17 C8 10 12 14 −12 −2 −5 6 C9 5 −7 15 5 3 13 C10 −6 16 25 −4 4 C11 −8 11 16 1 C12 1 9 13 C13 −12 −6 C14 −7
Table 7. Rigid body vibration parameters of the 𝑇 , 𝐿 and 𝑆 tensors. T (rad2) L (A2 )
( )
0.00136 0.00006 -0.00008 0.00037 -0.00005 0.00044( )
0.01089 0.00203 -0.00031 0.01029 -0.00013 0.01289 S (radA)( )
0.00029 0.00015 0.00014 -0.00001 -0.00038 0.00003 0.00000 0.00010 0.00000Table 8. The thermal vibration parameters for the H atoms calculated from the 𝑇 𝐿𝑆 group tensors plus the internal C–H bond vibration. Atom U11 U22 U33 U12 U13 U23 H(1) 0.0307 0.0134 0.0163 0.0005 0.0058 0.0009 H(2) 0.0352 0.0188 0.0163 0.0002 0.0072 0.0010 H(3) 0.0322 0.0190 0.0138 −0.0035 0.0047 −0.0050 H(5) 0.0255 0.0141 0.0136 −0.0026 0.0035 −0.0038 H(8) 0.0150 0.0272 0.0130 −0.0061 0.0032 −0.0016 H(9) 0.0212 0.0307 0.0131 −0.0059 0.0040 −0.0011 H(11) 0.0188 0.0273 0.0183 −0.0085 0.0012 −0.0049 H(12) 0.0180 0.0261 0.0183 −0.0091 0.0045 −0.0035 H(14A) 0.0154 0.0405 0.0189 −0.0004 −0.0029 −0.0049 H(14B) 0.0310 0.0239 0.0173 −0.0072 −0.0010 −0.0064 H(14C) 0.0219 0.0265 0.0160 0.0016 −0.0029 −0.0049 H(15A) 0.0257 0.0393 0.0132 0.0025 0.0058 −0.0018 H(15B) 0.0321 0.0271 0.0130 −0.0038 0.0032 −0.0008 H(15C) 0.0292 0.0263 0.0128 0.0034 0.0028 −0.0027 H15a H15c H15b H14b H14c H14a H11 C11 C12 C7 C5 C4 C3 N1 C2 C6 C1 C13 H1 H2 H4 C8 H12 C15 C14 H9 H8 H5 N2 C9 C10
Fig. 3. (color online) ORTEPIII diagram of the DMACB molecule with atomic labeling scheme.
6. Electron-density maps
The aspherical atom model used in multipolar refinement gives structure factor phases closer to the true phases than the spherical or independent atom model does.[30,31]This enables the mapping of the electron density by Fourier synthesis in various ways using the program XDGRAPH implemented in the XD program package.[15]
The experimental density deformation map is shown in Fig.4, from which we can notice the absence of the density on the atomic sites and the appearance of all the bond density peaks. This map confirms the high quality of the data sets and the efficiency of the formalism used for the data processing as proposed by Blessing.[18]This visualization is obtained us-ing the calculated multipole phases with the observed structure factors Fobs(h)
δρexp(r) = 1
V
∑
h[|Fobs(h)| eiφmul
− |Fsph(h)| eiφsph] e−2π ihr, (3)
where Fsph(h) is computed with atomic positions and thermal
parameters. The experimental density map from high-order re-finement is ρexp= ρo− ρsph, where ρois the observed electron
density and ρsph is the calculated electron density using the
atomic parameters obtained from the high-order refinement. We have explored four planes to visualize the electron density distribution: the plane of the aromatic cycle con-taining the C(1), C(2), C(3), C(4), C(5) and C(6) atoms; the plane of the second aromatic cycle containing the C(7), C(8), C(9), C(10), C(11) and C(12) atoms; the third plane formed by the elctro-donor group (amino dimethyl); and the last plane containing the elctro-acceptor goup (cyano). Fig-ure4gives the different maps cited above, all contour intervals are 0.05 e· ˚A−3.
We observe that the electron density distribution is almost centered in the middle of the chemical bonds. We also notice that the peaks (Fig.4(d)) of the electron density in the connec-tion N(2)–C(14) and N(2)–C(15) are centered towards the ni-trogen N(2) backing the electro donor character of the methyl
group. The symmetrical electron distribution along both sides of the C(13)–N(1) axis shows clearly the multi bonding aspect of the C(13)–N(1) chemical bond.
Fig. 4. (color online) Deformation density map with a contour interval of 0.05 e· ˚A−3, positive density in red and negative density in blue: (a) the plane of the first aromatic cycle; (b) the plane of the second aromatic cycle; (c) the plane of the cyano group; (d) the plane of dimethyl amino group.
7. Conclusion
The ab initio theoretical structure investigation leads to an optimized molecule with bond lengths and bond angles closer to the X-ray experiment results. No significant struc-tural changes are observed compared to the previous results obtained at room temperature. However, the thermal motion analysis using the Hirshfeld rigid-bond test shows the advan-tages of the very low temperature data collection. The atomic motions have been significantly reduced. The maximum dis-crepancy is only 0.0005 ˚A2after the multipolar refinement.
The multipolar model of Hansen and Coppens allows us to obtain the electron charge density function. In order to check the quality of our analysis, we have used the obtained density function to visualize the electron charge density distri-bution around the different atoms.
We have explored systematically the main molecule planes. The different sections show clearly the accumula-tion of the electron charge density along the chemical bond-ing. The oxygen lone pairs have been perfectly localized. The good quality of the obtained results can only confirm the accu-racy of the obtained charge density function, which will lead us in our next step in a forthcoming paper to the calculation
of the molecular dipole moment and the electrostatic potential around the molecule in order to confirm the nature of electron charge transfer of the DMACB compound.
References
[1] Bredas J L, Adant C, Tackx P, Persoons A and Pierce B M1994 Chem. Rev.94 243
[2] He M, Leslie T M, Sinicropi J A, Garner S M and Reed L D2002 Chem. Mater.14 4669
[3] Locatelli D, Quici S, Roberto D and De Angelis F2005 Chem. Com-mun.43 5405
[4] Kang H, Facchetti A, Jiang H, Cariati E, Righetto S, Ugo R, Zuccaccia C, Macchioni A, Stern C L, Liu Z, Ho S T, Brown E C, Ratner M A and Marks T J2007 J. Am. Chem. Soc. 129 3267
[5] Hu Y Y, Sun S L, Zhong R L, Xu H L and Su Z M2011 J. Phys. Chem. C115 18545
[6] Zyss J 1994 Molecular Nonlinear Optics: Materials, Physics and De-vices(New York: Academic Press)
[7] Nalwa H and Miyata S 1996 Nonlinear Optics of Organic Molecules and Polymers(New York: CRC Press)
[8] Ledoux I and Zyss J 1997 Molecular Nonlinear Optics: Fundamentals and Applications(Khoo I C, Simoni F, Umeton C, Ed.) pp. 1–48 [9] Andraud C, Zabulon T, Collet A and Zyss J1999 Chemical Physics
245 243
[10] Zhou Z J, Li X P, Ma F, Liu Z B, Li Z R, Huang X R and Sun C C2011 Chem. Eur. J.17 2414
[11] Bureˇs F, Schweizer W B, May J C, Boudon C, Gisselbrecht J P, Gross M, Biaggio I and Diederich F2007 Chem. Eur. J. 13 5378
[12] Bureˇs F, Schweizer W B, Boudon C, Gisselbrecht J P, Gross M and Diederich F2008 Eur. J. Org. Chem. 6 994
[13] May J C, Biaggio I, Bureˇs F and Diederich F2007 Appl. Phys. Lett. 90 251106
[14] Bureˇs F, Pytela O and Diederich F2009 J. Phys. Org. Chem. 22 155
[15] Zyss J, Ledoux I, Bertault M and Toupet E1991 Chemical Physics 150 125
[16] Hansen N K and Coppens P1978 Acta Cryst. A 34 909
[17] Koritsanszky T, Howard S, Richter T, Su Z, Mallinson P R and Hansen N K 2003 XD a Computer Program Package for Multipole Refinement and Analysis of Electron Densities from Diffraction Data(Berlin: Free University of Berlin)
[18] Blessing R H1989 J. Appl. Cryst. 22 396
[19] International Tables for X-ray Crystallography Vol. C 1999 (New York: Kluwer Academic Publishers)
[20] Stewart R F, Davidson E R and Simpson W T1965 J. Chem. Phys. 42 3175
[21] Becker P J and Coppens P1974 Acta Cryst. A 30 129
[22] Frisch M J, Trucks G W, Schlegel H B et al. 2003 Gaussian 03 (Pitts-burgh, Gaussian 03 Revision A.1)
[23] Trueblood K N 1990 Program THMAI1 (Los Angeles: Department of Chemistry and Biochemistry, University of California)
[24] Hirshfeld F L1976 Acta Cryst. A 32 239
[25] Hirshfeld F L1971 Acta Cryst. B 27 769
[26] Hirshfeld F L1977 Theor. Chim Acta 44 129
[27] Hirshfeld F L and Hope H1980 Acta Cryst. B 36 406
[28] Baert F, Schweiss P, Heger G and More M1988 J. Mol. Struct. 178 29
[29] Johnoson C K 1965 ORTEP Program Report ORNL-3794 (Tennessee: Oak Ridge National Laboratory)
[30] Coppens P 1997 X-ray Charge Densities and Chemical Bonding (New York: Oxford)