HAL Id: hal-03174354
https://hal.archives-ouvertes.fr/hal-03174354
Preprint submitted on 19 Mar 2021HAL is a multi-disciplinary open access
archive for the deposit and dissemination of sci-entific research documents, whether they are pub-lished or not. The documents may come from teaching and research institutions in France or abroad, or from public or private research centers.
L’archive ouverte pluridisciplinaire HAL, est destinée au dépôt et à la diffusion de documents scientifiques de niveau recherche, publiés ou non, émanant des établissements d’enseignement et de recherche français ou étrangers, des laboratoires publics ou privés.
Liberalization, Technology Adoption, and Stock
Returns: Evidence from Telecom
Rabah Arezki, Vianney Dequiedt, Rachel Fan, Carlo Rossotto
To cite this version:
Rabah Arezki, Vianney Dequiedt, Rachel Fan, Carlo Rossotto. Liberalization, Technology Adoption, and Stock Returns: Evidence from Telecom. 2021. �hal-03174354�
fondation pour les études et recherches sur le développement international
ATION REC ONNUE D ’UTILITÉ PUBLIQUE . T EN ŒUVRE A VEC L ’IDDRI L ’INITIA TIVE POUR LE DÉ VEL OPPEMENT ET LA GOUVERNANCE MONDIALE (IDGM).
OORDONNE LE LABEX IDGM+ QUI L
’ASSOCIE A U CERDI E T À L ’IDDRI. TTE PUBLIC ATION A BÉNÉFICIÉ D ’UNE AIDE DE L ’É TA T FR ANC AIS GÉRÉE P AR L ’ANR A U TITRE DU PR OGR A MME «INVESTISSEMENT S D ’A VENIR»
TANT LA RÉFÉRENCE «ANR-10-LABX
-14-01».
Liberalization, Technology
Adoption, and Stock Returns:
Evidence from Telecom*
Rabah Arezki, Vianney Dequiedt, Rachel Yuting Fan,
Carlo Maria Rossotto
Rabah Arezki, Chief Economist, African Development Bank, Senior Fellow, Harvard Kennedy School of Government,
Research Fellow, Université Clermont Auvergne, CNRS, CERDI.
Contact: [email protected]
Vianney Dequiedt, Professor, Université Clermont Auvergne, CNRS, CERDI, Scientific Director, FERDI. Contact: [email protected]
Rachel Yuting Fan, Economist, the Chief Economist Office of the Middle East and North Africa at the World Bank. Contact: [email protected]
Carlo Maria Rossotto, Principal Investment Officer, Global Lead Upstream TMT, International Finance Corporation in World Bank Group.
Contact: [email protected]
Abstract
The paper investigates the pace of technology adoption in telecom technology post liberalization and its effect on stock returns using a new global panel dataset. Results are twofold. First, evidence points to the complementarity between telecom liberalization and regulatory independence in driving a sustained pace of technology adoption. Second, results show a positive and economically significant effect of telecom adoption on stock returns pointing to significant spillovers of telecom to the rest of the economy.
Keywords: Liberalization, Technology adoption, Telecom, Regulation, Stock returns. JEL classification: F30, L11, O16.
* We thank Andrea Barone, Olivier Blanchard, Simeon Djankov, Hafez Ghanem, Daniel Lederman, Philippe Le Houerou, Tarek Masoud, Honore Ndoko, Paul Noumba and Lemma Senbet for excellent suggestions and comments. We thank Haytham Abushaban for research support. V. Dequiedt acknowledges sup-port by the LABEX IDGM+ (ANR-10-LABX-14-01) within the program “Investissements d’Avenir” operated by the French National Research Agency (ANR).
Dev
elopment Po
lic
ie
s
W
ork
ing Paper
285
March 2021I. Introduction
A global race over 5G is raging with important ramifications over domestic internet connectivity and global hegemony over technology.1 Economists have long studied cross-country differences in technology adoption and their consequences on economic growth (see Barro and Sala-i-Martin, 1997). To the extent of our knowledge, however, there is little systematic exploration of the telecom sector with a global perspective. Unlike with other general-purpose technologies, the standardized nature of telecom technology allows us to rigorously analyze the historical patterns of technology adoption over the five technology standards from 1G to 5G. Interestingly, waves of telecom liberalization have led to different country outcomes in terms of the degree of sustained technology adoption and economic benefits. The present paper investigates the pace of technology adoption in telecom standards post liberalization and its effects on stock market returns using a new global panel dataset. This paper pays attention to country differences in institutional and policy frameworks and their interplay in explaining different outcomes.
To do so, we construct a novel indicator of the ranking in the adoption of telecom technology standards around the world. It allows us to document that very few countries have achieved a sustained pace of technology adoption in telecom following the liberalization of the sector. Figure 1 shows that the United States have experienced a sustained pace of adoption in telecom technology standards over time. The US have indeed consistently ranked at the very top over the past decades by adopting new standards as early as the latter were released. Interestingly, Latvia has been constantly improving in its ranking of technology adoption after a late start. In contrast, most other countries shown in Figure 1 have been “swinging” in terms of rankings. Indeed, most countries have been falling behind gradually after the liberalization waves in 1990s which have led to initial jumps in rankings—the initial jump capturing the relatively early adoption of a given telecom technology standard.
1 5G is the fifth generation technology standard for broadband cellular networks, which cellular phone companies
began deploying worldwide in 2019, and is the planned successor to the 4G networks which provide connectivity to most current cellphones. See Supplementary Appendix for a detailed discussion.
Figure 1. Evolution of Country Ranking in Adoption of Telecom Standards
Sources: Authors’ own calculation; Spectrum Launched Timeline, Telegeography.
Notes: The panels show the evolution of the indicator of the ranking of technology adoption. A higher value for the indicator for a given country indicates a higher ranking among all countries for a given year in telecom technology adoption. Time of the launch of 1G, 2G, 3G, 4G, and 5G are marked as gray vertical lines for readers’ reference. Details of the construction of this indicator are provided in Section II. Evolution of country rankings in adoption of telecom standards for all countries are provided in Appendix Figure 1.
Results from our more systematic empirical analysis are twofold. First, results show evidence of complementarity between liberalization and regulatory independence in driving a sustained pace of technology adoption. Second, results show positive and economically significant effects of telecom adoption on stock returns pointing to significant spillovers of telecom to the rest of the economy.
Our investigation on telecom industries across the world relates to several strands of literature. The first strand relates to the adoption and diffusion of new technologies. The (mobile) telecom technology possesses the three major characteristics of a general-purpose technology as detailed in Bresnahan and Trajtenberg (1996). The technology is pervasive since most sectors use mobile telecom technology to some extent. It gets improved over time, with five successive generations of the technology having been developed. It creates innovation spawning with many new services becoming possible, for instance geo-localized services. Because they affect the whole economy, understanding the process of adoption and diffusion of general-purpose technologies has been a cornerstone of studies focusing on cross-country differences in growth and total factor productivity patterns. Comin and Hobijn (2009a) have assembled the Cross-Country Historical Adoption Database (CHAT database) to document adoption of major technologies across the world over
0 20 40 60 80 100 rank, reversed 1980q1 1990q1 2000q1 2010q1 2020q1 time United_States 0 50 100 150 rank, reversed 1980q1 1990q1 2000q1 2010q1 2020q1 time Latvia 0 50 100 150 200 rank, reversed 1980q1 1990q1 2000q1 2010q1 2020q1 time Romania 0 50 100 150 200 rank, reversed 1980q1 1990q1 2000q1 2010q1 2020q1 time Pakistan 0 50 100 150 rank, reversed 1980q1 1990q1 2000q1 2010q1 2020q1 time Turkey 0 50 100 150 200 rank, reversed 1980q1 1990q1 2000q1 2010q1 2020q1 time Tunisia
two centuries. Using this database in Comin and Hobijn (2010) they propose an indirect measure of country-specific lags in technology adoption, based on the curvature of productivity.
Interestingly, our focus on the telecom sector allows us to have a direct and more precise measure of technology adoption lags since spectrum award and service launch timelines are documented in the Telegeography database. In Comin and Hobijn (2009b), the authors study the effect of institutional variables that affect the cost of lobbying and erecting barriers to entry on the speed of technology diffusion. They find that the effect is significantly larger when the technology has a close predecessor. They interpret this result as showing the importance of lobbying by incumbents in order to slow down technology diffusion. Our narrow focus on the successive generations of mobile technology allows us to scrutinize the country-specific market structures in that industry and how it affects the incentives to adopt the latest technology. Cervellati et al. (2018) use the CHAT database to analyze the links between democratization, openness to trade and incentives for technology adoption. We share with the two latter references the idea that technology adoption is not only a decision taken by individual firms. In the mobile telecom sector, governments, whether benevolent or captured by specific interests, play a key role.
Accompanying the movement of telecom sector reforms across the world, the literature on the industrial organization of telecom has broadly focused on whether regulation would soon give way to competition policy after liberalization (see for instance Laffont et al., 1997). Stated differently, the literature asked whether a liberalized and mature telecom market provides sustained benefits to society without the need to regulate heavily. Therefore, this literature has taken a normative or positive approach to document the interplay between liberalization, privatization and regulation of the telecom industry. On the normative side, Cramton et al. (2011) or Rey and Salant (2018) have scrutinized spectrum allocation procedures that are common in liberalized mobile telecom markets, and how those procedures can be designed in order to guarantee downstream competition among the operators. On the positive side, cross-country analyses of telecom sector reforms have exploited the market and regulatory tracker data from the International Telecommunication Union (ITU). Privatization coupled with an independent regulation increases telecom performance. Privatization alone has few benefits. Few empirical studies focus on the mobile telecom sector.2 Taking stock of the experience accumulated in the early years of the mobile telecom industry, Gruber and Verboven (2001) analyzed the effects of different choices in terms of regulation of entry and technological standardization on the evolution of the industry. Faccio and Zingales (2017) establish the positive effect of following regulation best-practices, as measured by the ITU regulatory score, on various market efficiency measures. Then they turn to the question of why countries do not systematically follow regulation best-practices. They provide results supporting the regulatory capture theory. To the extent of our knowledge, our paper is the first to exploit the sequence of mobile telecom generations launches to document the dynamic performance of a regulated and very innovative industry.
The paper also relates more generally to a strand of the literature on macroeconomic effect of capital account liberalization and its consequences. Theory and empirical tests show that liberalization has significant effect on the cost of capital, investment, and economic growth. Most prominently, Henry (2000) and Bekaert et al. (2000; 2005) provide evidence of reevaluation of stock prices using natural experiment of liberalization using a sample of emerging market economies. These papers however do not consider the role of the interaction between liberalization and competition and regulatory apparatuses. In this paper, we
2 Wallsten (2001) focuses on Latin American and African Countries for the period 1984-1997. It establishes that
competition is associated with lower prices and better access. Ahmed-Ezzat et al. (2018) study the sequencing of reforms in the case of the Middle East and North African countries. They highlight that creating an independent regulator before privatizing the incumbent is good for facilitating entry of competitors.
use stock returns to evaluate the impact of liberalization of a specific sector—i.e. the telecom sector— complemented by regulatory independence.
The remainder of the paper is organized as follows. Section II presents the data used in our analysis. Section III shows the results from our empirical analysis. Section IV concludes.
II. Data
This section below describes the construction of a new indicator of country rankings of technology adoption in telecom. The section also presents other measures including telecom sector liberalization, foreign participation and quality of regulatory authority. Appendix Table 1 presents the list of variables used in our empirical analysis as well as sources. Appendix Table 2 presents basic descriptive statistics.
Technology adoption ranking
We construct an index of the pace of technology adoption by ranking each country on how quickly they adopt each telecom technology standard. This constructed dataset of ranking is a balanced data for 198 countries for forty years since 1980. We construct the indicator based on the ranking of the speed in technology adoption from 1G through 5G. The source of data is based on Telegeography’s Spectrum Launched Timeline, which lists the date at which each country has adopted a given technology standard. Considering the balanced nature of the panel, the indicator precisely gives the ranking of any given country in the adoption of the telecom technology standard. Appendix Figure 1 shows the evolution of ranking for each country over the past decades.
In the following we illustrate how the indicator is constructed to capture the relative speed/delay in technology adoption. At each point in time, countries are grouped based on the latest standard they have adopted. Countries in group 1 include the ones which have adopted the most advanced standard. Countries in group 2 are the ones which have adopted the second newest standard available to date, and so on and so forth for the other groups. Within each group, countries are ranked in the order they have adopted a given standard. Consider n countries at period t, if say x countries have launched 4G, while y countries have launched 3G. Then in this period, the x countries which have adopted 4G will rank from number 1 to x with the country that first launched 4G being ranked first. The set of y countries only using 3G will rank from
x+1 to x+y, with the country that first adopted 3G ranking number x+1. If in the next period, say t+1, a
new generation becoming available, say 5G, this will move the frontier of technology. In period t+1, the country who first adopts 5G now ranks first, and all other countries’ earlier rankings go down by one notch if they didn’t adopt the standard. As more countries catch up and adopt 5G, countries not adopting new standards will fall further in the ranking pointing the delay in technology adoption. However, the indicator is such that after a given country adopts the latest technology standard, and before another new standard becomes available, that country’s ranking won’t be affected by other countries adopting the same technology afterwards.
Telecom technology standards come in waves going from 1G to 5G. Figure 2 plots the number of countries which have adopted each technology standard. It starts in 1981, when 1G technology standard (the red area) was first adopted in Sweden. It took 14 years for the group of 1G adopter to reach 50 countries, while it took the group which has adopted 2G (the orange area) ten years to reach hundred countries. It took only six years for the group having adopted 4G (the gray area) to reach more than hundred countries. The standards that cover most countries and years (largest area in Figure 2) are 2G and 4G.
Figure 2. Global evolution of telecom technology adoption
Source: Authors’ own calculations; Spectrum Launched Timeline from Telegeography.
Notes: The indicator is constructed as the count of the number of countries that have adopted each technology standard over the years.
Now turning to the regional perspective on the evolution of telecom technology standards.3 Figure 3 shows the evolution of the ranking in adoption of technology standard based on simple averages of countries in each region. North America (NAC) namely US and Canada are leading in terms of the pace of technology adoption and have been steadily at the top of the ranking. Europe and Central Asia region (ECA) had risen in rankings until it steadily reached on average the 60th place. Interestingly, both NAC and ECA have liberalized early and have independent regulatory apparatuses. The Middle East and North Africa region (MNA) have instead been swinging in the rankings. The region has fallen behind since 2008. Sub-Saharan Africa region (SSA) had been stagnant in terms of rankings. The ranking has improved since late 2000s.
3 Regional classification is based on the World Bank.
0 20 40 60 80 100 120 140 160 180 1981 1983 1985 1987 1989 1991 1993 1995 1997 1999 2001 2003 2005 2007 2009 2011 2013 2015 2017 2019 0 1G 2G 2.5G 3G 3.5G 4G 4.5G 5G num be r of c ount ri es
Figure 3. Regional evolution of technology adoption
Sources: Authors’ own calculations; Spectrum Launched Timeline from Telegeography.
Notes: The lines shows the evolution of the simple average of rankings from all member countries. EAP stands for East Asia and Pacific, ECA stands for Europe and Central Asia, LAC stands for Latin America and the Caribbean, MNA stands for Middle East and North Africa, NAC stands for North America, SAR stands for South Asia, and SSA stands for Sub-Saharan Africa.
Liberalization and Foreign participation indicators
In our empirical analysis, to measure liberalization of the telecom sector we use data on month and year for each country when telecom industry was liberalized. Data are from Telegeography, which is defined as the time when competition was instigated into the market. Liberalization is usually done via new legislation, allowing new players to offer services in competition with the incumbents. When countries have liberalized in stages, e.g. local telephony, domestic long distance, and international long distance, we use the date for international liberalization as the actual date for liberalization. The dataset is available for more than 200 economies and the earliest liberalization dates goes to as early as 1984. 4
We also use an indicator of foreign participation to capture the effective liberalization of the telecom sector. We construct a new indicator that combines two datasets from GSMA Intelligence namely the market share
4 United Kingdom, United States, Japan, and Isle of Man.
0 20 40 60 80 100 120 140 160 1981 1984 1987 1990 1993 1996 1999 2002 2005 2008 2011 2014 2017
EAP ECA LAC MNA NAC SSA SAR
rank ing, r ev er s ed
database and groups-ownership database. The market share database provides market share of each telecom operator, and the groups-ownership database provides each operator’s ownership. 5
For each period, we define a group owner as being international, if the owner operates in multiple countries. To be more specific, for each owner, we list all countries for which that group owner has operations through its operators by more than 5 percent. 6 If in a given period, there are more than one country listed in the group owner’ operations, then the owner is considered “international” in that period. Then, foreign participation rate for country 𝑐𝑐 at time 𝑡𝑡 is calculated as follows:
𝑓𝑓𝑐𝑐,𝑡𝑡= � �𝑠𝑠𝑝𝑝,𝑐𝑐,𝑡𝑡× � 𝑛𝑛𝑤𝑤,𝑝𝑝,𝑐𝑐,𝑡𝑡 𝑤𝑤∈𝑊𝑊𝑝𝑝,𝑡𝑡
� 𝑝𝑝∈𝑃𝑃𝑐𝑐,𝑡𝑡
,
where 𝑃𝑃𝑐𝑐,𝑡𝑡 is all operators that have positive market share in country 𝑐𝑐 at time 𝑡𝑡 , and 𝑊𝑊𝑝𝑝,𝑡𝑡 are all international owners of operator 𝑝𝑝 at time 𝑡𝑡. Market share of operator 𝑝𝑝 in country 𝑐𝑐 at time 𝑡𝑡 is denoted by 𝑠𝑠𝑝𝑝,𝑐𝑐,𝑡𝑡, and its ownership to owner 𝑤𝑤 is denoted by 𝑛𝑛𝑤𝑤,𝑝𝑝,𝑐𝑐,𝑡𝑡.
For example, assume that a given country has two operators, A and B, each with a market share of 𝑠𝑠𝐴𝐴 and 𝑠𝑠𝐵𝐵, respectively. Domestic owner 𝐷𝐷𝐴𝐴 owns 𝑑𝑑𝐴𝐴 percent of operator A, international owner 𝐼𝐼𝐴𝐴1 owns 𝑖𝑖𝐴𝐴1 percent, and international owner 𝐼𝐼𝐴𝐴2 owns 𝑖𝑖𝐴𝐴2 percent. Domestic owner 𝐷𝐷𝐵𝐵1 owns 𝑑𝑑𝐵𝐵1 percent of operator B, domestic owner 𝐷𝐷𝐵𝐵2 owns 𝑑𝑑𝐵𝐵2 percent, and international owner 𝐼𝐼𝐵𝐵 owns 𝑖𝑖𝐵𝐵 percent. Then the foreign participation rate in this country is equal to 𝑠𝑠𝐴𝐴× (𝑖𝑖𝐴𝐴1+𝑖𝑖𝐴𝐴2 ) +𝑠𝑠𝐵𝐵×𝑖𝑖𝐵𝐵.
Waves of liberalization in the telecom sector especially in the 1990s for the developing world have led to significant levels of foreign participation. Figure 4 shows that Latin America and the Middle East and Africa have reached amongst the highest level of foreign participation. Regions where domestic telecom operators are dominant in their local markets but yet have a global reach because of their competitiveness have reached lower level of foreign participation. This the case of North America, Western Europe, East Asia and Australia. Other countries which have lowest foreign participation are countries which have limited effective liberalization because of state owned enterprise dominating their local markets. These state-owned enterprises however do not have a global reach as they are not competitive. Figure 5 shows the evolution over time. There is a clear upward trend in foreign participation in the telecom sector, even so we are using data which are only available from 2000 onwards. Latin America and the Caribbean as well as Europe and Central Asia and the Middle East and Africa have had the fastest increases.
5 When ownership data are not available, we researched operators’ ownership structure including whether the owner
is domestic vs. international. We use trustworthy sources including Telegeography, the stock exchange commission, Internet Society, and interviews of telecom experts.
Figure 4. Foreign participation in telecom sectors around the world
Sources: Authors’ own calculations; GSMA Intelligence.
Notes: Foreign participation rate is shown as a percentage of market share as of 2018.
Figure 5. Regional evolution of foreign participation in the telecom sector
Sources: Authors’ own calculations; GSMA Intelligence.
Notes: Foreign participation rate is shown as a percentage of market share. The lines show simple average of foreign participation rate in its member countries.
Regulatory independence
To capture the independence of the telecom regulatory authority, we use data from the International Telecommunication Union regulatory trackers. The data covers 180 countries from 2003 to 2017. We focused specifically on cluster 1 that gathers information on the regulatory authority. The score of this cluster is based on the sum of the score of the answers to ten related questions. Each answer has a full score of 2, such as separate telecom/ICT regulator, autonomy in decision making, accountability, etc... A higher score indicates a more independent regulatory authority. We have this indicator normalized between zero and one when we use it in our regressions for simplicity.
Stock Returns
In our empirical analysis to capture the spillover effects from telecom liberalization we use stock market returns. Stock returns are constructed from MSCI Gross Total Return Index (TRI) for each country denominated in US dollars. These are daily stock returns based on general market price indices taken from Bloomberg, and then averaged over a calendar month. The stock return is the monthly difference of logarithm of the deflated MSCI TRI: log� 𝑅𝑅𝑡𝑡
𝐶𝐶𝑃𝑃𝐶𝐶𝑡𝑡� − log � 𝑅𝑅𝑡𝑡−1
𝐶𝐶𝑃𝑃𝐶𝐶𝑡𝑡−1�, where 𝑅𝑅𝑡𝑡 is the MSCI TRI for a country in time 𝑡𝑡, and 𝐶𝐶𝑃𝑃𝐼𝐼𝑡𝑡 is the US CPI during the same period. We have also constructed the same index for the world to be used as benchmark in our regressions.
III. Empirical analysis
In this section, we present the specification of our empirical analysis, the main results and robustness analysis.
III.1 Specification
In this sub-section, we present the empirical specification to explore the role of policies and institutional framework in driving the pace of telecom technology adoption. We do so within a framework of cross-country panel regressions, specifically with an interaction term of liberalization and regulatory independence. The specification is as follows:
𝑦𝑦𝑐𝑐𝑡𝑡 =𝛽𝛽0+𝛽𝛽1𝑙𝑙𝑖𝑖𝑙𝑙𝑐𝑐𝑡𝑡−1+𝛽𝛽2𝑟𝑟𝑟𝑟𝑟𝑟𝑐𝑐𝑡𝑡−1+𝛽𝛽3(𝑙𝑙𝑖𝑖𝑙𝑙𝑐𝑐𝑡𝑡−1×𝑟𝑟𝑟𝑟𝑟𝑟𝑐𝑐𝑡𝑡−1) +𝛽𝛽4𝑋𝑋𝑐𝑐𝑡𝑡+𝛽𝛽5𝐺𝐺𝑐𝑐𝑡𝑡+𝜇𝜇𝑐𝑐+𝜈𝜈𝑡𝑡+𝜀𝜀𝑐𝑐𝑡𝑡 (1) where 𝑦𝑦𝑐𝑐𝑡𝑡is dependent variable. The dependent variable is the opposite of ranking which constitutes our technology adoption score. This score ranges from -198 to -1, and the higher score the faster a country adopts new technology. 𝑙𝑙𝑖𝑖𝑙𝑙𝑐𝑐𝑡𝑡−1 is a dummy variable that takes the value of one in the years after liberalization and zero otherwise, as discussed in Section II. We use the lagged liberalization to capture the effect of liberalization in the year before on technology adoption. 𝑟𝑟𝑟𝑟𝑟𝑟𝑐𝑐𝑡𝑡−1 is the score of telecom sector regulation in the previous period, and captures the effect of a more capable regulatory authority one year before the standard adoption. Our main variable of interest is the interaction between the two variables,
𝑙𝑙𝑖𝑖𝑙𝑙𝑐𝑐𝑡𝑡−1×𝑟𝑟𝑟𝑟𝑟𝑟𝑐𝑐𝑡𝑡−1, in order to investigate how the complementarities between liberalization and regulatory independence affect technology adoption in the next period.
The empirical model encompasses different panel specifications. The vector 𝑋𝑋𝑐𝑐𝑡𝑡 denotes possible inclusion of time-varying country-level covariates, 𝐺𝐺𝑐𝑐𝑡𝑡 denotes the technology generation fixed effect, and 𝜇𝜇𝑐𝑐 and 𝜈𝜈𝑡𝑡 are country and time fixed effects, respectively. The technology generation fixed effect is included to capture different distances in technology spectrum, and thus different difficulties to encounter in adopting different generations of telecom technology. And the country and time fixed effects capture, respectively, country and time specific factors that affect technology adoption.
We further explore the impact of foreign participation and regulation on technology adoption. We do so by replacing the liberalization in equation (1) with foreign participation, and the interaction term of foreign participation and regulatory independence to capture the effect of foreign participation after liberalization on technology adoption.
Next, we explore the relationship of technology adoption in telecom sector and stock returns. We do so with a cross-country panel regression of monthly stock market performance on technology adoption. The magnitude and statistical significance of stock market returns during the liberalization window are evaluated by estimating the following panel regression:
𝑅𝑅𝑐𝑐𝑡𝑡=𝛽𝛽0+𝛽𝛽1𝑎𝑎𝑑𝑑𝑝𝑝𝑡𝑡𝑤𝑤𝑖𝑖𝑛𝑛𝑐𝑐𝑡𝑡+𝛾𝛾1𝑅𝑅𝑐𝑐𝑡𝑡−1+𝛾𝛾2𝑅𝑅𝑡𝑡𝑊𝑊𝑊𝑊𝑊𝑊𝑊𝑊𝑊𝑊+𝛾𝛾3𝐹𝐹𝑐𝑐𝑡𝑡+𝜇𝜇𝑐𝑐+𝜀𝜀𝑐𝑐𝑡𝑡 (2)
where the dependent variable 𝑅𝑅𝑐𝑐𝑡𝑡 is the stock market return, measured by the log difference of CPI deflated monthly average of daily index of MSCI Gross Total Return, as discussed in Section II. Our main variable of interest 𝑎𝑎𝑑𝑑𝑝𝑝𝑡𝑡𝑤𝑤𝑖𝑖𝑛𝑛𝑐𝑐𝑡𝑡 indicates the event of technology adoption, and takes value of one in each of the eight months from T* - 7 to T* associated with country 𝑐𝑐’s telecom technology adoptions. Hence, this variable captures the average change in monthly stock market performance during the eight-month technology adoption window. 𝑅𝑅𝑡𝑡𝑊𝑊𝑊𝑊𝑊𝑊𝑊𝑊𝑊𝑊 is the world stock returns during the same month, introduced as a benchmark control variable that changes over time. Following Henry (2000), we have also added macroeconomic fundamentals 𝐹𝐹𝑐𝑐𝑡𝑡 to control for expected future cash flows. The macroeconomic fundamental variables include monthly growth rate of exchange rate, consumer price index, and political risk rating, respectively, in period t-1, t, and t+1. 𝜇𝜇𝑐𝑐 is the country fixed effects, and 𝜀𝜀𝑐𝑐𝑡𝑡 is a country- and time-specific error term. To avoid potential endogeneity of technology adoption, we have further explored the relationship between technology adoption and stock market returns, with the technology adoption window in equation (2) instrumented by lagged liberalization, lagged telecom sector regulation score, and their interactions. III.2 Baseline regression results
In this sub-section we present our main results.
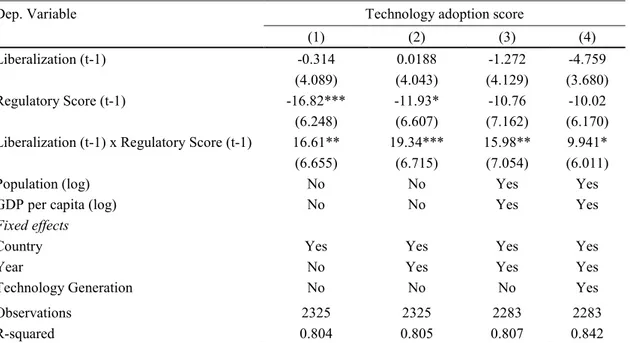
The regression results in Table 1 show the importance of the complementarity between liberalization and the independence of the telecom regulatory authority—captured by the interaction term—in driving faster pace of technology adoption in telecom.7 The liberalization dummy is based on change in policy described in the data section. Instead, taken individually the coefficient associated with liberalization and regulatory independence are either not statistically significant or not robust over the different specification. Table 1 reports the estimated coefficients along with their robust standard errors. All regressions control for country
fixed effects, columns (2) and (3) also control for year-fixed effects, and column (4) controls for the fixed effect of the generation of the technology standard adopted.
Column (1) indicates that the interaction term is positive and statistically significant. The result from column (1) is robust to controlling for both country and year fixed effects as shown in column (2). The coefficient in column (2) is indeed higher coefficient than column (1). The coefficient associated with the interaction term of 19.34 implies that for a country which has liberalized its telecom sector, an increase by one standard deviation of 0.3 in the regulatory score can boost technology adoption score by 2 in the ranking. Columns (3) and (4) control for the logarithm of population and logarithm of gross domestic product (GDP) per capita. The coefficients associated with these control variables appear highly significant and with positive signs indicating they are associated with a higher pace of technology adoption. Column (3) confirm that the interaction term associated with liberalization and regulatory independence is significant economically and statistically. As we further introduce the fixed effect associated with the generation of technology standard adopted, the coefficient associated with the interaction term remains statistically significant at 10% level. Instead, the individual coefficient associated with liberalization and regulatory independence are not statistically significant. The coefficient associated with the interaction of 9.9 in column (4) indicates that, an improvement in regulatory score by 0.3 can boost technology adoption by 3, i.e. outpacing 3 countries in the ranking of technology adoption. All in all, the complementarity between liberalization and regulatory independence appear robust in driving the pace of technology adoption. Table 1. Technology Adoption, Liberalization and Regulatory Independence
Dep. Variable Technology adoption score
(1) (2) (3) (4)
Liberalization (t-1) -0.314 0.0188 -1.272 -4.759
(4.089) (4.043) (4.129) (3.680)
Regulatory Score (t-1) -16.82*** -11.93* -10.76 -10.02
(6.248) (6.607) (7.162) (6.170)
Liberalization (t-1) x Regulatory Score (t-1) 16.61** 19.34*** 15.98** 9.941*
(6.655) (6.715) (7.054) (6.011)
Population (log) No No Yes Yes
GDP per capita (log) No No Yes Yes
Fixed effects
Country Yes Yes Yes Yes
Year No Yes Yes Yes
Technology Generation No No No Yes
Observations 2325 2325 2283 2283
R-squared 0.804 0.805 0.807 0.842
Notes: Coefficient estimates from ordinary least squares regressions at the country-year level, based on annual data from 2004 to 2018. Robust standard errors are given in parentheses. * p<0.1, ** p<0.05, *** p<0.01. The dependent variable is the technology adoption score, where a higher number means a better ranking and faster in technology adoption. Liberalization is a dummy variable, measured as 0 before the year of liberalization and 1 on the year of liberalization and thereafter. Regulatory Score is an indicator between 0 and 1, where 1 indicates highest score in ICT regulatory authority. The main variable of interest in all columns are the regulatory score interacted with liberalization.
Constants are included in all columns. Regression in column (1) controls for country fixed effects; regressions in
addition, the fixed effect of the generation of technology that was adopted. See Appendix Table 3 for the country list of the regression in column (1).
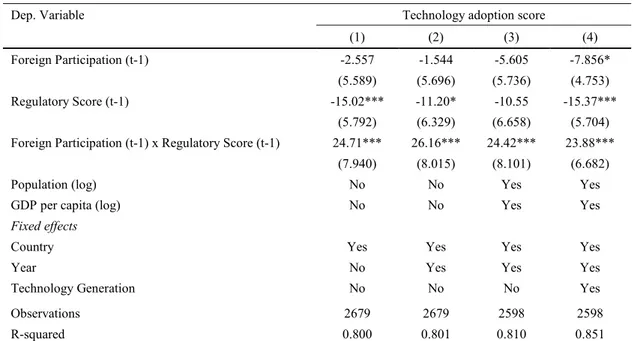
In Table 2 we present results using foreign participation to capture effective liberalization instead of the dummy for the (de jure) liberalization episode.8 Regressions results presented in column (1) to (4) in table 2 confirm the importance of the complementarity between liberalization and regulatory independence in driving the pace of technology adoption. The coefficient associated with the variable of interest that is foreign participation interacted with the regulatory score is positive and highly statistically significant at the 1 percent level in all four columns.
Results presented in table 2 indicate that taken individually foreign participation per se does not foster technology adoption. In all columns, the individual effect of foreign participation and regulatory independence are negative and at time statistically significant in columns (1), (2) and (4). Only when combined with regulatory independence does foreign participation increase technology adoption.
The effect of the interaction is quantitatively large. Take for instance column (3) where for a country whose foreign participation is equal to the sample of average of 0.7 that is 70 percent of the market is owned by international operators, an increase in regulatory score by a standard deviation would boost the ranking in technology adoption by five notch, i.e. outpacing five peer countries in technology adoption. For a country with hundred percent market share owned by foreign operators, the impact of an improvement in regulatory score would obviously be even larger. An increase in regulatory score by a standard deviation would boost the technology ranking by seven, thus outpacing seven peer countries in the ranking of technology adoption. Regression results presented in column (4) shows a negative effect of foreign participation in technology adoption, while only a strong regulation can turn the effect of foreign participation into a net positive.
Table 2. Technology Adoption, Foreign participation and Regulatory Independence
Dep. Variable Technology adoption score
(1) (2) (3) (4)
Foreign Participation (t-1) -2.557 -1.544 -5.605 -7.856*
(5.589) (5.696) (5.736) (4.753)
Regulatory Score (t-1) -15.02*** -11.20* -10.55 -15.37***
(5.792) (6.329) (6.658) (5.704)
Foreign Participation (t-1) x Regulatory Score (t-1) 24.71*** 26.16*** 24.42*** 23.88***
(7.940) (8.015) (8.101) (6.682)
Population (log) No No Yes Yes
GDP per capita (log) No No Yes Yes
Fixed effects
Country Yes Yes Yes Yes
Year No Yes Yes Yes
Technology Generation No No No Yes
Observations 2679 2679 2598 2598
R-squared 0.800 0.801 0.810 0.851
Notes: Coefficient estimates from ordinary least squares regressions at the country-year level, based on annual data from 2004 to 2018. Robust standard errors are given in parentheses. * p<0.1, ** p<0.05, *** p<0.01. The dependent variable is the technology adoption score, where a higher number means a better ranking and faster in technology adoption. Foreign participation is internationally owned market share, calculated by the product of its market share and its share of ownership that is owned internationally. Regulatory Score is an indicator between 0 and 1, where 1 indicates highest score in ICT regulatory authority. The main variable of interest in all columns are the regulatory score, interacted with foreign participation. Constants are included in all columns. Regression in column (1) controls for country fixed effects; regressions in column (2) to (4) control for both country and year fixed effects; while regression in column (4) controls for, in addition, the fixed effect of the generation of technology that was adopted. See Appendix Table 4 for the country list of the regression in column (1).
In Table 3, we explore the relationship between technology adoption and stock market returns using monthly data. The technology adoption window is a dummy variable for the event window of the adoption of a new standard in telecom technology following the empirical strategy used for capital account liberalization by Henry (2000). The event window begins seven months prior to the adoption month and ends in the adoption month. To fix ideas for a technology adopted in September 2005, the event window begins in February 2005 and ends in September 2005.
Country fixed effects are introduced in all regressions. Column (1) controls only for country fixed effects. A lagged dependent variable is introduced in columns (2) to (4). A variable capturing world stock returns is introduced in column (3)-(4) as a benchmark. It measures average stock market movements during the month. Following Henry (2000), macroeconomic fundamentals are also introduced in the last column, and includes monthly growth rate of exchange rate, consumer price index, and political risk rating, respectively, in period t-1, t, and t+1.
Columns (1) to (4) show a statistically significant relationship between technology adoption and stock market returns. This is true even after controlling for world stock returns and lagged dependent variable. The impact is statistically significant and robust across the columns. Adopting a new generation of
technology is associated with a 0.5 percent increase in stock returns for at least seven months everything else being equal.
Table 3.OLS: Stock returns and Technology Adoption
Dep. Variable Stock Returns
(1) (2) (3) (4)
Technology Adoption Window 0.00362** 0.00313** 0.00497*** 0.00473***
(0.00156) (0.00151) (0.00125) (0.00144)
World Stock Returns 0.964*** 0.980***
(0.0143) (0.0158)
Country Fixed Effects Yes Yes Yes Yes
Lag Dependent No Yes Yes Yes
Macro Fundamentals No No No Yes
Observations 17320 17270 17270 11424
R-squared 0.00187 0.0473 0.361 0.428
Notes: This table presents coefficients from OLS regressions. The regressions are performed using stock market data from February 1980 to November 2019. Dependent is based on monthly average of daily index of MSCI Gross Total
Return denominated in US dollars: log�𝑅𝑅𝑡𝑡
𝐶𝐶𝑃𝑃𝐶𝐶𝑡𝑡� − log �
𝑅𝑅𝑡𝑡−1
𝐶𝐶𝑃𝑃𝐶𝐶𝑡𝑡−1�, where 𝑅𝑅𝑡𝑡 is the MSCI Gross Total Return in local market
at time 𝑡𝑡, and 𝐶𝐶𝑃𝑃𝐼𝐼𝑡𝑡 is the consumer price index at the same period. Technology adoption window is a dummy variable
for the event window of the adoption of a new generation in telecom technology. The event window begins seven months prior to the adoption month and ends in the adoption month. Constants are included in all columns. A lagged dependent variable is introduced in column (2) to (4) to reduce the occurrence of autocorrelation. World stock returns is introduced as benchmark control variables in column (3) to (4), based on monthly average of daily return of MSCI Total Return Index of World. Macroeconomic fundamentals are introduced in column (4), that includes monthly
growth rate of exchange rate, consumer price index, and political risk rating, respectively, in period 𝑡𝑡 − 1, 𝑡𝑡, and 𝑡𝑡 +
1. All regressions control for country fixed effects. Robust standard errors in parentheses. *, ** and *** denote significance at 10%, 5%, and 1%, respectively.
In Table 4, we instrument the technology adoption window with instruments consisting in liberalization, regulatory score, and their interaction, similarly to the right-hand side variables used in Table 1. The instrumental variable regression (IV) allows us to ascertain the causal relationship going from technology adoption to stock returns. Appendix Table 5 shows the first stage of the IV regression indicating the instruments used in the regression are strong. Columns (1) to (4) indicate that adoption of latest
technology standard cause a significant increase in stock returns. The coefficient in column 4 in Table 3 is over ten times higher than the one presented in column 4 in Table 3. The causal effect thus appears much larger than the one obtained using ordinary least square.
Table 4. Instrumental Variable Regressions: Technology Adoption and Stock Returns
Dep. Variable Stock Returns
(1) (2) (3) (4)
Technology Adoption Window 0.129*** 0.0880*** 0.0619*** 0.0660***
(0.0207) (0.0185) (0.0148) (0.0122)
World Stock Returns 1.107*** 1.093***
(0.0198) (0.0221)
Country Fixed Effects Yes Yes Yes Yes
Lag Dependent No Yes Yes Yes
Macro Fundamentals No No No Yes
Observations 8700 8700 8700 6300
R-squared -0.377 -0.0704 0.424 0.481
Note: This table presents coefficients from instrumental-variables OLS regressions, where technology adoption window is instrumented, with excluded instruments being period lagged liberalization, one-period lagged regulatory score, and their interactions. Country fixed effects and constants are included each column. A lagged dependent variable is introduced in column (2) to (4) to reduce the occurrence of autocorrelation. World stock returns is introduced as benchmark control variables in column (3) to (4), based on monthly average of daily return of MSCI Total Return Index of World. Macroeconomic fundamentals are introduced in column (4), that includes monthly growth rate of exchange rate, consumer price index, and
political risk rating, respectively, in period 𝑡𝑡 − 1, 𝑡𝑡, and 𝑡𝑡 + 1. Robust standard errors in parentheses. *, **
and *** denote significance at 10%, 5%, and 1%, respectively.
III.3 Robustness and additional results
In this sub-section, we present a few robustness checks and additional results. First, we use foreign direct investment in telecom as a share of total investment in the sector as a proxy for liberalization. Appendix Table 6 shows that the interaction between foreign direct investment-based measure of liberalization and regulatory independence drive the pace of technology adoption. Indeed, columns (1) to (4) shows that the coefficient associated with the interaction is statistically significant across the regressions. Taken
separately foreign direct investment-based measure of liberalization and regulatory independence in columns (1) to (4) appear either negative or statistically insignificant. Whether we use the de jure measure of liberalization or effective measure of liberalization such as measures based on foreign participation and on foreign direct investment confirm our main results.
Additional robustness checks include regressions exploring the relationship between stock returns and technology adoption controlling for informational technology (IT) stock sub-index returns. This allows us to test whether the technology adoption aggregate stock return could be driven exclusively by IT sector. Appendix Table 7 shows the robustness our main results that technology adoption is associated with an increase in stock returns even when controlling for IT sub-index. The coefficient associated with technology adoption is indeed statistically significant and positive. Appendix Table 8 presents the instrumental variable regressions also controlling for IT stock sub-index. Results confirm the causal
relationship running from technological adoption to stock returns.9 Telecom technology adoption has thus spillover on stock returns beyond the IT sector.
To further explore the spillover effect of telecom technology standards on other stock sub-indices. Appendix Table 10 shows that technology adoption affect other sectors such as “financials”, “industrials” and “health care”. Appendix Tables 11-17 present individual tables with a variety of specification that help ascertain the robustness of spillovers of telecom technology adoption on the afore mentioned sectors using stock sub-indices. In addition, several columns indicate that the effect of telecom technology adoption and “materials” and “consumer staples” sectors. All in all, telecom technology adoption is associated with spillovers which are far ranging.
IV. Conclusion
The paper investigated the pace of technology adoption in telecom technology post liberalization and its effect on stock returns using a new global panel dataset. Results are twofold. First, evidence points to the complementarity between telecom liberalization and regulatory independence in driving a sustained pace of technology adoption. Second, results show a positive and economically significant effects of telecom adoption on stock returns pointing to significant spillovers of telecom to the rest of the economy.
While the adoption of 5G standards is accelerating, we are the very onset of radical changes in the technology landscape with ramifications well beyond economics. The strategic rivalry between the US and China will likely lead to an effective breakup of the internet. Further research in the interplay between the geopolitics around 5G and its economic implications would shed light on how technology will matter differently going forward.
9 Appendix Table 9 presents the first stage of the instrumental variable regression associated with the second
References
Arezki,R. Yuting Fan, R., Nguyen H., 2019, “Technology Adoption and the Middle Income Trap. Lessons from the Middle East and East Asia”, World Bank Policy Research Working Paper, 8870, The World Bank.
Bekaert, Geert and Campbell R. Harvey. 2000. “Foreign Speculators and Emerging Equity Markets,” Journal of Finance, 55(2), 565-613.
Bekaert, Geert, Campbell Harvey and Christian Lundblad. 2005. “Does Financial Liberalization Spur Growth?” Journal of Financial Economics, 77(1), 3-55.
Barro, Robert J & Sala-i-Martin, Xavier, 1997. "Technological Diffusion, Convergence, and Growth," Journal of Economic Growth, Springer, vol. 2(1), pages 1-26, March.
Talal Ahmad and Lakshminarayanan Subramanian. 2017. Virtual Cellular ISPs. In Proceedings of the 3rd Workshop on Experiences with the Design and Implementation of Smart Objects (SMARTOBJECTS '17). ACM, New York, NY, USA, 35-40. DOI: https://doi.org/10.1145/3127502.3127515
Bresnahan, T.F., and M. Trajtenberg (1996). “General purpose technologies: ‘engines of growth’?”, Journal
of Econometrics, 65, 83–108
Cave, M (2018) “How disruptive is 5G?”, Telecommunications Policy, Volume 42, Issue 8, 2018, Pages 653-658, ISSN 0308-5961, https://doi.org/10.1016/j.telpol.2018.05.005.
Cervellati, M., Naghavi, A. and F. Toubal (2018). “Trade Liberalization, Democratization and Technology Adoption”. Journal of Economic Growth, 23, p145-173.
Comin, D. and B. Hobijn, (2009a). “The CHAT Dataset”, Harvard Business School Working Paper, 10. Comin, D. and B. Hobijn (2009b). “Lobbies and Technology Diffusion”. The Review of Economics and
Statistics, 91(2), p229-244.
Comin, D. and B. Hobijn (2010). “An Exploration of Technology Diffusion”. American Economic Review, 100, p2031-2059.
R. H. Coase, “The Federal Communications Commission, 1959”, The Journal of Law & Economics, Vol. 2, pp. 1-40
Crandall, Robert W. 2019. “The Dubious Antitrust Argument for Breaking Up the Internet Giants.” Review
of Industrial Organization 54, no. 4: 627–49.
Egert, Balazs, “Infrastructure Investment in Network Industries: The Role of Incentive Regulation and Regulatory Independence (May 1, 2009)”. CESifo Working Paper Series No. 2642. Available at SSRN: https://ssrn.com/abstract=1400615
Jamison, M. 2019, “Applying antitrust in digital markets: Foundations and approaches”, AEI Economics
Working Paper 2019-18, available at:
https://www.aei.org/wp-content/uploads/2019/11/Jamison-Digital-Markets-WP.pdf
Furman, Jason, Diane Coyle, Amelia Fletcher, Derek McAuley, and Philip Marsden. 2019. “Unlocking Digital Competition: Report of the Digital Competition Expert Panel. London: UK Government Publications.
Gomez, Marcela and Weiss, Martin B. H. and Lehr, William and McHenry, Giulia, Spectrum Valuation: Implications for Sharing and Secondary Markets (March 16, 2018). TPRC 46: The 46th Research Conference on Communication, Information and Internet Policy 2018. Available at SSRN: https://ssrn.com/abstract=3142182 or http://dx.doi.org/10.2139/ssrn.3142182
Harald Gruber, “Competition and innovation: The diffusion of mobile telecommunications in Central and Eastern Europe”, Information Economics and Policy, Volume 13, Issue 1, 2001, Pages 19-34,
https://doi.org/10.1016/S0167-6245(00)00028-7.
Harper C. and Deutsch, B. 2019, “Innovation,Verticals, and Beams: Importance of Time-Domain Mastery for 5G-and-Beyond”, Journal of ICT Standardization, vol 7. Issue, 2, https://doi.org/10.13052/jicts2245-800X.727
Haucap, J. & Heimeshoff, Google, Facebook, Amazon, eBay: Is the Internet driving competition or market monopolization? U. Int Econ Econ Policy (2014) 11: 49. https://doi.org/10.1007/s10368-013-0247-6 Henry, Peter Blair. 2000. “Stock Market Liberalization, Economic Reform, and Emerging Market Equity Prices,” Journal of Finance, 55(2), 529-564.
Laffont, J.-J., Rey, P. and J. Tirole (1997). “Competition between Telecommunications Operators”.
European Economic Review, 41, p701-711.
Lee, 2019, Enabling opportunities: 5G, the internet of things, and communities of color, Brookings Institution, Washington, DC, https://www.brookings.edu/research/enabling-opportunities-5g-the-internet-of-things-and-communities-of-color/
William Lehr, Lee W McKnight, “Wireless Internet access: 3G vs. WiFi?”, Telecommunications Policy, Volume 27, Issues 5–6, 2003, Pages 351-370, ISSN 0308-5961, https://doi.org/10.1016/S0308-5961(03)00004-1. (http://www.sciencedirect.com/science/article/pii/S0308596103000041)
Lehr, William; Clark, David; Bauer, Steve (2019) : Regulation when platforms are layered, 30th European Conference of the International Telecommunications Society (ITS): "Towards a Connected and Automated Society", Helsinki, Finland, 16th-19th June 2019, International Telecommunications Society (ITS), Helsinki
Levy ad Spiller, 1994, “The Institutional Foundations of Regulatory Commitment: A Comparative Analysis of Telecommunications Regulation”, The Journal of Law, Economics, and Organization, Volume 10, Issue 2, October 1994, Pages 201–246, https://doi.org/10.1093/oxfordjournals.jleo.a036849
M. Lotfi, and S. Sarkar, “The economics of competition and cooperation between MNOs and MVNOs,” Information Sciences and Systems (CISS), 2017
Marja Matinmikko, Matti Latva-aho, Petri Ahokangas, Veikko Seppanen, 2018, “On regulations for 5G: Micro licensing for locally operated networks”, Telecommunications Policy, 2018
Montes, R., Sand-Zantman, W., Valetti, T., 2018, “The Value of Personal Information in Online Markets with Endogenous Privacy”, Management Science, Vol. 65, No. 3
Nicolle, A., Grzybowski, L. and Zulehner, C. (2018), “Impact of Competition, Investment and Regulation on Prices of Mobile Services: Evidence from France”, Economic Inquiry, 56: 1322-1345. doi:10.1111/ecin.12547
Pasquali, R. Presentation “Introduction to 5G”, given to the Order of Engineers at the Faculty of Engineering of the Polytechnic of Turin, on November 14th, 2019
Emanuel Puschita, Anca Constantinescu-Dobra, Rebeca Colda, Irina Vermesan, Ancuta Moldovan, Tudor Palade, 2014, “Challenges for a broadband service strategy in rural areas: A Romanian case study”,
Telecommunications Policy, Volume 38, Issue 2, 2014, Pages 147-156,
https://doi.org/10.1016/j.telpol.2013.08.001.
Rohlfs, J. Jackson, C. and Kelly, T. (1991) “Estimate of the Loss to the United States caused by the FCC’s delay in Licensing Cellular Telecommunications”, National Economic Research Associates: White Plains. Rossotto, CM Sekkat, K. , Varoudakis, A., 2005 “Opening up telecommunications to competition and MENA integration in the world economy”, Journal of International Development
Rossotto, C. M., Lal Das, P., Gasol Ramos, E., Clemente Miranda, E., Badran, M. F., Martinez Licetti, M., & Miralles Murciego, G. (2018). “Digital platforms: A literature review and policy implications for development”. Competition and Regulation in Network Industries, 19(1–2), 93– 109. https://doi.org/10.1177/1783591718809485
Rosston, G. and Topper, M. (2010) “An antitrust analysis of the case for wireless network neutrality,”
Information Economics and Policy, Vol 22 No. 1. 103‐119
Rosston G., (2012), “The Relationship between Technological and Regulatory Change in the Communications Industry”, No 11-020, Discussion Papers, Stanford Institute for Economic Policy Research
Samdanis K., Costa-Perez X. and Sciancalepore V., "From network sharing to multi-tenancy: The 5G network slice broker," in IEEE Communications Magazine, vol. 54, no. 7, pp. 32-39, July 2016. doi: 10.1109/MCOM.2016.7514161
Sutherland, Ewan, Bribery and Corruption in Telecommunications – Best Practice in Prevention and Remedies (March 2, 2012). 2012 TRPC. Available at SSRN: https://ssrn.com/abstract=2014665or
Towhidul Islam, Nigel Meade, “The impact of competition, and economic globalization on the multinational diffusion of 3G mobile phones”, Technological Forecasting and Social Change, Volume 79, Issue 5, 2012, Pages 843-850,
Venkata Praveen Tanguturi, Fotios C. Harmantzis, “Migration to 3G wireless broadband internet and real options: The case of an operator in India”, Telecommunications Policy, Volume 30, Issue 7, 2006, Pages 400-419, https://doi.org/10.1016/j.telpol.2006.02.004.
Wallsten , 2001, “An econometric analysis of telecom competition, privatization, and regulation in Africa and Latin America”, The Journal of industrial economics
Wallsten, 2003, “An Econometric Analysis of Telecom Competition, Privatization, and Regulation in Africa and Latin America”, The Journal of Industrial Economics, 2003, https://doi.org/10.1111/1467-6451.00135
Wallsten, Scott, Is There Really a Spectrum Crisis? Quantifying the Factors Affecting Spectrum License Value (January 23, 2013). Available at SSRN: https://ssrn.com/abstract=2206466 or http://dx.doi.org/10.2139/ssrn.2206466
Waverman, Leonard, and Esen Sirel. 1997. "European Telecommunications Markets on the Verge of Full Liberalization." Journal of Economic Perspectives, 11 (4): 113-126.
Wellenius, B., & Rossotto, C. M. (2000). Introducing Telecommunications Competition through a Wireless License: Lessons from Morocco. Journal of Network Industries, os-1(4), 469– 477. https://doi.org/10.1177/178359170000100404
Wheeler, T, 2019, 5G in five (not so easy) pieces, blog available at the Brookings Institution, website : https://www.brookings.edu/research/5g-in-five-not-so-easy-pieces/
Appendix. Table 1. List of variables and sources
Variables Description Source
Technology adoption score The opposite of technology adoption ranking. Author's calculation based on launch date of new technology from Telegeography
Liberalization Dummy variable of telecom sector's liberalization. Telegeography
Regulatory score Indicator between 0 and 1, where 1 indicates highest
score in ICT regulatory authority
International Telecommunication Union
Market share Percentage share of the total market connections. GSMA Intelligence
Ownership Total economic interests. GSMA Intelligence and authors' collection
FDI Capex FDI in communication sector10 in mUSD Financial Times, fDi intelligence
Total investment Annual investment in telecommunication services11 in
mUSD
International Telecommunication Union
Population Population (million persons) International Monetary Fund, World Economic
Outlook Database
PPP GDP Nominal gross domestic product in
purchasing-power-parity dollars (billions of PPP dollars)
International Monetary Fund, World Economic Outlook Database
10 Communication sector includes subsectors of Communications equipment, Wireless telecommunication carriers, Data processing, hosting, & related services, Wired telecommunication carriers, Radio & TV broadcasting, Motion picture & sound recording industries, Other telecommunications, Satellite telecommunications, Navigational instruments, Cable & other subscription programming.
11 Annual investment in telecommunication services refers to the investment during the financial year made by entities providing telecommunication networks and/or services (including fixed; mobile and Internet services; as well as the transmission of TV signals) for acquiring or upgrading fixed assets (usually referred to as CAPEX); less disinvestment owing to disposals of fixed assets. Fixed assets should include tangible assets; such as buildings and networks; and non-tangible assets; such as computer software and intellectual property. The definition closely corresponds to the concept of gross fixed capital formation; as defined in the System of National Accounts 2008. The indicator is a measure of investment made by entities providing telecommunication networks and/or services in the country; and includes expenditure on initial installations and additions to existing installations where the usage is expected to be over an extended period of time. It excludes expenditure on fees for operating licences and the use of radio spectrum.
Appendix. Table 1. Continued
Stock Index MSCI Gross Total Return Index Bloomberg
World Stock Index MSCI Gross Total Return Index Bloomberg
Stock returns First difference of deflated stock index in logarithm Derived from stock index
IT Index MSCI IT index Bloomberg
Energy Index MSCI Energy Index Bloomberg
Financials Index MSCI Financials Index Bloomberg
Materials Index MSCI Materials Index Bloomberg
Industrials Index MSCI Industrials Index Bloomberg
Consumer Staples Index MSCI Consumer Staples Index Bloomberg
Health Care Index MSCI Health Care Index Bloomberg
World IT Index MSCI World IT Index Bloomberg
World Energy Index MSCI World Energy Index Bloomberg
World Financials Index MSCI World Financials Index Bloomberg
World Materials Index MSCI World Materials Index Bloomberg
World Industrials Index MSCI World Industrials Index Bloomberg
World Consumer Staples Index MSCI World Consumer Staples Index Bloomberg
100 120 140 160 180 rank, reversed 1980q1 1990q1 2000q1 2010q1 2020q1 time Botswana 40 60 80 100 120 rank, reversed 1980q1 1990q1 2000q1 2010q1 2020q1 time Brazil 50 100 150 rank, reversed 1980q1 1990q1 2000q1 2010q1 2020q1 time Brunei_Darussalam 0 50 100 150 rank, reversed 1980q1 1990q1 2000q1 2010q1 2020q1 time Bulgaria 100 120 140 160 180 200 rank, reversed 1980q1 1990q1 2000q1 2010q1 2020q1 time Burkina_Faso 50 100 150 200 rank, reversed 1980q1 1990q1 2000q1 2010q1 2020q1 time Burundi 100 120 140 160 180 200 rank, reversed 1980q1 1990q1 2000q1 2010q1 2020q1 time Cabo_Verde 0 50 100 150 200 rank, reversed 1980q1 1990q1 2000q1 2010q1 2020q1 time Cambodia 100 120 140 160 180 rank, reversed 1980q1 1990q1 2000q1 2010q1 2020q1 time Cameroon 0 20 40 60 80 100 rank, reversed 1980q1 1990q1 2000q1 2010q1 2020q1 time Canada 100 150 200 rank, reversed 1980q1 1990q1 2000q1 2010q1 2020q1 time Cayman_Islands 100 120 140 160 180 200 rank, reversed 1980q1 1990q1 2000q1 2010q1 2020q1 time Central_African_Republic
100 120 140 160 180 200 rank, reversed 1980q1 1990q1 2000q1 2010q1 2020q1 time Chad 0 50 100 150 rank, reversed 1980q1 1990q1 2000q1 2010q1 2020q1 time Chile 0 50 100 150 rank, reversed 1980q1 1990q1 2000q1 2010q1 2020q1 time China 40 60 80 100 120 140 rank, reversed 1980q1 1990q1 2000q1 2010q1 2020q1 time Colombia 100 120 140 160 180 200 rank, reversed 1980q1 1990q1 2000q1 2010q1 2020q1 time Comoros 100 120 140 160 180 200 rank, reversed 1980q1 1990q1 2000q1 2010q1 2020q1 time Congo_Dem_Rep 100 120 140 160 180 200 rank, reversed 1980q1 1990q1 2000q1 2010q1 2020q1 time Congo_Rep 80 100 120 140 160 180 rank, reversed 1980q1 1990q1 2000q1 2010q1 2020q1 time Costa_Rica 100 120 140 160 180 rank, reversed 1980q1 1990q1 2000q1 2010q1 2020q1 time Côte_dIvoire 20 40 60 80 100 120 rank, reversed 1980q1 1990q1 2000q1 2010q1 2020q1 time Croatia 0 50 100 150 200 rank, reversed 1980q1 1990q1 2000q1 2010q1 2020q1 time Cuba 100 120 140 160 180 rank, reversed 1980q1 1990q1 2000q1 2010q1 2020q1 time Curaçao
0 50 100 150 rank, reversed 1980q1 1990q1 2000q1 2010q1 2020q1 time Cyprus 20 40 60 80 100 120 rank, reversed 1980q1 1990q1 2000q1 2010q1 2020q1 time Czech_Republic 0 20 40 60 80 100 rank, reversed 1980q1 1990q1 2000q1 2010q1 2020q1 time Denmark 100 120 140 160 180 200 rank, reversed 1980q1 1990q1 2000q1 2010q1 2020q1 time Djibouti 100 120 140 160 180 200 rank, reversed 1980q1 1990q1 2000q1 2010q1 2020q1 time Dominica 50 100 150 rank, reversed 1980q1 1990q1 2000q1 2010q1 2020q1 time Dominican_Republic 50 100 150 rank, reversed 1980q1 1990q1 2000q1 2010q1 2020q1 time Ecuador 50 100 150 200 rank, reversed 1980q1 1990q1 2000q1 2010q1 2020q1 time Egypt_Arab_Rep 0 50 100 150 rank, reversed 1980q1 1990q1 2000q1 2010q1 2020q1 time El_Salvador 100 120 140 160 180 200 rank, reversed 1980q1 1990q1 2000q1 2010q1 2020q1 time Equatorial_Guinea 100 120 140 160 180 200 rank, reversed 1980q1 1990q1 2000q1 2010q1 2020q1 time Eritrea 0 50 100 150 rank, reversed 1980q1 1990q1 2000q1 2010q1 2020q1 time Estonia
100 120 140 160 180 200 rank, reversed 1980q1 1990q1 2000q1 2010q1 2020q1 time Ethiopia 0 50 100 150 rank, reversed 1980q1 1990q1 2000q1 2010q1 2020q1 time Fiji 0 20 40 60 80 100 rank, reversed 1980q1 1990q1 2000q1 2010q1 2020q1 time Finland 0 20 40 60 80 100 rank, reversed 1980q1 1990q1 2000q1 2010q1 2020q1 time France 50 100 150 200 rank, reversed 1980q1 1990q1 2000q1 2010q1 2020q1 time French_Polynesia 50 100 150 200 rank, reversed 1980q1 1990q1 2000q1 2010q1 2020q1 time Gabon 50 100 150 200 rank, reversed 1980q1 1990q1 2000q1 2010q1 2020q1 time Gambia_The 60 80 100 120 140 160 rank, reversed 1980q1 1990q1 2000q1 2010q1 2020q1 time Georgia 0 50 100 150 rank, reversed 1980q1 1990q1 2000q1 2010q1 2020q1 time Germany 60 80 100 120 140 rank, reversed 1980q1 1990q1 2000q1 2010q1 2020q1 time Ghana 0 50 100 150 rank, reversed 1980q1 1990q1 2000q1 2010q1 2020q1 time Greece 80 100 120 140 160 180 rank, reversed 1980q1 1990q1 2000q1 2010q1 2020q1 time Greenland
100 120 140 160 180 200 rank, reversed 1980q1 1990q1 2000q1 2010q1 2020q1 time Grenada 50 100 150 200 rank, reversed 1980q1 1990q1 2000q1 2010q1 2020q1 time Guam 0 50 100 150 rank, reversed 1980q1 1990q1 2000q1 2010q1 2020q1 time Guatemala 100 120 140 160 180 200 rank, reversed 1980q1 1990q1 2000q1 2010q1 2020q1 time Guinea 100 120 140 160 180 200 rank, reversed 1980q1 1990q1 2000q1 2010q1 2020q1 time Guinea_Bissau 50 100 150 200 rank, reversed 1980q1 1990q1 2000q1 2010q1 2020q1 time Guyana 100 120 140 160 180 200 rank, reversed 1980q1 1990q1 2000q1 2010q1 2020q1 time Haiti 100 120 140 160 180 rank, reversed 1980q1 1990q1 2000q1 2010q1 2020q1 time Honduras 0 50 100 150 rank, reversed 1980q1 1990q1 2000q1 2010q1 2020q1 time Hong_Kong_SAR_China 20 40 60 80 100 120 rank, reversed 1980q1 1990q1 2000q1 2010q1 2020q1 time Hungary 0 20 40 60 80 100 rank, reversed 1980q1 1990q1 2000q1 2010q1 2020q1 time Iceland 0 50 100 150 rank, reversed 1980q1 1990q1 2000q1 2010q1 2020q1 time India
0 50 100 rank, reversed 1980q1 1990q1 2000q1 2010q1 2020q1 time Indonesia 100 120 140 160 180 200 rank, reversed 1980q1 1990q1 2000q1 2010q1 2020q1 time Iran_Islamic_Rep 50 100 150 200 rank, reversed 1980q1 1990q1 2000q1 2010q1 2020q1 time Iraq 0 20 40 60 80 100 rank, reversed 1980q1 1990q1 2000q1 2010q1 2020q1 time Ireland 0 50 100 rank, reversed 1980q1 1990q1 2000q1 2010q1 2020q1 time Italy 0 50 100 150 rank, reversed 1980q1 1990q1 2000q1 2010q1 2020q1 time Jamaica 0 50 100 150 rank, reversed 1980q1 1990q1 2000q1 2010q1 2020q1 time Japan 50 100 150 rank, reversed 1980q1 1990q1 2000q1 2010q1 2020q1 time Jordan 60 80 100 120 140 160 rank, reversed 1980q1 1990q1 2000q1 2010q1 2020q1 time Kazakhstan 60 80 100 120 140 rank, reversed 1980q1 1990q1 2000q1 2010q1 2020q1 time Kenya 0 50 100 150 200 rank, reversed 1980q1 1990q1 2000q1 2010q1 2020q1 time Kiribati 100 120 140 160 180 200 rank, reversed 1980q1 1990q1 2000q1 2010q1 2020q1 time Korea_Dem_Peoples_Rep
0 20 40 60 80 100 rank, reversed 1980q1 1990q1 2000q1 2010q1 2020q1 time Korea_Rep 20 40 60 80 100 rank, reversed 1980q1 1990q1 2000q1 2010q1 2020q1 time Kuwait 0 50 100 150 rank, reversed 1980q1 1990q1 2000q1 2010q1 2020q1 time Kyrgyz_Republic 50 100 150 rank, reversed 1980q1 1990q1 2000q1 2010q1 2020q1 time Lao_PDR 0 50 100 150 rank, reversed 1980q1 1990q1 2000q1 2010q1 2020q1 time Latvia 50 100 150 200 rank, reversed 1980q1 1990q1 2000q1 2010q1 2020q1 time Lebanon 80 100 120 140 160 180 rank, reversed 1980q1 1990q1 2000q1 2010q1 2020q1 time Lesotho 100 120 140 160 180 200 rank, reversed 1980q1 1990q1 2000q1 2010q1 2020q1 time Liberia 0 50 100 150 200 rank, reversed 1980q1 1990q1 2000q1 2010q1 2020q1 time Libya 50 100 150 200 rank, reversed 1980q1 1990q1 2000q1 2010q1 2020q1 time Liechtenstein 0 50 100 150 rank, reversed 1980q1 1990q1 2000q1 2010q1 2020q1 time Lithuania 0 50 100 150 rank, reversed 1980q1 1990q1 2000q1 2010q1 2020q1 time Luxembourg
0 50 100 150 rank, reversed 1980q1 1990q1 2000q1 2010q1 2020q1 time Macao_SAR_China 100 120 140 160 180 rank, reversed 1980q1 1990q1 2000q1 2010q1 2020q1 time Madagascar 50 100 150 200 rank, reversed 1980q1 1990q1 2000q1 2010q1 2020q1 time Malawi 20 40 60 80 100 120 rank, reversed 1980q1 1990q1 2000q1 2010q1 2020q1 time Malaysia 50 100 150 200 rank, reversed 1980q1 1990q1 2000q1 2010q1 2020q1 time Maldives 50 100 150 200 rank, reversed 1980q1 1990q1 2000q1 2010q1 2020q1 time Mali 100 150 200 rank, reversed 1980q1 1990q1 2000q1 2010q1 2020q1 time Mauritania 0 50 100 150 rank, reversed 1980q1 1990q1 2000q1 2010q1 2020q1 time Mauritius 0 50 100 rank, reversed 1980q1 1990q1 2000q1 2010q1 2020q1 time Mexico 0 50 100 150 200 rank, reversed 1980q1 1990q1 2000q1 2010q1 2020q1 time Moldova 0 50 100 150 200 rank, reversed 1980q1 1990q1 2000q1 2010q1 2020q1 time Monaco 0 50 100 150 rank, reversed 1980q1 1990q1 2000q1 2010q1 2020q1 time Mongolia
60 80 100 120 140 160 rank, reversed 1980q1 1990q1 2000q1 2010q1 2020q1 time Montenegro 40 60 80 100 120 140 rank, reversed 1980q1 1990q1 2000q1 2010q1 2020q1 time Morocco 100 120 140 160 180 rank, reversed 1980q1 1990q1 2000q1 2010q1 2020q1 time Mozambique 0 50 100 150 200 rank, reversed 1980q1 1990q1 2000q1 2010q1 2020q1 time Myanmar 0 50 100 150 rank, reversed 1980q1 1990q1 2000q1 2010q1 2020q1 time Namibia 100 150 200 rank, reversed 1980q1 1990q1 2000q1 2010q1 2020q1 time Nepal 0 50 100 150 rank, reversed 1980q1 1990q1 2000q1 2010q1 2020q1 time Netherlands 60 80 100 120 140 160 rank, reversed 1980q1 1990q1 2000q1 2010q1 2020q1 time New_Caledonia 0 20 40 60 80 100 rank, reversed 1980q1 1990q1 2000q1 2010q1 2020q1 time New_Zealand 60 80 100 120 140 rank, reversed 1980q1 1990q1 2000q1 2010q1 2020q1 time Nicaragua 50 100 150 200 rank, reversed 1980q1 1990q1 2000q1 2010q1 2020q1 time Niger 0 50 100 150 200 rank, reversed 1980q1 1990q1 2000q1 2010q1 2020q1 time Nigeria
100 120 140 160 180 200 rank, reversed 1980q1 1990q1 2000q1 2010q1 2020q1 time Northern_Mariana_Islands 0 50 100 150 rank, reversed 1980q1 1990q1 2000q1 2010q1 2020q1 time Norway 0 50 100 150 rank, reversed 1980q1 1990q1 2000q1 2010q1 2020q1 time Oman 0 50 100 150 200 rank, reversed 1980q1 1990q1 2000q1 2010q1 2020q1 time Pakistan 100 120 140 160 180 200 rank, reversed 1980q1 1990q1 2000q1 2010q1 2020q1 time Palau 80 100 120 140 160 rank, reversed 1980q1 1990q1 2000q1 2010q1 2020q1 time Panama 100 120 140 160 180 200 rank, reversed 1980q1 1990q1 2000q1 2010q1 2020q1 time Papua_New_Guinea 50 100 150 rank, reversed 1980q1 1990q1 2000q1 2010q1 2020q1 time Paraguay 0 50 100 150 rank, reversed 1980q1 1990q1 2000q1 2010q1 2020q1 time Peru 0 50 100 150 rank, reversed 1980q1 1990q1 2000q1 2010q1 2020q1 time Philippines 0 50 100 150 rank, reversed 1980q1 1990q1 2000q1 2010q1 2020q1 time Poland 20 40 60 80 100 120 rank, reversed 1980q1 1990q1 2000q1 2010q1 2020q1 time Portugal
0 50 100 150 rank, reversed 1980q1 1990q1 2000q1 2010q1 2020q1 time Puerto_Rico 0 50 100 150 rank, reversed 1980q1 1990q1 2000q1 2010q1 2020q1 time Qatar 0 50 100 150 200 rank, reversed 1980q1 1990q1 2000q1 2010q1 2020q1 time Romania 0 50 100 150 rank, reversed 1980q1 1990q1 2000q1 2010q1 2020q1 time Russian_Federation 100 120 140 160 180 rank, reversed 1980q1 1990q1 2000q1 2010q1 2020q1 time Rwanda 100 120 140 160 180 200 rank, reversed 1980q1 1990q1 2000q1 2010q1 2020q1 time Samoa 0 50 100 150 200 rank, reversed 1980q1 1990q1 2000q1 2010q1 2020q1 time San_Marino 0 50 100 150 rank, reversed 1980q1 1990q1 2000q1 2010q1 2020q1 time Saudi_Arabia 80 100 120 140 160 rank, reversed 1980q1 1990q1 2000q1 2010q1 2020q1 time Senegal 50 100 150 rank, reversed 1980q1 1990q1 2000q1 2010q1 2020q1 time Serbia 50 100 150 200 rank, reversed 1980q1 1990q1 2000q1 2010q1 2020q1 time Seychelles 100 120 140 160 180 200 rank, reversed 1980q1 1990q1 2000q1 2010q1 2020q1 time Sierra_Leone