HAL Id: hal-02621786
https://hal.inrae.fr/hal-02621786
Submitted on 3 May 2021
HAL is a multi-disciplinary open access
archive for the deposit and dissemination of
sci-entific research documents, whether they are
pub-lished or not. The documents may come from
teaching and research institutions in France or
abroad, or from public or private research centers.
L’archive ouverte pluridisciplinaire HAL, est
destinée au dépôt et à la diffusion de documents
scientifiques de niveau recherche, publiés ou non,
émanant des établissements d’enseignement et de
recherche français ou étrangers, des laboratoires
publics ou privés.
Distributed under a Creative Commons Attribution| 4.0 International License
MetExploreViz: web component for interactive
metabolic network visualization
Maxime Chazalviel, Clément Frainay, Nathalie Poupin, Florence Vinson,
Benjamin Merlet, Benjamin Gloaguen, Ludovic Cottret, Fabien Jourdan
To cite this version:
Maxime Chazalviel, Clément Frainay, Nathalie Poupin, Florence Vinson, Benjamin Merlet, et al..
Me-tExploreViz: web component for interactive metabolic network visualization. Bioinformatics, Oxford
University Press (OUP), 2018, 34 (2), pp.312-313. �10.1093/bioinformatics/btx588�. �hal-02621786�
Systems biology
MetExploreViz: web component for interactive
metabolic network visualization
Maxime Chazalviel
1,2, Cle´ment Frainay
1, Nathalie Poupin
1,
Florence Vinson
1, Benjamin Merlet
1, Yoann Gloaguen
3, Ludovic Cottret
4and Fabien Jourdan
1,*
1
Toxalim, Universite´ de Toulouse, INRA, Universite´ de Toulouse 3 Paul Sabatier, Toulouse, France,
2MedDay
Pharmaceuticals, Paris, France,
3Glasgow Polyomics, College of Medical, Veterinary and Life Sciences, University
of Glasgow, Wolfson Wohl Cancer Research Centre, Gascube Campus, Bearsden G61 1QH, UK and
4LIPM,
Universite´ de Toulouse, INRA, CNRS, Castanet-Tolosan, France
*To whom correspondence should be addressed Associate editor: Alfonso Valencia
Received on April 12, 2017; revised on August 4, 2017; editorial decision on September 13, 2017; accepted on September 14, 2017
Abstract
Summary: MetExploreViz is an open source web component that can be easily embedded in any
web site. It provides features dedicated to the visualization of metabolic networks and pathways
and thus offers a flexible solution to analyse omics data in a biochemical context.
Availability and implementation: Documentation and link to GIT code repository (GPL 3.0 license)
are available at this URL: http://metexplore.toulouse.inra.fr/metexploreViz/doc/
Contact: [email protected]
1 Introduction
Visualization is a much-needed approach in the era of untargeted omics since it enables discovering new insights in large molecular data corpus (Callaway, 2016). For metabolic studies, challenge res-ides in creating visual representations of all, or part of, the thou-sands of reactions and metabolites constituting genome scale metabolic networks.
Visualizing metabolic networks necessitates specific graphical features that are not necessarily available in generic network visualization tools (Bastian et al., 2009;Cline et al., 2007) or web based tools (Franz et al., 2016). Resources are available to perform omics data mapping on meta-bolic pathways (Caspi et al., 2016;Kanehisa et al., 2014) or on overview of metabolism (Noronha et al., 2017), but they mostly rely on manually drawn maps which cannot integrate network updates or be used for new metabolic reconstructions (Karp et al., 2016). Automatic drawing is thus needed to fit current growing research activity in the field.
Current trend in web development is oriented toward modular architectures allowing assembling specialized web components. In this context, we designed MetExploreViz as an easy to install open source web component that can quickly and easily be embedded in any web-site. Only few lines of code are required to add MetExploreViz to any web page (see installation section at http://metexplore.toulouse.inra.fr/ metexploreViz/doc/).
2 Metabolic network visualization features
In order to make MetExploreViz a versatile solution, it is possible to import networks in JSON format. These networks can for instance be retrieved by using MetExplore web services (Cottret et al., 2010). Drawing is achieved using an animated version of force directed lay-out implemented in D3.js library upon which MetExploreViz is built. It is also possible to manually edit the representation and then save the drawing in JSON format for further reuse.An issue when drawing metabolic networks is the presence of highly connected small molecules like water or CO2which are not
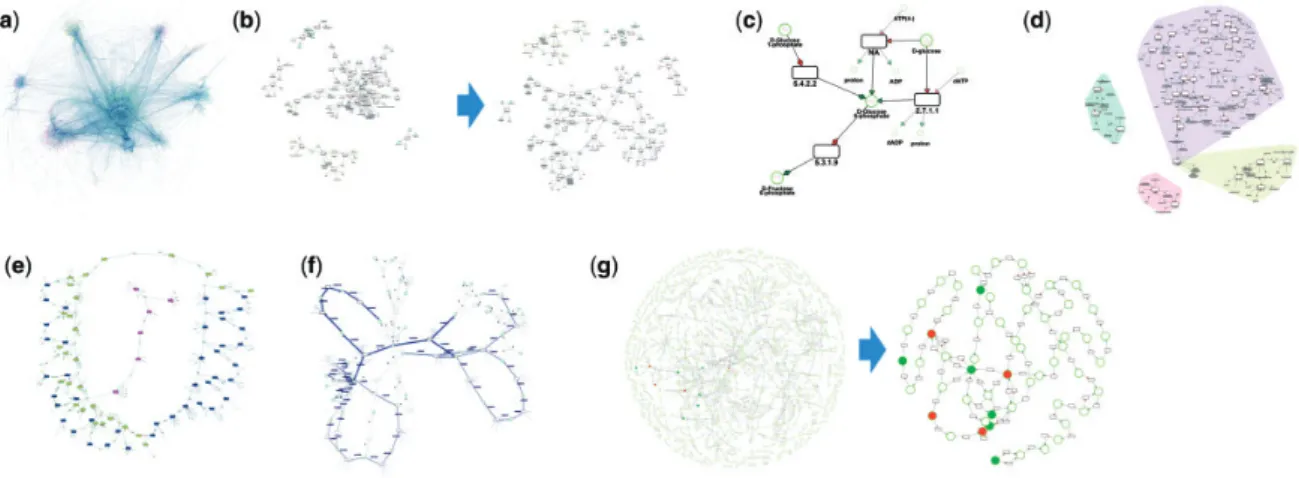
necessarily of biochemical interest for data interpretation. To facili-tate the visual inspection, these side compounds can be duplicated or deleted in MetExploreViz (Fig. 1b and c).
Each element of a metabolic network can be involved in one or more metabolic pathways and be present in one or several cellular compartments. MetExploreViz offers an original feature to visualize this information using convex hulls (Fig. 1d). Since the force directed algorithm may lead to overlapping hulls, we implemented an algo-rithm to take these sub-structures into account during the drawing.
MetExploreViz purpose is the visualization of omics data on reac-tions and metabolites. It is thus possible to import data and map them in a discrete or continuous way using predefined or selected colors (see
Fig. 1e and f).
VCThe Author 2017. Published by Oxford University Press. 312
This is an Open Access article distributed under the terms of the Creative Commons Attribution License (http://creativecommons.org/licenses/by/4.0/), which permits unrestricted reuse, distribution, and reproduction in any medium, provided the original work is properly cited.
Bioinformatics, 34(2), 2018, 312–313 doi: 10.1093/bioinformatics/btx588 Advance Access Publication Date: 15 September 2017 Applications Note
In order to focus on a core sub-network (seeFig. 1g), MetExploreViz implements a sub-network extraction method computing the union of lightest paths between each pairs of mapped (or selected) nodes in the net-work (Frainay and Jourdan, 2017). Lightest paths aim at avoiding side compounds by weighting nodes according to their degree defined as the number of in and out connections. Classical image exports are available and completed with an SVG export well suited for online representations. Since MetExploreViz focuses on metabolic networks, it does not pro-vide all the features available in generic network analysis software suites like Cytoscape or Gephi. To allow compatibility with these tools, it is possible in MetExploreViz to export networks in gml and dot formats.
MetExploreViz is provided as an open source web component that only requires few lines of code to be embedded in a web site.
3 Discussion and application
MetExploreViz and metabolic pathways oriented representations like KEGG are complementary visualization solutions. MetExploreViz is focused on integrative and flexible network import and representation, while pathway oriented tools are guiding data interpretation toward a priori defined metabolic functions.
MetExploreViz is embedded in MetExplore web server (Cottret et al., 2010). But its component oriented architecture allows it to be used in various web servers. For instance, it is available in MetaboLights data re-pository for metabolomics data sets (Kale et al., 2016). We are also cur-rently working on the integration of MetExploreViz in galaxy pipelines (Giacomoni et al., 2015). MetExploreViz provides complementary fea-tures to Escher (King et al., 2015) like sub-network extraction and is not focused on network curation, making it a lightweight component.
The tool has been used for several projects as shown onFigure 1g
where metabolomics data from (Madalinski et al., 2008) are represented. The extracted sub-network shown on the figure raised similar conclusions as the ones described inMilreu et al. (2014). Tutorial available at http:// metexplore.toulouse.inra.fr/metexploreViz/doc/ allows repeating this analysis.
Acknowledgements
Authors would like to thank EBI team and all the users who provided regular feedbacks. We are grateful to the genotoul bioinformatics platform Toulouse Midi-Pyrenees for providing computing and storage resources.
Funding
This work was supported by the French Ministry of Research and National Research Agency as part of the French MetaboHUB [Grant ANR-INBS-0010]; Wellcome Trust [Grant 105614/Z/14/Z]; and PhenoMeNal project, European Commission’s Horizon 2020 Program [Grant Agreement Number 654241].
References
Bastian,M. et al. (2009) Gephi: an open source software for exploring and manipulating networks. In: Int. AAAI Conf. WEBLOGS Soc. MEDIA. Callaway,E. (2016) The visualizations transforming biology. Nature, 535, 187–188. Caspi,R. et al. (2016) The MetaCyc database of metabolic pathways and en-zymes and the BioCyc collection of pathway/genome databases. Nucleic Acids Res., 44, D471–D480.
Cline,M.S. et al. (2007) Integration of biological networks and gene expres-sion data using Cytoscape. Nat. Protoc., 2, 2366–2382.
Cottret,L. et al. (2010) MetExplore: a web server to link metabolomic experiments and genome-scale metabolic networks. Nucleic Acids Res., 38, W132–W137. Frainay,C., and Jourdan,F. (2017) Computational methods to identify metabolic
sub-networks based on metabolomic profiles. Brief. Bioinform, 18, 43–56. Franz,M. et al. (2016) Cytoscape.js: a graph theory library for visualisation
and analysis. Bioinformatics, 32, 309–311.
Giacomoni,F. et al. (2015) Workflow4Metabolomics: a collaborative research in-frastructure for computational metabolomics. Bioinformatics, 31, 1493–1495. Kale,N.S. et al. (2016) MetaboLights: an open-access database repository for
metabolomics data. Curr. Protoc. Bioinformatics, 53, 14.13.1–18. Kanehisa,M. et al. (2014) Data, information, knowledge and principle: back
to metabolism in KEGG. Nucleic Acids Res., 42, D199–D205.
Karp,P.D. et al. (2016) Pathway Tools version 19.0 update: software for path-way/genome informatics and systems biology. Brief. Bioinform., 17, 877–890. King,Z.A. et al. (2015) Escher: a web application for building, sharing, and embedding data-rich visualizations of biological pathways. PLoS Comput. Biol., 11, e1004321.
Madalinski,G. et al. (2008) Direct introduction of biological samples into a LTQ-Orbitrap hybrid mass spectrometer as a tool for fast metabolome ana-lysis. Anal. Chem., 80, 3291–3303.
Milreu,P.V. et al. (2014) Telling metabolic stories to explore metabolomics data: a case study on the yeast response to cadmium exposure. Bioinformatics, 30, 61–70. Noronha,A. et al. (2017) ReconMap: an interactive visualization of human
metabolism. Bioinformatics, 31, 605–607.
Thiele,I. et al. (2013) A community-driven global reconstruction of human metabolism. Nat. Biotechnol., 31, 419–425.
Fig. 1. Main MetExploreViz features. (a) Visualization of Recon2 human metabolic network containing 7440 reactions (Thiele et al., 2013). (b) Sub-network corresponding to glycolysis pathway in cytosol. Highly connected nodes in grey (ATP, ADP, NAD and NADH) on the left network are duplicated to create the sparser representation on the right. (c) Zoom in view on the metabolic pathway, reversible reactions are depicted using double-headed arrows. Smaller nodes are duplicated side compounds. (d) Compartments where glycolysis is taking place are highlighted using colored convex hulls (e.g. cytosol in top right corner). (e) Sub-network with discrete values mapped on reactions. (f) Flux values mapped on edges around reactions. (g) KEGG network of Saccharomyces cerevisiae with metabolomics dataset from (Madalinski et al., 2008) mapped (dark nodes). On the right the sub-network automatically obtained using the algorithm computing the union of lightest paths implemented in MetExploreViz (Color version of this figure is available at Bioinformatics online.)
MetExploreViz 313