HAL Id: insu-00574650
https://hal-insu.archives-ouvertes.fr/insu-00574650
Submitted on 10 Jun 2011HAL is a multi-disciplinary open access
archive for the deposit and dissemination of sci-entific research documents, whether they are pub-lished or not. The documents may come from teaching and research institutions in France or abroad, or from public or private research centers.
L’archive ouverte pluridisciplinaire HAL, est destinée au dépôt et à la diffusion de documents scientifiques de niveau recherche, publiés ou non, émanant des établissements d’enseignement et de recherche français ou étrangers, des laboratoires publics ou privés.
Contribution of climatic and anthropogenic effects to
the hydric deficit of peatlands
Chrystelle Auterives, Luc Aquilina, Olivier Bour, Mélanie Davranche, Valérie
Paquereau
To cite this version:
Chrystelle Auterives, Luc Aquilina, Olivier Bour, Mélanie Davranche, Valérie Paquereau. Contribution of climatic and anthropogenic effects to the hydric deficit of peatlands. Hydrological Processes, Wiley, 2011, 25, pp.2890-2906. �10.1002/hyp.8052�. �insu-00574650�
Accepted Article
Contribution of climatic and anthropogenic effects to the hydric deficit
of peatlands
Auterives, Chrystelle University of Orléans ISTO 1A rue de la Férollerie Orléans 45071 France Aquilina, Luc Corresponding Author University of Rennes 1 Geosciences Rennes France luc.aquilina@univ-rennes.fr Bour, Olivier Geosciences Rennes Campus de Beaulieu Université Rennes 1 Avenue du Gal Leclerc Rennes
This article has been accepted for publication and undergone full scientific peer review but has not been through the copyediting, typesetting, pagination and proofreading process which may lead to differences between this version and the Version of Record. Please cite
Accepted Article
35042 France
Davranche, Mélanie
University of Rennes 1 - Geosciences Rennes
France
Paquereau, Valérie
Parc Naturel Régional des Marais du Cotentin et du Bessin Carentan
Les Veys France
Abstract
The present study makes use of a detailed water balance to investigate the hydrological status of a peatland with a basal clay-rich layer overlying an aquifer exploited for drinking water. The aim is to determine the influence of climate and groundwater extraction on the water balance and water levels in the peatland. During the two-year period of monitoring, the hydrological functioning of the wetland showed a hydric deficit, associated with a permanent unsaturated layer and a deep water table. At the same time, a stream was observed serving as a recharge inflow instead of draining the peatland, as usually described in natural systems. Such conditions are not favourable for peat accumulation. Field investigations show that the clay layer has a high hydraulic conductivity (1.10-7 to 3.10-9 m.s-1) and does not form a hydraulic barrier. Moreover, the
vertical hydraulic gradients are downward between the peat and the sand aquifer, leading to high flows of groundwater through the clay layer (20 to 48% of the precipitation). The observed hydric deficit of the peatland results from a combination of dry climatic conditions during the study period and groundwater extraction. The climatic effect is mainly expressed through drying out of the peatland, while the
Accepted Article
anthropogenic effect leads to an enhancement of the climatic effect on a global scale, and a modification of fluxes at a local scale. The drying out of the peatland can lead to its mineralization, which thus gives rise to environmental impacts. The protection of such wetlands in the context of climate change should take account of anthropogenic pressures by considering the wetland-aquifer interaction.
Accepted Article
1. Introduction
The loss of peatland area and biodiversity through drainage and water extraction are the subject of major and varied research programmes focused on wetlands. Wetlands have a crucial impact on human activities, since these areas are important in regulating water flow and long-term storage, carrying out hydrochemical functions such as water filtration, while also having an ecological value because of the high diversity of their flora and fauna, as well as regarding eco-tourism (Bragg and Lindsay, 2003; Heathwaite, 1995; Mitsch and Gosselink, 2000 Fraser et al., 2001; Reeve et al., 2001). The importance of wetlands for carbon sequestration has also been investigated (Siemens and Janssens, 2003). The potential evolution of wetlands as a carbon source is a key issue in the context of climate change. Hydrology is important for the maintenance of wetland structure and biological processes (Winter and Woo, 1990; Romanowicz et al., 1993; Waddington and Roulet, 1997; Dowrick et al., 2006). Slight hydrological variations in wetlands, which would cause a shift from saturated to unsaturated conditions, could induce massive changes in species composition, diversity and productivity of the ecosystem (Provost, 1982; Mitsch and Gosselink, 2000). A deeper water table would expose a larger proportion of organic material to aerobic decay (Joosten, 2008). Peatland conservation and growth depend mainly on the frequency and length of the annual flooding period, which is itself controlled by the water balance (Laplace-Dolonde, 1994).
The hydrological functioning of wetlands may influence carbon release or uptake through the modification of water levels and/or water fluxes (Blodau et al., 2004). Under natural conditions, peatlands represent net carbon sinks. Peat accumulation depends strongly on water-table level, and occurs when the water table is just under, at, or just above the ground surface (Joosten, 2008). The lowering of water level in peatlands can negatively affect the functioning of wetlands (Ivanov, 1981 in Joosten, 2008; Blodau et al., 2004) through processes of mineralization and erosion (Clymo, 1983; Hooijer et al., 2006). Natural peatlands may thus shift from carbon sinks to carbon sources. However, there any many unresolved questions concerning the potential
Accepted Article
evolution of wetland hydrological functioning over the last few decades, and the influence of climate as well as anthropogenic factors.
There are large number of mire classifications based on landform, chemistry, plant composition, water source, etc (Brinson, 1993), so the role of groundwaters differs between the various types of wetlands. In some cases, wetlands have weak interactions with groundwaters. Soils with low permeability isolate wetlands from large-scale groundwater systems. In raised bogs, peat accumulates above the surrounding land and becomes isolated from the influence of groundwater and surface water. In other cases, wetlands interact with groundwaters. Fens are known to be the expression of groundwater outflow at the ground surface (Mitsch and Gosselink, 2000; Fraser et al., 2001; Reeve et al., 2001). Peatlands may form in topographic depressions or on hill slopes where the water table rises through the soil. In valley mires, the water is derived from the mixing of groundwater, surface water and precipitation. Riparian wetlands, adjacent to streams or rivers, are influenced by fluctuations of water level in the riparian zone.
Several hydrological investigations have focused on wetland-aquifer interactions and have laid stress on the importance of groundwater flow exchanges between peatlands and their surrounding as well as their underlying geological formations. Such exchanges influence vegetation patterns (Siegel and Glaser, 1987), chemical composition and biogeochemical processes (Hill and Siegel, 1991; Clément et al., 2003; Ladouche and Weng, 2005), and hydrological functioning (Siegel, 1983; Roulet, 1991; Devito et al., 1996; Devito et al., 1997; Wise et al., 2000; Ladouche and Weng, 2005). Studying the relationships between peatlands and regional hydrogeology represents an important stage in assessing the functioning of wetlands and their sensitivity to hydrogeological, anthropogenic or climatic variations. At a large scale, climate would directly influence both precipitation and evapotranspiration in the peatland, while wet periods with high precipitation would favour waterlogged soils. Warm and dry conditions would decrease precipitation and increase evaporation, leading to a lowering of the peat water table. On a more local scale, anthropogenic activities (agricultural drainage, forestry drainage, peat extraction, etc.) substantially lower the water level and negatively affect peat preservation. Such activities can lead to substantial losses of peat through
Accepted Article
mineralization and erosion (Joosten and Cowenberg, 2008). Groundwater resource extraction might also influence wetland-groundwater interactions. Although groundwaters may account for a minor component of the water balance of the wetland, decreasing the piezometric head by water withdrawal from the underlying aquifer can lower the base level to such an extent that the system can no longer compensate and the wetland dries out (Owen, 1995; Gilvear et al., 1997). There is a remaining need to investigate the importance and variability of vertical groundwater flow as compared to other components of the water balance (precipitation, evapotranspiration, and surface flow). Anthropogenic activities may modify wetland sensitivity and vulnerability to dry climatic conditions.
In France, peatlands cover less than 1% of the total land area. Although this is relatively small proportion compared with more northern countries (Canada, Russia, Fenno-Scandinavia and the British Isles), the peatlands of France exhibit a great diversity (Manneville, 2001). However, like many other countries in Western Europe, commercial extraction and drainage have led to the destruction of French peatlands (loss of 50% from 1945 to 1998) (Bragg and Lindsay, 2003; Manneville 2001).
The Cotentin peninsula in northern Normandy has one of the largest peat sites in France, which has been included in the list of the Ramsar convention since 1991. The wetland landscape of the Cotentin is made up of a mosaic of water meadows covering an area of 32 000 ha, forming a drainage network converging towards the sea. The Cotentin peatland overlies sandy aquifers used for drinking water extraction. Marine and fluvial Plio-Pleistocene deposits have been preserved in small Cenozoic grabens (Pareyn, 1980; Baize, 1998; Dugué, 2003), thus making up the main water resource in northern Normandy (Freslon, 1988; Vernoux et al., 2000). The groundwater resources have been estimated at around 16 million cubic metres per year. Current groundwater extraction does not exceed 7 million cubic metres per year, providing water for 80 000 inhabitants. This extraction is expected to increase considerably over the next few decades. Following water extraction, a piezometric depression in the sandy substrate could influence the hydrological functioning of the overlying peatland (Vernoux et al., 2000). The potential influence on functioning will evidently depend on the hydrological connection between peat and sand. Therefore, the present study focuses on
Accepted Article
groundwater-surface water interactions in the Cotentin peatlands. This study aims to determine the effect of climate and groundwater extraction on the peat/water balance and water levels in peatlands. A water balance approach is used to characterize the hydrological connection between peat and sand. For that purpose, stream and groundwater levels were monitored over a two-year period and placed in the context of recent decadal wet and dry cycles. To assess the sensitivity and vulnerability of the peatland to anthropogenic and climatic influences, we compare sites according to the eventual influence of groundwater extraction.
2. Site description
The studied sites are peaty meadows located in Normandy, North-Western France (Figure 1). The peatlands of Normandy have developed over the last 5000 years from the anaerobic decomposition of feather mosses, but the plant assemblage is mostly composed of phanerogams including trees and shrubs whose woody skeleton is well preserved in the peat (Provost, 1982). The peat thickness varies between 1 m to 7 m (Figure 1). Most of the Cotentin peatlands are now at the end of the active turf-forming phase. Peats have almost entirely ceased accumulating organic matter, in spite of frequent and persistent flooding (Provost, 1982). The wetland ecosystem has evolved in equilibrium with human activities, preserving a rich biodiversity (Provost, 1982, 1993). The investigated peatlands are mesotrophic freshwater fens with alkaline to neutral pH (Provost, 1982). Along the streams, there are regular exchanges between the peatlands and the drainage network, which consists of several rivers either within or bordering the peatland, as well as small ditches (30 to 40 cm deep) running through the wetland. During the study period, the influence of these small empty ditches on the wetland hydrology was negligible at the site scale. The peatlands overlie (1) a clay-rich layer of variable thickness (1.5 - 6 m), and (2) a Miocene to Quaternary sandy formation 80 to 100 m thick (Freslon, 1988; Salimeh, 1990; Dugué, 2003). This latter formation makes up the largest regional aquifer, with a high hydraulic conductivity (10-3 to 10-4 m.s-1),
which covers an area of 132 km². This major aquifer has been used for drinking water supply since 1989 (3 million m3 per year), with wells being sunk directly into the peatland.
Accepted Article
The climate of northern Normandy is oceanic. The meteorological station, located 5 km north of the study sites, records a mean annual precipitation of 923 mm (1946 to 2004), with an annual mean potential evapotranspiration of 650 mm. The average number of days with precipitation of more than 1 mm ranges from 120 to 160 days. The temperature range is narrow, with a mean maximum temperature ranging from 19 to 24°C in summer and from 1 to 5°C in winter.
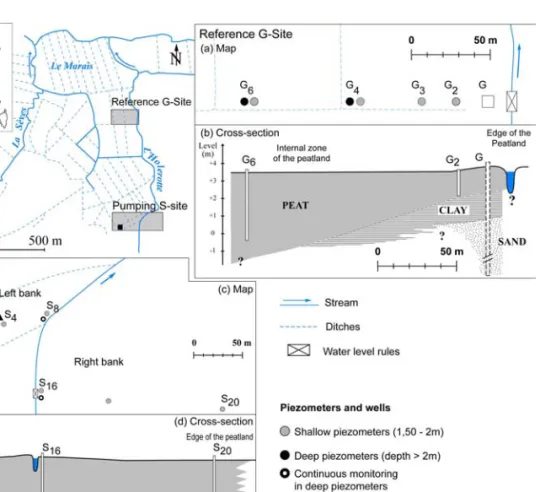
Three peatland sites were investigated (Figure 1): two sites (S) are situated close together, one near the pumping station, on the left bank (west side of the stream channel), and the other at the pumping station on the right bank, across the stream on the east side of the channel. The reference site G is located 1.3 km downstream, beyond the zone of influence of the pumping station. Indeed, the pumping rate at F1 (Figure 1) and hydraulic parameters of the sand aquifer (Vernoux et al., 2000) show that the capture zone of the extraction well does not extend farther than 150 m downstream from the pumping area (Fetter, 2001). Therefore, in the sand aquifer, the drawdown due to extraction at F1 (site S) is negligible at the reference site G.
The thickness of the peat layer was estimated from auger-test holes (Figure 1). At the S-sites (left and right bank), the peat layer has a basin-like shape with the greatest thickness at the centre. The peat layer ranges in thickness from less than 1 m to more than 6 m, attaining a maximum of about 4 m below the stream. The peat layer is thin around the edge of the peatland (60 cm at site G) and becomes thicker towards the centre of the peatland (more than 6 m). The thickness of the clay-rich layer (2.70 m in borehole F1 and 1.50 m in borehole G) was estimated from two drilling-logs that penetrated into the deep aquifer.
3. Materials and methods
3.1 Piezometric monitoring
To characterize horizontal and vertical groundwater flow, groundwater levels (in peat, clay and sand) were monitored along with the stream water level. The peat layer was monitored using sixteen PVC piezometers. Large-diameter (100 mm) piezometers were chosen to ensure robustness of the equipment during the installation and facilitate
Accepted Article
chemical sampling. To limit the impact on the surrounding peat, the piezometers were installed using an auger with the same diameter, and inserted manually into the peat. To observe the piezometric head distribution in the peatland, piezometers were inserted at depths of 1.20 m to 6 m. Most of them were inserted at 1.5-2.0 m depth with a 40 cm long screened section at the base. Additional piezometers were inserted deeper than 3 m with a 60 cm long screened section. However, to allow comparison, in Figure 2, we plot the piezometric heads for each site measured using piezometers with the same design (same depth, same screened section). The slots of the screened section were perpendicular to the pipe axis, measuring 5 cm long, 1-2 mm wide, and were spaced at 1 cm intervals. Six piezometers were set up in the peat layer at site G and four at site S-right bank, following a transect perpendicular to the river, in order to observe the stream-peat relationship and determine the main direction of groundwater flow. At site S-left bank, 6 peat piezometers (deep and shallow) were placed close to the stream, close to the pumping area and right in the middle of the area. Because of the areas of private land, it was not possible to carry out a perpendicular transect as at the other sites. At this site, one piezometer was placed in the clay-rich layer (Figure 1). The piezometric level in the sand aquifer was monitored with 2 deep boreholes (80 – 100 m) intersecting the sand formation at site S-left bank and at site G (Figure 1). At site S-right bank, there was no point for direct measurement of the groundwater level in the sand. The monitoring of piezometric head in the sand at different measurement points located all around the aquifer showed homogeneous fluctuations. This allowed us to extrapolate the sand piezometric head at site S–right bank from the piezometric map established in 1996 (Vernoux et al., 2000). The sand piezometric level at site S-right bank appeared to be 7.1 cm higher (σ = 2.4) than at site S-left bank. Water level rules were placed in the stream at two locations at site G and at pumping site S (Figure 1). The monitoring of groundwater levels and stream water levels was carried out manually using a water-level meter, simultaneously for all the measurement points, every two or three weeks from March 2003 to March 2005. In parallel, continuous monitoring was set up at pumping site S. Paratronic data loggers and Keller pressure transducers (0-2 bar) were used to record continuously the piezometric level in 4 piezometers in the peat layer, as well as the stream water level, with a time frequency of 10 minutes (Figure 1). Sand groundwater levels were measured in the field in the deep boreholes F2 and G (screened
Accepted Article
throughout the thickness of the sand layer) (Figure 1). These measurements were compared with the piezometric head of the sandy aquifer, which was continuously monitored since 1993 (Figure 2).
3.2 Water sampling and analysis
To estimate actual evapotranspiration from chloride concentration (Cl-), peat-water samples were collected every two months. Due to the low hydraulic conductivity of the peat (see section 4.1), the recovery of the groundwater level in the piezometers took more than a week. As a consequence, the wells were not purged before sample collection. Water was sampled, filtered (0.22 µm cellulose acetate filter capsule Sartorius), stored at 4°C in the dark for 24h before analysis for Cl- by ionic
chromatography (Dionex DX-120) with an uncertainty better than ± 5%.
3.3 Permeability measurements
Literature values for the hydraulic conductivity of saturated peat cover several orders of magnitude from 10-10 to 10-3 m.s-1 (Rycroft et al 1975a), thus indicating the need for site-specific information (Wise et al., 2000). To provide components of the water balance, a specific effort was made to estimate peat permeability through field tests. Field tests are thought to provide a better estimation of permeability than laboratory methods (Rycroft et al., 1975a; Dasberg and Neuman, 1977; Baird, 1997), since it is indeed difficult to obtain a representative sample of a highly heterogeneous medium and preserve a peat sample without damaging its structure (Hanrahan, 1954; Bromley et al., 2004). K-peat was measured in each piezometer using the hydrostatic time-lag method of Hvorslev (1951) based on the rate of water level rise in the piezometer after a sudden withdrawal of water. In previous studies, withdrawal tests have been found to be more reliable and accurate than slug insertion tests, even though slug-tests give a reasonably reliable indication of horizontal hydraulic conductivity (Baird et al., 2004; Surridge et al., 2005).
Sixteen large-diameter piezometers (Figure 1) were used to measure horizontal peat hydraulic conductivity (Kh-peat) at 1.20 to 3.5 m depth. Hydraulic conductivity varies with depth in the peat (Boelter, 1965; Ingram, 1983). Only one large piezometer was
Accepted Article
placed at less than 1.50 m depth. We used additional piezometers to characterize Kh-peat at shallower depth, i.e. one large piezometer at 0.90 m depth and several mini-piezometers at 1 m depth. The mini-mini-piezometers consisted of PVC tubes with a diameter of 10 mm (Lee and Cherry, 1978; Hinsby et al., 1992; Boulton, 1993). They were screened at the base (20-cm-long section) and were put into the peat by hammering with a steel T-bar down to a depth of 1 m. In the large piezometers, the water level recovery took a long time, typically several days, so we used pressure cells and acquisition equipment. The 16 large piezometers were tested once, 6 were tested twice. A total of 26 temporary mini-piezometers were set up at the three sites around the large piezometers, and also between them, to obtain an overall picture of the spatial distribution of hydraulic conductivity. At each site, mini-piezometers were tested twice. To check the permeability of the clay-rich layer, two slug-tests were also performed in the clay piezometer (K-clay) at the site S - left bank (Figure 1). All the slug-tests were performed during the summer of 2004.
To ensure the validity of the method in a medium such as peat, several conditions must be satisfied. (1) The length/radius ratio of the well screen should be higher than 8 (Horvslev, 1951). (2) The tube diameter is used in the calculation of hydraulic conductivity and could influence the determination of Kh-peat. Therefore, we tested both types of piezometer with different diameters at the same depth. As observed on site and in previous studies (Dai and Sparling, 1973; Clymo, 2004), the tube diameter does not have a significant influence on K-peat measurement. (3) To prevent eventual smearing, which could clog the peat pores and affect the water-head recovery, the tubes were developed by emptying twice before the beginning of monitoring (Butler, 1998; Baird et al., 2004). (4) In cases where the elastic properties and compressibility of the peat result in flow that violates Darcy’s law in humified peat, Hvorslev´s method (Hvorslev, 1951) becomes inappropriate and would lead to inaccurate estimation of Kh-peat (Ingram et al., 1974; Rycroft et al., 1975b; Hemond and Goldman, 1985; Van der Schaaf, 2004). However, the water-level recovery during the slug tests was very nearly log-linear, as required to apply the Hvorslev method. Baird and Gaffney (1994) compared the hydraulic conductivity of humidified fen peat assuming both rigid (Horvslev, 1951) and compressible (Brand and Premchitt, 1982) materials, showing that compression and swelling can affect head recovery during slug-tests. However, K
Accepted Article
values do not differ by more than a factor two, which is relatively low for a parameter that is known to vary by several orders of magnitude. In our study, we only used a general estimate of K-peat at the site scale and small-scale heterogeneities were not considered. Therefore, slug tests and Hvorslev’s theory appear to yield a reasonably reliable indication of K (Surridge et al. 2005). (5) Piezometers were tested twice (6 large piezometers and 26 mini-piezometers). Very little variations were observed between both slug tests, which ensured the validity of the results.
3.4 Components of the water balance and error estimation
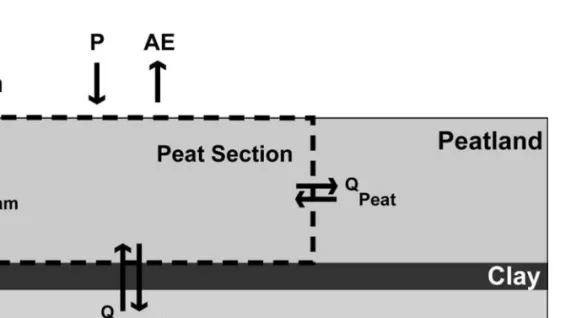
A mass balance approach is used to describe and quantify the hydrological budget of the peatland (Equation 1). The mass balance is performed for the year 2004 on a segment of terrain between the stream and a more distal zone of the peatland on a sub-annual scale (Figure 3).
ΔS = P – AE ± Q-peat ± Q-stream ± Q-sand (1)
where ΔS (mm) is the variation in water storage of the peatland; P (mm) is precipitation;
AE(mm) is the actual evapotranspiration;
Q-stream(mm) is the groundwater flow exchanged between the stream and the peat groundwater, as estimated from Darcy’s law;
Q-sand(mm) is the groundwater flow exchanged between the peat aquifer and the sand aquifer through the clay layer;
Q-peat(mm) is the peat groundwater flow of the investigated area exchanged with the rest of the peatland, as estimated from Darcy’s law.
The mass balance approach quantifies water flows (Table 1). However, errors in measurements and natural variability propagate through the calculation and can have a significant impact on the calculation (Winter, 1981; Barry and Morris, 1991; Owen et al., 2003). Thus, an error estimation is carried out for each term of the water balance and then summed in the final mass balance to define the upper and lower limits of the peatland water balance (Table 1).
Precipitation (P) represents an input and actual evapotranspiration (AE) an output. In wetlands, runoff is likely produced in the form of saturated overland flow (Hayashi et al., 1998; Evans et al., 1999; Holden, 2003; Holden and Burt, 2003b). At the investigated sites, the water table remains below the ground surface (Figure 2), which
Accepted Article
limits the production of saturated overland flow. As a result, runoff can be ignored and all the effective rainfall is considered as an input to the peat groundwater. In the Cotentin peatlands, there are very few trees and the grassed peatlands represent open areas. Not all rainfall reaches the soil, since some water evaporates directly from wet vegetation during and after rainfall events. As a first approximation, 15% of rainfall from grassland is “lost” by interception (Keliher, 1993). In our global approach, rainfall interception is not measured as a separate component, and therefore is included in the actual evapotranspiration component. Precipitation data and errors were provided by MeteoFrance according to the recommendations of the World Meteorological Organisation (OMM, 1994). Since the meteorological station was not located within the study area, the measured precipitation could differ from the actual precipitation at the studied sites. From the annual rainfall map of the Cotentin (Vernoux et al., 2000), we use the spatial variability of precipitation to estimate the error on precipitation input of the water balance.
Potential evapotranspiration (PE) was calculated by Meteofrance using the Penman-Monteith equation (Penman-Monteith, 1965; Penman, 1948), which is the most commonly used method to estimate PE (Abtew, 1996; Kite and Droogers, 2000; Rana and Katerji, 2000; Jacobs et al., 2002). The equation uses standard climatological records of insolation, air temperature, humidity and wind speed. The data are interpolated by an inverse method at squared distances and calculated at the nodes of a grid including the five nearest meteorological stations. From these data, actual evapotranspiration (AE) is derived by the soil reservoir method (De Marsily, 1986; Thornthwaithe and Mather, 1957), assuming a single soil reservoir storage capacity of 100 mm as commonly accepted for a temperate climate (Greiner, 1979; Mégnien, 1979). To refine the AE estimates, we make use of chloride concentration through a mass balance approach (Zhu et al., 2003). Chloride is an inert constituent remaining conservative during its passage through the unsaturated zone, so it is not involved in chemical reactions in peat except under ultra- saline conditions (Ours et al., 1997; Shotyk, 1997). Thus the rainfall signature is only modified by evapotranspiration. AE is computed from the ratio between peat and rain mean Cl– concentrations. The amount of water involved in evapotranspiration is
Accepted Article
[ ] [ ]
[ ]
- Peat Rain -Peat -Cl Cl Cl P. AE= − (2)[Cl-]Peat is the average chloride concentration in peat groundwaters, as measured in the
peat piezometers not showing any mixing with river waters (deep wells in the centre of the study area). [Cl-]
Rain is the weight-average chloride concentration in precipitation
measured from samples collected in a rain-funnel located at site S. We take the standard deviations of [Cl-]Peat and [Cl-]Rain as representing the uncertainty interval (Table 2).
Q-peat and Q-stream represent the horizontal groundwater flows exchanged with the stream and the rest of the peatland, respectively, and are calculated using Darcy´s law. K-peatis measured in the field and the horizontal hydraulic gradient is derived from the piezometric monitoring. At site S-left bank, the hydraulic gradients needed to be corrected because piezometers did not follow the main flow direction. Errors in estimating Q-peat and Q-stream correspond to the summed errors on the measured horizontal hydraulic gradient, the peat thickness and the peat hydraulic conductivity. The vertical hydraulic gradient was measured between the peat layer and the underlying sand aquifer. The screened section of peat piezometers was at 1.50-2 m depth and not just at the top of the clay rich-layer. Therefore, an equivalent hydraulic conductivity (K-equiv), which represents the peat bottom layer below the peat piezometers and the clay-rich layer, is estimated as the harmonic mean of hydraulic conductivity (Ki) and
thickness (ei) of each layer I, as shown by equation 3 (De Marsily, 1986).
∑
∑
= − i i i K e e K equiv (3)Errors on Kv-equiv include errors on the vertical hydraulic conductivity in peat (Kv-peat), the clay hydraulic conductivity (K-clay), the thickness of the lower peat layer and the thickness of the clay layer.
The water storage variation (ΔS) is the product of the height of the water table (h) and the peat specific yield (Sy), i.e.:
Accepted Article
ΔS = Δh.Sy (4)
where Δh (mm) is the head difference between the beginning and the end of the considered period.
The peat specific yield (Sy) varies with depth, particularly with the elevation of the water table (Ingram, 1983; Price, 1992; Price and Schlotzhauer, 1999; Schlotzhauer and Price, 1999). The lowering of the water table may cause surface subsidence, which is partly due to shrinkage above the water table and partly due to the compression of saturated peat beneath the water table (Schlotzhauer and Price, 1999; Kellner and Halldin, 2002). To estimate Sy, we use the data from continuous monitoring. Following a rainfall event (P in mm), the rise of the water table (h) is proportional to the specific yield (Sy) (Equation 5):
Sy =
h P
(5) Therefore, we apply Equation 5 to the short rainfall events of winter, thus ignoring the effects of horizontal groundwater flow, evapotranspiration and re-wetting of the profile. The variation of the storage uncertainties is the sum of uncertainties on the estimation of specific yield and the head difference measured in the field.
4. Results
4.1 Components of the water budget and error analysis
The hydrologic budget is quantified (Table 1) for the year 2004 on a sub-annual scale by considering the horizontal groundwater flow (see below). This latter is determined in a peat section at each site (Figure 1, Figure 3), and is defined as follows: stream – S4 –
S8 (3150 m2), stream – S16 – S20 (7320 m2) and stream – G2 – G6 (3360 m2) at site S-left
bank, site S-right bank and site G, respectively.
Precipitation and Evapotranspiration
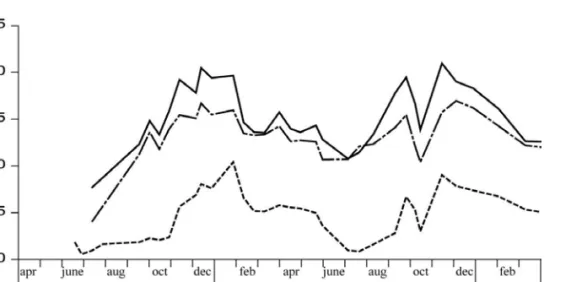
At the local meteorological station, 5 km north of the studied sites, the measured precipitation was 915 mm in 2004, accounting for more than 86% of the total inputs to the wetlands on each site (Table 1). Precipitation for 2004 was close to the 1946-2004
Accepted Article
annual mean (923 mm, Figure 4). The 1998-2002 period appeared relatively “wet”, with precipitation higher than 1100 mm per year. The following years, from 2003 to 2005, were drier, with precipitation below the annual mean value, while 2003 was particularly dry (764 mm). Therefore, we qualify 2003-2005 as a “dry” period (Figure 4).
For 2004, the PE is estimated at 723 mm. Actual evapotranspiration (AE) is a dominant component in the water balance but it is difficult to estimate precisely. It depends on the water table, vegetation cover and climate forcing (Ingram, 1983; Lafleur and Roulet, 1992). The net recharge is estimated from the PE. Under well watered conditions, as should be the case in wetlands where water is likely to be abundantly available, AE can be assumed to be equal to PE. However, field measurements (Figure 2) show that the water table dropped 1 m below the ground surface in the summer period, which indicates water-stressed conditions and suggests AE would be less than PE. Using the soil reservoir method (De Marsily, 1986; Thornthwaithe and Mather, 1957), AE is estimated at 572 mm, which represents 62% of the precipitation. Based on the chloride mass balance approach, AE represents 53 and 60% of precipitation for the sites G and S, respectively (Table 2). This corresponds to an AE value of 480 – 549 mm, which is relatively close to the estimates derived from the water budget method of Thornwaithe and Matter (1957). The evapotranspiration rate can be high in peatlands, sometimes reaching more than 90 % of P (Owen, 1995; Van Seters and Price, 2001), and even compensating or exceeding precipitation (Reeve et al., 2001; Van Seters and Price, 2002; Ferone and Devito, 2004). However, such high rates were only determined for periods of 3-4 months during the summer. The annual peat water balance shows similar evapotranspiration rates compared to our results, ranging from 50 to 75 % of precipitation (Devito et al., 1996; Fraser et al., 2001; Andersen, 2004). In the water budget calculated here, we use the mean AE value of 572 mm.
Horizontal groundwater flow (Q-streamand Q-peat)
The peat piezometric monitoring (Figure 2) shows that: 1) in the peat, local groundwater flow reverses between lower-water and high-water periods, although the stream water level remains mainly above the peat groundwater level at the three sites, and 2) groundwater flows in the peatland and through stream-peat groundwater exchanges are different between sites G and S. At site G, the stream water level remains
Accepted Article
above the peat groundwater level during the studied period. In the peatland, the flow direction changes between high-water and low-water periods. During the low-water periods (white areas – Figure 2b), the peat groundwater level is higher inside the peatland (G6) and lower on the edge (G3). Both G3 and G6 remain below the stream
water level. On this 2D view, the groundwater flows locally appear to converge. Therefore, the stream and the peat groundwater are locally and temporary disconnected during low-water periods. During high-water periods (grey areas – Figure 2b), the peat groundwater levels are similar both far away and close to the stream, showing a relatively flat groundwater table. The stream water level is above the peat groundwater level, reflecting local temporary inflow from the stream to the peat. The clay-rich layer could explain this disconnection. In section G (Figure 1b), the clay-rich layer is at a depth of 1.50 m, and is deeper throughout the inner zone of the peatland. Towards the stream location, the clay-rich layer could intersect with the stream bed and form a hydraulic barrier during low stream water-level conditions. At pumping site S (left and right bank), during most of the studied period (grey areas – Figure 2c, 2d), water flows from the stream to the peat, with the stream remaining above the peat groundwater level and the peat groundwater level falling with distance away from the stream bank (S16
-right bank, S8-left bank) towards the inner zone of the peatland (S20-right bank, S4-left
bank). Immediately after episodes of very high water level (shown in white – Figure 2c, 2d), the flow direction reverses in the peat, and the stream locally drains the peatland for a short period of time. Horizontal groundwater flow varies in the peatland throughout the hydrological cycle. The flow direction reverses at site S, with Q-stream and Q-peat alternately representing an input to or an output from the peatland. Meanwhile, the stream-peat connection at site G ceases during periods characterized by low stream water-level (i.e. Q-stream = 0). Therefore, we calculate the annual balance according to sub-annual periods depending on horizontal groundwater flow conditions.
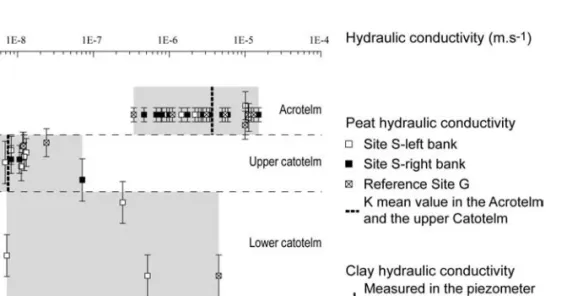
Kh-peat values cover several orders of magnitude, ranging from 1.4×10⁻⁹ to 1.5×10⁻⁵ m.s-1 (Figure 5). Other studies have shown peat hydraulic conductivity ranging between 6.0×10⁻¹⁰ and 2.8×10⁻³ m.s-1 depending on the botanical composition, degree of
humification, bulk density, type, structure or porosity of the peat (Hanrahan, 1954; Boelter, 1965, 1969; Rycroft et al., 1975a; Ingram, 1983; Vidal-Beaudet and Charpentier, 2000; Bradley, 2002; Clymo, 2004). In our study, K-peat shows a
depth-Accepted Article
correlated stratification (Figure 5). Three layers can be identified: an upper layer (0.6 - 1.2 m) with a high hydraulic conductivity (3.4×10⁻⁷ to 1.5×10⁻⁵ m.s-1), an intermediate layer (1.2 m - 2 m) with a lower permeability (1.4×10⁻⁹ m.s-1 to 6.0×10⁻⁸ m.s-1), and a deep layer (2 m - 3.5 m) with variable hydraulic conductivities (7.2×10⁻⁹ to 4.5×10⁻⁶m.s
-1). Peat hydraulic conductivity decreases with the degree of humification, which is
generally correlated with depth. However, the relationship is not always simple and significant (Boelter, 1965; Ingram, 1983; Chason and Siegel, 1986; Devito et al., 1996; Schlotzhauer and Price, 1999; Holden and Burt, 2003a; Clymo, 2004; Rizzuti et al., 2004; Baird et al., 2008). For the water balance, we estimate a mean value for Kh-peat using a stratified 3-layer model: (1) 0 - 1.2 m, (2) 1.2 - 2 m and (3) 2 - 6 m. In the upper and intermediate layers (Figure 5), Kh-peat displays a log-normal distribution and the equivalent Kh-peat is estimated as a geometric mean (De Marsily, 1986) with 2.8×10⁻⁶ m.s-1 in the upper layer and 7.4×10⁻⁹ m.s-1 in the intermediate layer. In the lower layer, there are only 4 values between 7.2×10⁻⁹ m.s-1 and 4.5×10⁻⁶ m.s-1, which does not allow an estimation of the mean. In this stratified medium, the mean horizontal hydraulic conductivity is weighted as the arithmetic mean of the mean value of the two upper layers and the highest and lowest value of the lower layer (De Marsily, 1986). The K-peat value used in the water balance is thus 2.0×10⁻⁶ ± 1.5×10⁻⁶ m.s-1.
The 2004 water balance shows that Q-peat and Q-stream reflect inflow on the annual scale at each site (Table 1). Q-Peat is relatively insignificant and Q-Stream dominates the horizontal groundwater flow. Q-stream is negligible in Site G (<1 % of the total inflow) because of the absence of input from the stream during low stream water-level conditions. However, at the sites S, Q-stream represents an inflow that can account for 11 % of the total inflow.
Vertical groundwater flow, Q-sand
The piezometric monitoring (Figure 2b, 2c, 2d) shows that the sand groundwater level was almost always below the peat groundwater level at both sites S during the studied period. At site G, it was mainly below the peat groundwater level except for 2 periods (June 2003 and June 2004) when it was almost the same. The vertical hydraulic gradient was always positive (Figure 6). Vertical potential groundwater flows always ran
Accepted Article
downward, from the peatland to the aquifer. The recharge downward gradient was higher at the sites S, where pumping had a greater effect.
At site G and site S-right bank, without taking account of flood events from the river, overall fluctuations of peat water level appear similar to those observed in the sand groundwaters (Figure 2b - 2c). Although precipitation events are more clearly observed in the peat aquifer, the long-term trends are similar, with simultaneous reversals and almost the same levels at reference site G (Figure 2b). Since the sand aquifer is confined below the peat aquifer in this area, both aquifers are unable to respond to similar episodes of recharge and discharge/evapotranspiration, especially because their thicknesses differ by one order of magnitude. This implies a hydraulic connection between the groundwaters in the peat and sand despite the presence of a clay layer. At site S-left bank, the link between peat and sand groundwaters is less clearly marked (Figure 2c), and a significant difference could be observed between the peat and the sand piezometric heads. This difference is related to the stream inflow, which maintains peat groundwater levels always close to stream levels. However, the clay piezometric level varies during the hydrological cycle (Figure 2d). Each water-level drop corresponds to groundwater sampling, which indicates a relatively high permeability of the clay at this location. The tests performed in the clay piezometer yield a permeability of 2.2×10⁻⁸ m.s-1 (Figure 5). In a previous study on the Lessay peatland located 20 km
west of the present study sites, Tortrat (2001) measured K-clay in the clay layer underlying the peatland, obtaining values in the range from 1×10⁻⁷ m.s-1 to 3×10⁻⁹ m.s-1, and a mean of 3.3×10⁻⁸ m.s-1, with the higher values being recorded close to a pumping site. According to these results, we take a mean value of 3.3×10⁻⁸ m.s-1 for the K-equiv computation, which is associated with K-clay values ranging from 1×10⁻⁷ m.s-1 to 3×10 -9 m.s-1 (see section: error estimation).
K-equiv is the equivalent conductivity of a two-layer section comprising the lower catotelm (5 m) and the underlying clay-rich layer (2.70 m at site S and 1.50 m at site G). Horizontal hydraulic conductivity in peat is measured by means of slug-tests, but peat is an anisotropic material in which the horizontal hydraulic conductivity Kh generally exceeds the vertical hydraulic conductivity Kv (Beckwith et al., 2003; Surridge et al., 2005). We use the mean anisotropy as expressed by the Kh/Kv ratio as measured by
Accepted Article
very similar to the bulk mean (= 0.57) found by Schlotzhauer and Price (1999). In the present study, we use a Kv-peat value of 5.6×10⁻⁷ m.s-1. According to Equation 2, the K-equiv values used in the computation are 9.8×10⁻⁸ m.s-1 and 1.2×10⁻⁷ m.s-1 at sites S and G, respectively.
Combined with the downward vertical gradient, the value of K-equiv adopted here gives rise to large groundwater flows from the peat to the underlying aquifer, representing 42% and 24% of the total outflow at pumping site S and reference site G, respectively. Although the clay layer is thinner and the K-equiv is higher, Q-sand outflow appears to be substantially lower at site G (183 m3/m2) than at site S (>400 m3/m2). We may conclude that the vertical hydraulic gradient is a dominant parameter in the water balance.
Storage variation
The estimated Sy ranges from 0.15 to 0.30, depending on the piezometer and the rainfall event in question. These values are clearly overestimated because evapotranspiration is considered as negligible, although some rainfall water undergoes evapotranspiration during short rainfall events. A wide range of Sy values, from 0.05 to 0.79, have been observed for peat deposits (Boelter, 1965; Bradley, 1996; Price and Schlotzhauer, 1999; Schlotzhauer and Price, 1999; Van Seters and Price, 2002; Price et al., 2003; Rosa and Larocque, 2008), so it is not possible to constrain this parameter any further. We assume a mean Sy value of 0.22 to quantify ΔS. At an annual scale, ΔS appears to show low values of -0.005 m3/m², -0.028 m3/m² and +0.012 m3/m² at site S-left bank, site S-right
bank and site G, respectively (Table 1).
Summary of error estimation
Precipitation. Data were provided by Meteofrance, the French National Meteorological Agency. The estimated accuracy of 5% is considered as acceptable according to the recommendations of the World Meteorological Organisation (OMM, 1994). The study sites are 5 km south of the meteorological station at the same elevation and in the same kind of landscape. The local map of annual precipitation (Vernoux et al., 2000) shows that precipitation at the studied sites is 50 mm higher than values measured at the
Accepted Article
meteorological station, i.e. around 5% of annual precipitation. We can thus define a ±10% uncertainty interval (Table 1).
Evapotranspiration. AE is estimated using two different methods (chloride mass balance and water soil reserve approaches) based on two different kinds of data. The AE value calculated from each method is similar, so it is assumed to be appropriate for calculating the water mass balance. In the chloride mass-balance approach (Equation 2), [Cl-]
Rain is
the parameter with the highest uncertainty in calculating AE. For every 1 mg/L difference in weighted average chloride in the precipitation, the calculated AE shows an increment of approximately 3.5%. In the water soil reserve method, AE is estimated from PE using the Penman-Monteith equation and precipitation data. In a marsh environment, the evapotranspiration rate measured daily with lysimeters shows a 10 % discrepancy with the Penman-Monteith estimation (Abtew and Obeysekera, 1995). Added to the 10% uncertainty interval of precipitation defined above, the uncertainty on AE used in the water mass balance should not exceed 20% (Table 1).
Horizontal groundwater flows. The errors on Q-peat and Q-stream are estimated by summing the errors on the horizontal hydraulic gradient, the peat section thickness and the peat horizontal hydraulic conductivity. Given the depth of the clay-rich layer, the uncertainty on the peat section is negligible. In the field, the uncertainty of the water level measurement did not exceed ± 1 cm. The error associated with the piezometer levelling did not exceed ± 3 cm. These errors appear very low compared to the uncertainty on horizontal K-peat (Kh-peat = 2.0×10⁻⁶ ± 1.5×10⁻⁶ m.s-1 corresponding to
75% uncertainty),leading to a ±80% uncertainty on Q-stream and Q-peat which mainly arises from the spatial variability of Kh-peat.
Vertical groundwater flow. Errors depend on the vertical hydraulic gradient, Kv-peat, K-clay and clay thickness. The relative error of the vertical hydraulic gradient depends on the field piezometric measurement, on the estimated thickness of the clay layer and on the underlying peat thickness below the piezometers. It does not exceed 10%. The main uncertainty is related to K-equiv, which depends on Kv-peat and K-clay. K-clay ranges from 1×10⁻⁷ m.s-1 to 3×10⁻⁹ m.s-1, which indicates a relatively heterogeneous layer and therefore a larger range for K-equiv (8×10⁻⁹ m.s-1 to 2.7×10⁻⁷). Kv-peat
Accepted Article
depends on Kh-peat and the degree of peat anisotropy. Kh-peat resulting from the slug test shows a wide range of values in the lower catotelm (7.2×10⁻⁹ m.s-1 to 4.5×10⁻⁶). Peat anisotropy can exhibit extremely large variations (Collis-George and Evans (1964) in Beckwith et al., 2003). The value used here in the water balance is derived from studies which sampled the upper peat layer (0-1.50m Beckwith et al., 2003; 0-0.30m Schlotzhauer and Price, 1999). No unequivocal uncertainty could be associated with this parameter. Thus, we computed a residual water balance RWB (Equation 6, Table 1) based on the assumption that the clay-rich layer is impermeable and forms a no-flow boundary condition. By introducing Q-sand = 0 into Equation 6.1, we obtain Equation 6.2.
RWB = Inflow – Outflow – ΔS (6.1) RWB = P – AE ± Q-peat ± Q-stream - ΔS (6.2) Worst possible estimates of the RWB consider that all the errors are additive (Winter, 1981). From Equation 6 and the previous error analysis, upper and lower limits can be computed with [highest inflow - lowest outflow] and [lowest inflow - highest outflow], respectively. The RWB upper and lower limits are positive for each site. Outflows are insufficient to balance inflows.
Change in storage. ΔS error depends on the errors associated with the water level measurement and the specific yield Sy. The relative error on the measured water level is estimated to be 4%. Sy ranges between 0.15 and 0.30, which corresponds to a relative error of 36%. When propagated in the computation, this leads to a relative error of 38% on ΔS, which could be considered as relatively large. However, since the absolute value of ΔS (< 0.028 m3/m²) is low, a 38% error on ΔS does not significantly affect the water
budget.
4.2 Hydrological functioning of the peatland
The horizontal groundwater flows, Q-peat and Q-stream, represent up to 122 m3/m²,
i.e.13.3% of the precipitation. Although not negligible, these values are significantly lower than P and AE. Although these groundwater flows might influence the wetland
Accepted Article
functioning from a chemical point of view, they remain almost negligible in the water balance.
The peat and sand groundwater levels (Figure 2) show similar fluctuations compared with the water balance results (Table 1), which can be explained by a hydraulic continuity between the sand and the peat aquifers. Following the assumption of an impermeable clay-rich layer, the RWB is positive (inflow - outflow ranging from 0.100 to 0.805 m3/m²) for the three sites, even when taking into account the highest uncertainties. Clearly, an equilibrated water budget requires an additional outflow. The only way to remove water from the peat sections would be a downward groundwater flow from the peatland through the clay-rich layer (Q-sand). Field measurements of K-clay yield values between 1×10⁻⁷ m.s-1 and 3×10⁻⁹ m.s-1 (Tortrat, 2001). These values
are higher than those usually obtained in clays: 10-9 – 10-13 m.s-1 (De Marsily, 1986). In the Lessay area (Tortrat, 2001), higher clay hydraulic conductivities have been measured in the vicinity of the pumping station. Therefore, we propose that the piezometric depression in the sand could lead to desaturation of the clay layer, thus favouring its drying out and the creation of preferential pathways for groundwater. The clay layer appears to be permeable and does not form a hydraulic barrier between the peatland and the sand aquifer.
The water budget is largely dominated by precipitation and evapotranspiration. The vertical flows (P, AE and Q-sand) are predominant, defining the main contribution to wetland functioning, with Q-sand representing 20 to 48% of precipitation. This emphasizes the role of groundwater flow in wetland functioning. Apart from wetlands where there is no connection with underlying geological systems, the influence of groundwater flows should be monitored when carrying out hydrological investigations of wetlands.
5 Discussion: Climatic or anthropogenic origin of hydric deficit
5.1 Hydric deficit of the peatland
The peat groundwater level at the three studied sites was never higher than 20 cm below the soil surface, while it reached a maximum depth of 1.20 m. There is a permanent
Accepted Article
unsaturated layer. The peatland was never flooded during the study period, i.e. the water table did not intersect the ground surface, even though flooding usually takes place each winter.
Most hydrologists distinguish two major hydrologic zones in a peat soil profile (Ingram, 1983; Chason and Siegel, 1986): (1) an upper aerated zone with relatively undecomposed leaves and dead vegetation, the acrotelm, with fluctuating water level and rapid water transmission, and (2) an underlying anaerobic zone, the catotelm, where peat is more humified, associated with constant water saturation and a lower hydraulic conductivity. The acrotelm thickness, corresponding to the water-table fluctuation zone, is usually about 0.5 m (Chason and Siegel, 1986; Reeve et al., 2000; Fraser et al., 2001). At the Cotentin sites, the water table fluctuated in a depth range from 0.20 to 1.20 m, which indicates the presence of a thicker acrotelm than is usually described. Measurements of peat hydraulic conductivity at around 1m depth show a particularly highly permeable layer at this depth (Figure 5), overlying a layer with lower hydraulic conductivity which would correspond to the catotelm. This suggests that the acrotelm reached a depth of 1.20 m, with this greater thickness being related to the higher amplitude of the water-table fluctuations. The boundary between the two zones is also observed through the organic matter content of the peat (Bouillon-Launay, 2002). To lower the water-table level in the peat layer, it is necessary to change the water balance either by increasing the output from or decreasing the input into the wetlands. In both cases, the amount of water stored in the peatland is lower than previous conditions. Such low water levels are clearly contrasted with the frequent flooding during the last decades, indicating a present hydric deficit.
In the studied wetland, the stream water level was always above the peat groundwater level. Under temperate climates in this type of landscape, we would expect a stream to drain the peatland, but this is not the case because the stream mainly represents an inflow. Episodes of flow reversal have been recorded at the studied sites. Other studies have reported such episodes during prolonged periods in summer characteristic of hydric deficit (Gilvear et al., 1997; Bradley, 2002; Burt et al., 2002). However, in the Cotentin peatlands, the episodes of “flow reversal” (grey areas at S-sites, Figure 2c, 2d) are notably longer than usually reported, contributing to nearly all the functioning of the
Accepted Article
peatland hydrology. This reflects a considerable hydric deficit, which could not be attributed only to a prolonged dry summer.
The peatland was not flooded during the study period, and the water table dropped to a lower level in the peat profile reflecting the presence of a thicker acrotelm. The lack of horizontal flow from the wetland to the stream argues in favour of a hydric deficit of the peatland over the last few years. Wetlands continuously receive or lose water through interchange with the atmosphere, streams and groundwater (Winter and Woo, 1990). The water balance of the peatland depends on the relative importance of the spatiotemporal variability of each of these components. In the present study, we show that vertical flows (P, AE and Q-sand) are predominant. This leads us to assume that inputs (P) have decreased in the last few years and/or outputs have increased (AE, Q-sand), thus accounting for the apparent hydric deficit of the peatland.
5.2 Influence of aquifer-water production
At site S, the hydrological functioning mainly reflects a lack of horizontal groundwater flow from the wetland to the stream at any period. Compared to usual wetland functioning and reference site G, this behaviour clearly results from pumping in the sand aquifer. The hydraulic continuity between the peat and the sand aquifers leads us to consider the two aquifers together. The size of the aquifers (132 km2 for the sand
aquifer and locally only a few square kilometres for the peatland) implies that the sand groundwater level controls the peat groundwater level. Therefore, a lowering of the sand groundwater level leads directly to a fall in the peat groundwater level. In the present study, the sand piezometric depression due to withdrawal does not exceed 0.5 m in the pumping well, which is rather weak for a large aquifer more than 70 m thick. In the Catfield Fen, England, groundwater makes up only a minor component of the water balance of the fen. However, using a 2D-model with 4 geological layers (acrotelm, catotelm, clay and the Pleistocene aquifer Crag) it has been shown that decreasing the Crag pressure heads by abstraction would lower the base level to such a degree that the system could not compensate and the wetland would dry out (Gilvear et al., 1997). Similarly, in the present study, the peat groundwater level varied between 0.2 and 1.2 m depth under the soil surface. A small increase of the base level would easily favour
Accepted Article
saturation of the upper part of the peat layer. The piezometric depression due to water extraction could explain, at least partly and locally, the lack of flooding of the peatland during the studied period.
This result reflects the great sensitivity of the peat to the underlying hydrogeological conditions. Any modification will influence the water balance, and thus also the elevation of the water-table in the peat layer. The peat water level marks the boundary between saturated and unsaturated zones in a context where saturation is the main parameter in peat preservation. Moreover, at a local scale, the influence of pumping produces continuous fluxes of oxidizing water from the stream to the peat, which could induce biochemical modifications involving fluxes of oxygen and other nutrients associated with the stream inflow. Such effects have been clearly observed, for example, in the higher oxidation-reduction levels and higher sulphate concentrations at site S-left bank compared to the reference site G (Bougon et al., 2010).
5.3 Influence of climate fluctuations
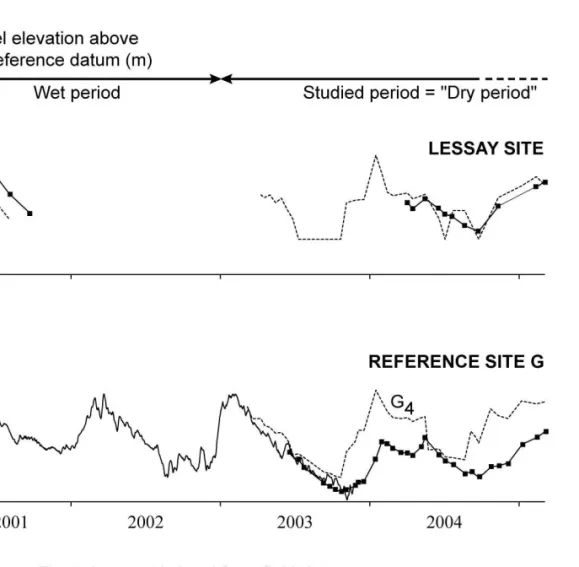
The study period (2003-2005) appeared drier, with lower annual precipitation than the previous period (1998-2002). These conditions contributed not only to decreased precipitation input to the water balance, but also a lowering of the sand groundwater level in the underlying aquifer (Figure 4). In the Lessay area (Tortrat, 2001), the sand groundwater level exceeded the peat groundwater level during the wet period (Figure 7). The sand aquifer sustained the peat groundwater level, or at least, the sand aquifer head limited potential downward flow. In that case, the high peat groundwater level and peatland flooding were correlated with the regional discharge of the aquifer. During the dry period (this study), the pumping rate did not change, but the sand groundwater level was lower and the vertical hydraulic gradients appeared to be downward from the peatland to the sand aquifer as a consequence of lower precipitation. On the contrary, the previous wet period shows that a continuous upward flow from the sandy aquifer created favourable hydrologic conditions for wetland functioning. At reference site G, outside of the influence of the pumping well, the vertical hydraulic gradient was downward (Figure 7) and the sand groundwater level was lower than during the previous period (1998-2002). Moreover, during dry periods, there was a decrease in
Accepted Article
direct precipitation input to the wetland. At a global scale, climate conditions influenced the sand aquifer recharge, lowering the groundwater level in the sand and thus increasing the Q-sand output from the peatland. The dry period also reduced the peat recharge and led to a hydric deficit in the peatland.
5.4 Sensitivity and vulnerability of the peatland
This study indicates that both climate and water extraction clearly have an impact on the peat water balance, even though their effects are difficult to distinguish. They produce the hydric deficit observed at both pumping site S and reference site G. The climatic effect is mainly expressed through the drying out of peat (reference site G), whilst the anthropogenic effect leads to i) an enhancement of the climatic effect on a global scale, and ii) a modification of the fluxes (i.e. lack of horizontal groundwater flow from the stream draining the peatland) at a local scale (pumping site S). The peat-sand interaction has a major impact on the vulnerability of the peatland under dry conditions. The combined effects of a dry period and water extraction from the aquifer accounts for the low water table in the peat, lower than the stream water level, thus explaining why the stream did not drain the peatland. The peat groundwater level depends on the sand groundwater level. The almost permanent river inflow at the S-sites provides clear evidence of the anthropogenic effect of water extraction at a local scale. The sand aquifer water-table locally fell to a base level lower than under natural conditions, making the peatland more sensitive to low precipitation.
Annual precipitation in 2004 (915 mm) was close to an average year (923 mm) (Figure 4). However, the previous year 2003 (764 mm) was dry, with precipitation 17% lower than the annual mean. Such variations are clearly within the potential range related to climate change over the next few decades. This could represent an important issue since low precipitation has a major impact on water levels in the peatland and hydrological functioning, leading to severe droughts. Furthermore, the 0.5-m lowering of the sand water table related to pumping is similar to the water level variation between the ‘wet’ and the ‘dry’ period in this aquifer outside the zone of pumping influence. This indicates that anthropogenic and climatic effects may be of the same order of magnitude, and their combined influence could lead to a drastic drying out of the peat.
Accepted Article
The geomorphological context of the study site is typical of the Cotentin wetland, which represents the largest peatland in France. Peatlands are more dependent on the local hydro-geomorphological context (low-lying topography, groundwater table near the ground surface, etc.) than wet climate conditions (Vernoux et al., 2000). The Cotentin peatlands provide a typical example of peatland-aquifer interaction under oceanic climate conditions with high annual precipitation (> 900 mm). This study shows that changes of the hydrogeological context, such as a lowering of the underlying sand groundwater level, can substantially modify the peat water balance. Such changes increase the sensitivity and the vulnerability of peatlands to dry climate conditions. Wetlands could be dramatically impacted by anthropogenic and climatic changes on relatively short time scales since the maintenance and growth of a peatland depends essentially on hydrological conditions such as depth of the water table, as well as duration and frequency of the flooding period. After drying out, the volume of peat decreases and its physical properties are not fully restored after resaturation (Winter and Woo, 1990). Therefore, frequent desaturation and short flooding episodes, resulting from global warming and/or anthropogenic influence, can lead to a peat hydric deficit, as shown in this study, which may irreversibly alter the hydrologic characteristics of the peatland. This could cause an acceleration of peat decay and, moreover, a modification of the carbon budget as well (Waddington and Roulet, 1997).
Accepted Article
References
Abtew W, Obeysekera J. 1995. Lysimeter Study of Evapotranspiration of Cattails and Comparison of Three Estimation Methods. Transactions of the ASABE 38:121-129.
Abtew W. 1996. Evapotranspiration measurements and modeling for three wetland systems in South Florida. Water Resources Bulletin 32:465-473. DOI: 10.1111/j.1752-1688.1996.tb04044.x.
Andersen HE. 2004. Hydrology and nitrogen balance of a seasonally inundated Danish floodplain wetland. Hydrological Processes 18: 415-434. DOI:
10.1002/hyp.1277.
Baird AJ. 1997. Field estimation of macropore functioning and surface hydraulic conductivity in a fen peat. Hydrological Processes 11: 287-295. DOI: 10.1002/(SICI)1099-1085(19970315)11:3<287::AID-HYP443>3.0.CO;2-L Baird AJ, Eades PA, Surridge BWJ. 2008. The hydraulic structure of a raised bog and
its implications for ecohydrological modelling of bog development. Ecohydrology 1: 289-298. DOI: 10.1002/eco.33.
Baird AJ, Gaffney SW. 1994. Cylindrical piezometer responses in a humified fen peat. Nordic Hydrology 25: 167-182.
Baird AJ, Surridge BWJ, Money RP. 2004. An assessment of the piezometer method for measuring the hydraulic conductivity of a Cladium mariscus - Phragmites australis root mat in a Norfolk (UK) fen. Hydrological Processes 18: 275-291. DOI: 10.1002/hyp.1375.
Baize S. 1998. Tectonique, Eustatisme et Climat dans un système Geomorphologique Côtier, Le Nord-Ouest de la France au Plio-Pléistocène : Exemple du Cotentin (Normandie). PhD. University of Caen.
Barry BA, Morris MD. 1991. Errors in practical measurement in surveying, engineering, and technology. Landmark Enterprises: Rancho Cordova, Calif; 183.
Blodau C, Basiliko N, Moore T.R. 2004. Carbon turnover in peatland mesocosms exposed to different water table levels. Biogeochemistry 67: 331-351. DOI: 10.1023/B:BIOG.0000015788.30164.e2.
Brand EW, Premchitt J. 1982. Response characteristics of cylindrical piezometers. Geotechnique 32: 203-216.
Bragg, O, Lindsay, R. 2003. Strategy and Action Plan for Mire and Peatland Conservation in Central Europe. Wetlands International, Wageningen, The Netherlands. vi + 94 pp
Accepted Article
Beckwith CW, Baird AJ, Heathwaite AL. 2003. Anisotropy and depth-related heterogeneity of hydraulic conductivity in a peat bog. I: Laboratory measurements. Hydrological Processes 17: 89-101. DOI: 10.1002/hyp.1116. Boelter DH. 1965. Hydraulic conductivity of peats. Soil Science 100: 227-231.
Boelter DH. 1969. Physical properties of peats as related to degree of decomposition. Soil Science Society of America Proceedings 33: 606-609.
Bougon N., Auterives C., Aquilina L., De Ridder J., Marmonier P., Vandenkoornhuyse P. 2010. Influence of hydrological fluxes on bio-geochemical processes in a peatland. J. of Hydrology (submitted).
Bouillon-Launay E. 2002. Intérêts des indicateurs hydropédologiques dans la gestion raisonnée des zones humides. Application aux marais du Cotentin. PhD Thesis Université de Caen.
Boulton AJ. 1993. Stream ecology and surface-hyporheic hydrologic exchange: Implications, techniques and limitations. Australian journal of marine freshwater research 44: 553-564. DOI: 10.1071/MF9930553.
Bradley C. 1996. Transient modelling of water-table variation in a floodplain wetland, Narborough Bog, Leicestershire. Journal of Hydrology 185: 87-114. DOI: 10.1016/0022-1694(95)03005-0.
Bradley C. 2002. Simulation of the annual water table dynamics of a floodplain wetland, Narborough Bog, UK. Journal of Hydrology 261: 150-172. DOI: 10.1016/S0022-1694(02)00012-4
Brinson MM. 1993. A Hydrogeomorphic Classification for Wetlands. Technical Report WRP-DE-4. U.S. Army Corps of Engineers Washington, DC 20314-1000, 79. Bromley J, Robinson M, Barker JA. 2004. Scale-dependency of hydraulic conductivity:
an example from Thorne Moor, a raised mire in South Yorkshire, UK. Hydrological Processes 18: 973-985. DOI: 10.1002/hyp.1341
Burt TP, Pinay G, Matheson FE, Haycock NE, Butturini, A, Clément JC, Danielescu S, Dowrick DJ, Hefting MM, Hillbricht-Ilkowska A, Maitre V. 2002. Water table fluctuations in the riparian zone: comparative results from a pan-European experiment. Journal of Hydrology 265: 129-148. DOI: 10.1016/S0022-1694(02)00102-6
Butler JJ. 1998. The Design, Performance, and Analysis of Slug Tests Boca. Lewis Publishers: Raton, Florida; 252 .
Chason DB, Siegel DI. 1986. Hydraulic conductivity and related physical properties of peat, Lost River Peatland, Northern Minnesota. Soil Science 142: 91-99.
Clément JC, Aquilina L, Bour O, Plaine K. Burt TP, Pinay G. 2003. Hydrological flowpaths and nitrate removal rates within a riparian floodplain along a
fourth-Accepted Article
order stream in Brittany (France). Hydrological Processes 17: 1177-1195. DOI: 10.1002/hyp.1192.
Clymo RS. 1983. Peat. In Ecosystems of the world, Vol 4A, Mires: Swamp, Bog, Fen and Moor. Gore AJP (Eds). Elsevier, 159-224.
Clymo RS. 2004. Hydraulic conductivity of peat at Ellergower Moss, Scotland. Hydrological Processes 18: 261-274. DOI: 10.1002 /hyp.1374.
Collis-George N, Evans GN. 1964. A two well method of determining the hydraulic conductivity of discrete layers in layered saturated soilsin the field. Australian Journal of Soil Research 2: 8–19.
Dai TS, Sparling JH. 1973. Measurement of hydraulic conductivity of peats. Canadian Journal of Soil Science 53: 21-26.
Dasberg S, Neuman SP. 1977. Peat hydrology in the Hula Basin, Israël: 1. Properties of Peat: Journal of Hydrology 32: 219-239. DOI:10.1016/0022-1694(77)90018-X. De Marsily G. 1986. Quantitative Hydrogeology: Groundwater Hydrology for
Engineers. Academic Press, Inc.: Orlando, Florida; 440.
Devito KJ, Hill AR, Roulet N. 1996. Groundwater-surface water interactions in headwater forested wetlands of the Canadian Shield. Journal of Hydrology 181: 127-147. DOI: 10.1016/0022-1694(95)02912-5.
Devito KJ, Waddington JM, Branfireun BA. 1997. Flow reversals in peatlands influenced by local groundwater systems. Hydrological Processes 11: 103-110. DOI: 10.1002/(SICI)1099-1085(199701)11:1<103::AID-HYP417>3.0.CO;2-E. Dowrick DJ, Freeman C, Lock MA, Reynolds B. 2006. Sulphate reduction and the
suppression of peatland methane emissions following summer drought. Geoderma 132: 384-390. DOI:10.1016/j.geoderma.2005.06.003.
Dugué O. 2003. The Pliocene to Early Pleistocene marine to fluviatile succession of the seuil du Cotentin basins (Armoricain Massif, Normandy, France). Journal of Quaternary Science 18: 215-226. DOI: 10.1002/jqs.745.
Evans MG, Burt TP, Holden J, Adamson J K. 1999. Runoff generation and water table fluctuations in blanket peat: evidence from UK data spanning the dry summer of 1995. Journal of Hydrology 221: 141-160. DOI: 10.1016/S0022-1694(99)00085-2.
Ferone JM, Devito KJ. 2004. Shallow groundwater-surface water interactions in pond-peatland complexes along a Boreal Plains topographic gradient. Journal of Hydrology 292: 75-95. DOI: 10.1016/j.jhydrol.2003.12.032.
Fetter CW. 2001. Applied Hydrogeology (4th