Publisher’s version / Version de l'éditeur:
Canadian Geotechnical Journal, 12, 3, pp. 413-424, 1975-08
READ THESE TERMS AND CONDITIONS CAREFULLY BEFORE USING THIS WEBSITE.
https://nrc-publications.canada.ca/eng/copyright
Vous avez des questions? Nous pouvons vous aider. Pour communiquer directement avec un auteur, consultez la première page de la revue dans laquelle son article a été publié afin de trouver ses coordonnées. Si vous n’arrivez pas à les repérer, communiquez avec nous à [email protected].
Questions? Contact the NRC Publications Archive team at
[email protected]. If you wish to email the authors directly, please see the first page of the publication for their contact information.
NRC Publications Archive
Archives des publications du CNRC
This publication could be one of several versions: author’s original, accepted manuscript or the publisher’s version. / La version de cette publication peut être l’une des suivantes : la version prépublication de l’auteur, la version acceptée du manuscrit ou la version de l’éditeur.
Access and use of this website and the material on it are subject to the Terms and Conditions set forth at
Thermal conductivity of some ice rich permafrost soils
Slusarchuk, W. A.; Watson, G. H.
https://publications-cnrc.canada.ca/fra/droits
L’accès à ce site Web et l’utilisation de son contenu sont assujettis aux conditions présentées dans le site LISEZ CES CONDITIONS ATTENTIVEMENT AVANT D’UTILISER CE SITE WEB.
NRC Publications Record / Notice d'Archives des publications de CNRC:
https://nrc-publications.canada.ca/eng/view/object/?id=a906ebad-4bc6-46df-ad5e-65633866edad https://publications-cnrc.canada.ca/fra/voir/objet/?id=a906ebad-4bc6-46df-ad5e-65633866edadThermal Conductivity of Some Ice-rich Permafrost Soils
W. A. SLUSARCHUK'
Division of Building Research, Nafiotlal Research Corrncil of Canada, O t t a w a , can ad(^ AND
G . H . WATSON~
Mackenzie Valley Pipe Line Research Ltd., Calgary, Alberta
Received July 19,1974 Accepted March 19, 1975
Values are presented for the thermal conductivity of frozen and thawed ice rich permafrost soils from Inuvik, Northwest Territories, measured under field and laboratory conditions with a cylindrical heat source. Samples were shipped to Ottawa, Canada, in the frozen condition at temperatures ranging from -5 to -70 "C. It was found that temperature of shipping and reposi- tioning of the probe between measurements had no statistically significant effect on results. The dependence of thermal conductivity on bulk unit weight and dry unit weight is given for both frozen and thawed samples. Measured thermal conductivities were found to be in good agreement with other values obtained for similar soils and corresponding unit weight and water content.
Des valeurs de conductivite thermique sont donnees pour du pergClisol riche en glace de Inuvik, Territoires Nord-ouest a I'Ctat gel6 et dCgelC, telles que dtterminees sur place et en laboratoire au moyen d'une source cylindrique de chaleur. Des echantillons furent expediCs a Ottawa a des temperatures de -5 "C et -70 "C. On a constat6 que ni la temperature d'exptdition ni la reinsertion de la sonde entre les prises de mesure n'avait d'effet significatif sur les resultats. La dependance de la conductivid thermique sur le poids unitaire total et le poids unitaire sec est dCmontr6e et pour des Cchantillons gelCs et pour des tchantillons degelts. Les conductivitCs thermiques ainsi dCterminCes sont en bon accord avec d'autres valeurs obtenues pour des sols semblables et pour poids unitaire et teneur d'eau correspondants. [Traduit par la Revue]
Introduction
Construction activities and the operation of engineering structures in the North will alter the natural ground thermal regime. The amount of alteration will depend upon factors such as disturbance during construction and the operating temperatures of the structures. If thawing of the permafrost foundation soils does take place, then it will be desirable to be able to predict the amount and rate of thawing. For some situations this is essential because of dramatic differences in the strength, settlement, and permeability characteristics of ice-rich permafrost soils in the frozen and thawed states.
There is a particular need to be able to pre- dict ground temperatures around warm pipe- lines in permafrost. Mackenzie Valley Pipe Line Research Limited therefore undertook 'Present address: R. M. Hardy and Associates Limited, 218-18th St., S.E., Calgary, Alberta T2E 6J5. 'Present address: Acres Consulting Services Lim- ited, 990-125-9th Ave., S.E., Calgary, Alberta T 2 G OP6.
investigations of the effects of a warm pipe- line on the ground thermal regime at a test facility near Inuvik, Northwest Territories, where the top 10 to 15 ft ( 3 to 4.6 m ) of ground consists mainly of ice-rich soil.
An important property required for ground temperature calculations is the thermal con- ductivity of the soil. Little information is avail- able on the thermal conductivity of ice-rich permafrost soils in the frozen and thawed con- dition. A joint research project was undertaken by Mackenzie Valley Pipe Line Research Limited and the Division of Building Research, National Research Council of Canada, to ob- tain conductivity values for the soils at the Inuvik test facility.
The thermal conductivity of large-diameter cores of ice-rich soil was measured with a cylindrical probe in a field laboratory located at Inuvik, and under more precisely controlled conditions in the laboratories of the Division of Building Research at Ottawa. Two methods of maintaining the temperatures of the frozen cores below freezing (dry ice and controlled
414 CAN. GEOTECH. J. VOL. 12, 1975
r"..-
9 PIN MINIATURE CONNECTOR0 - 0 1 0 " DIA. T E F L O N COATED CONSTANTAN WIRE
9; O.D. x 9; I.D. PLASTIC C A N U S
C - 3 2 C A S T I N G R E S I N T H E R M I S T O R SECTION A - A
3/i
O D x 0 0 3 5 " THK STAINLESS STEEL TUBETHERMISTOR----
EPOXY
SECTION B - B
31;
Fro. 1. Thermal conductivity probe.
temperature freezer) were used in bringing the cores from Inuvik to Ottawa. This paper pre- sents the results of the investigation.
Thermal Conductivity Probe
A thermal conductivity probe (Fig. 1 ) was developed specifically for taking measurements in ice-rich permafrost soils (Slusarchuk and Foulger 1973). It is 13 in. (33 cm) long and
in. (0.95 cm) in diameter, and its heat output was kept sufficiently low to ensure that the resulting temperature rise would be small (as little as 0.3 " C ) during a 30- to 60-min test. It is simple to operate, portable, and reasonably rugged, so that it can be used in the field as well as in the laboratory.
The theory for the probe was presented earlier by Blackwell (1954) and Jaeger
SLUSARCHUK AND WATSON: THERMAL CONDUCTIVITY 415
(1956). For the present case it is assumed that the probe has a finite radius and heat capacity and that a contact resistance is present between the probe and the medium. If heat is supplied at a constant rate, beginning at time zero, the temperature rise is given by (Jaeger 1956)
where T = temperature rise,
Q = heat flux per unit length of probe,
k = thermal conductivity of soil, G = an integral function,
b = radius of probe,
H = conductance of contact layer,
p = density of medium,
c = mass heat capacity of medium,
M = mass of probe per unit length, C = mass heat capacity of probe,
u = thermal diffusivity of soil,
t = time.
The G function can be expanded into a series, and by neglecting terms that rapidly become small the temperature rise of the probe can be shown to be
where D = 1.78 1 1 (the natural logarithm of Euler's constant). The thermal properties of the probe are not involved in this long-term solution, but the effect of the contact layer is present. If temperatures are taken within the probe at different times, the thermal conduc- tivity of the surrounding medium is given by
Equation [3] shows that the measured value does not depend on the thermal properties of the probe, the thermal resistance of the con- tact layer, or the radial position of the temper- ature sensing device within the probe.
In the development of Eq. [3] it was as- sumed that the cylindrical heat source was infinitely long and that it was placed in a sample with an infinite diameter. Blackwell (1956) showed that although probes of finite length departed from these assumptions, the errors in the measured values of conductivity
would be small (less than 1 % ) if the length- to-diameter ratio of the probe was greater than 25. This error due to axial heat flow in the probe is time dependent, however, and for the probe and samples used in this study the dura- tion of the test period was limited to 30 to 60 min in order to make it negligible.
The diameter of the samples was established using the criterion recommended by Wechsler
( 1966). It assumes that the measured conduc- tivity values do not have a significant error if the heat flowing through or reflected by the radial boundaries of the sample is much less than the heat supplied by the probe. This cri- terion can be expressed by
exp
(
-
g)
<
0.02where R = radius of sample. Samples approxi- mately 12 in. (30.5 cm) in diameter were ob- tained for the testing program in order to sat- isfy this criterion.
Calibration
The guarded hot plate is the standard method recommended for determining the thermal conductivity of a material (ASTM C177-63). Because of the inherent advantages of determining thermal conductivity of perma- frost with a probe, it was selected as the test apparatus, but it was calibrated using the standard guarded hot plate method. The pro- cedures, equipment, and materials used dur- ing calibration of the probes (five were used in the test and calibration programs) and the results obtained are discussed elsewhere (Slu- sarchuk and Foulger 1973 )
.
Sampling and Sample Handling
All the samples of ice-rich permafrost were obtained in the vicinity of Inuvik, Northwest Territories, during the spring of 1972, using a specially fabricated 5-ft (1.5-m) long single- wall core barrel with an inside diameter of
13 in. ( 3 3 cm) and a wall thickness of 1 in. (2.54 c m ) . The barrel was advanced by slow- ly rotating it under constant pressure, using a Nodwell Mounted Mayhew Rig. After pene- trating to the desired depth, the barrel was extracted and the core freed. Ambient air temperatures were below freezing during this operation. From the cores, 24 samples ap-
416 CAN. GEOTECH. J. VOL. 12. 1975 proximately 15 in. (38 cm) in length and 12
in. (30.5 cm) in diameter were obtained. The samples were wrapped in plastic and stored in a walk-in freezer, which also served as the field laboratory in which conductivity and bulk unit weight measurements were performed.
When the series of tests had been completed at Inuvik, the samples were divided into two groups. One group was transported to Ottawa in freezers whose temperature was maintained at about -5 2 2 OC; the second was trans- ported under uncontrolled freezing conditions in insulated boxes using dry ice as the cold source. The two methods were used to check whether the simpler and cheaper method of using dry ice significantly affected the results.
Probe Tests
Thermal conductivity tests were performed on ice-rich permafrost soil samples in the frozen and thawed states. In the frozen state the samples were tested at a temperature of 19 & 0.6 O F (-7.2 & 0.3 OC) at Inuvik and
at a temperature of 24 a 0.25 O F (-4.4 i
0.15 OC) at Ottawa. After testing in Ottawa, the frozen samples were thawed and tested again at a temperature of approximately 70
*
0.5 O F (21.1 i 0.3 OC). The tests were cate-
gorized as follows:
Frozen samples (undisturbed permafrost) ( a ) Tested in Inuvik;
( b ) Tested in Ottawa-shipped in dry ice; ( c ) Tested in Ottawa-shipped in controlled
temperature freezers. Thawed samples
( a ) Tested in Ottawa-thawed under load; ( b ) Tested in Ottawa-reconstituted.
In all, 235 tests were performed on the un- disturbed permafrost samples, 137 tests at Inuvik and 98 at Ottawa. A total of 5 8 tests were performed on the thawed permafrost soil samples, 4 2 tests on samples thawed under load and 16 on reconstituted samples.
Tests on Undisturbed Permafrost Samples Twenty-four samples were tested in the frozen state at Inuvik and 15 samples at Ot- tawa. Of the 15 samples tested at Ottawa, 10 were shipped in dry ice.
Sample Preparation
A cylindrical hole 3/s in. (0.95 cm) in diameter and approximately 15 in. (-38 cm)
in length was drilled in each permafrost sam- ple to permit insertion of the thermal conduc- tivity probe. Located along the longitudinal axis of the core, the hole was drilled with a %-in. (0.95 cm) diameter bit that had a 15-in. (38.1 cm) flute. A variable speed drill was clamped to a specially fabricated drill stand so that the hole could be drilled verti- cally. When possible, it was drilled in one pass at the lowest speed possible without hav- ing the bit stick. If the bit stopped rotating, it quickly froze in place and was difficult to remove. A %-in. (0.63-cm) carbide tipped bit was used when a stone was encountered.
The holes were plugged immediately after drilling with a %-in. (0.95 cm) diameter stainless steel tube greased with silicone. This greased plug was inserted to eliminate subli- mation of the ice exposed in the hole. The silicone grease also filled the air voids between the plug and the permafrost and kept the plug from freezing in place. The samples were re- wrapped tightly with plastic sheeting (to re- duce sublimation from the outside surfaces of the sample) and stored for testing.
Test Procedure
A sample required approximately 24 to 28 h to re-establish its original, constant tem- perature after a hole had been drilled in it. After this time it was moved to the test area of the cold room and placed on a 2-in. (5.08- cm) thick slab of styrofoam insulation. The stainless steel plug was removed and a probe with a surface layer of silicone grease was inserted into the hole. The probe had to be eased into the hole with a clamp attachment because of the tight fit. The clamp was secured to the top of the steel tube portion of the probe and was removed after insertion. The depth of placement of the probe was recorded. Two layers of glass fibre insulation 1 in. (2.54 cm) thick were wrapped around the sample and a 2-in. (5.08-cm) styrofoam slab placed on top. This slab had a hole in it sufficiently large to permit the electrical leads from the control unit to be attached to the probe.
The temperature of the sample was moni- tored before a test began. If the temperatures recorded over a '/z-h period did not drift more than 20.005 OC, then measurement started. Temperatures were also monitored at the inter- face of the permafrost and insulation and at
SLUSARCHUK AND WATS( the outside surface of the insulation. All measurements were taken at approximately mid-height of the samples.
A measurement began when the heater coil in the probe was turned on (time zero). Temperatures were recorded at various times over a period of 30 to 60 min. The voltage and resistance of the heater were recorded at intervals so that the power input could be calculated. The time-temperature data were plotted on semi-logarithmic graph paper (time on the logarithm scale) and thermal conduc- tivity was determined from the slope of the straight line portion of the curve. In some cases temperatures were monitored after the mea- surement had been completed (i.e., after current to the heater had been cut off) to ob- tain a cooling curve. The samples had to cool for a period of approximately 24 h before the temperature returned to its original, constant value and another measurement could be made. At least two measurements were made on each sample.
Types of Test
Various types of test were performed and are described below.
1. Repeats. A probe was positioned in the sample and a second run made without dis- turbing the probe in any way to establish ac- curacy of measurement.
2. Rotations. Thermistors were positioned on one side of each probe beneath the heater coil. Rotation runs were conducted to deter- mine whether probe orientation (i.e., position of thermistor) affected the results. The probes were rotated 180" without vertical movement after each measurement had been completed, and another was made the next day without further disturbance of the probe.
3. Pull-Ups. These tests were conducted to determine whether measured thermal conduc- tivity changed when the sensing portion (ther- mistor) of the probe was positioned at a dif- ferent level within the sample. The probe was moved 1 in. (2.54 cm) between runs. 4. Pull-Outs. The probe was pulled out of each sample between tests and re-inserted to the same elevation, at the same time maintain- ing the original probe orientation. The tests were run to determine the reproduceability of the measurements. This information was re-
3 N : THERMAL CONDUCTIVITY 417
quired for the analysis of the series of tests on the interchangeability of probes.
5. Interchangeability of Probes. These tests were performed to determine whether the mea- sured thermal conductivity of a sample was the same for each .probe. A number of samples were tested with three probes.
6. Method of Transportation. As previously mentioned, the samples were maintained at temperatures below freezing during transpor- tation from Inuvik to Ottawa by placing dry ice around them (uncontrolled temperature) or by placing them inside freezers (controlled temperature). Tests were run to determine whether thermal conditions during transporta- tion affected thermal conductivity.
Tests on Thawed Permafrost Samples Measurements were made on eighteen sam- ples in the thawed state. Ten of the samples were thawed in containers at room tempera- ture under a load of 21 1 to 295 p.s.f. ( 1 135 to 1440 kg/m". Some of the thawed material was dried and eight samples were prepared from it. Measurements were made on four of the samples in a completely dry state, and on four in a nearly saturated condition.
Preparation of Samples Thawed Under Load Because the permafrost samples had dif- ferent diameters, four thaw containers were fabricated with diameters of 11, 12, 121/2, and 13 in. (28, 30.5, 3 1.8, and 33 cm)
.
They were 18 and 24 in. (45.7 and 61 cm) in height and were made from %-in. (0.31-cm) aluminum sheeting with a %-in. (0.63-cm) thick alumi- num base. Upon thawing, settlement of some of the samples was so great that an insufficient amount of material remained for measurement and it was necessary to thaw two such samples together to obtain one that was 12 to 15 in.(30.5 to 38.2 cm) in height.
The samples were thawed at a temperature of approximately 70 "F (-21 "C). An alumi- num platten % in. (0.63 cm) thick, with a diameter of slightly less than 11, 12, 1 2 % , or 13 in. (28, 30.5, 3 1.8, and 33 cm)
,
was placed on top of the sample. A weight of 192 lb (87 kg) was placed on the platten, giving a load from 21 1 to 295 p.s.f. ( 1 135 to 1446 kg/m2) depending on the diameter. Elevations were taken prior to and during thawing to deter-418 CAN. GEOTECH. J. VOL. 12, 1975
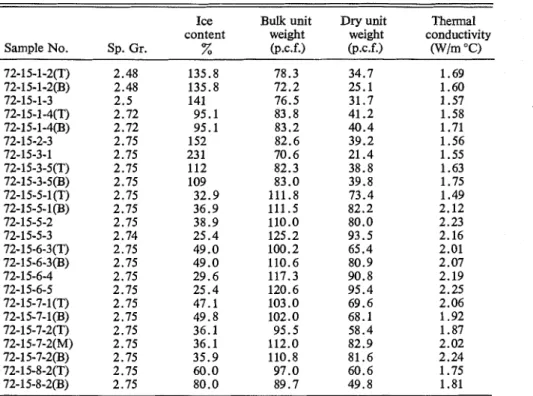
TABLE 1. Data for undisturbed permafrost samples
Ice Bulk unit Dry unit Thermal
content weight weight conductivity
Sample No. Sp. Gr. % (p.c.f.) (p.c.f.) W/m "0 72-15-1-2(T) 72-15-1-2(B) 72-15-1-3 72-15-1-4(T) 72-15-1-4(B) 72-1 5-2-3 72-15-3-1 72-15-3-5(T) 72-15-3-5(B) 72-15-5-1 (T) 72-15-5-1(B) 72-15-5-2 72-15-5-3 72-15-6-3(T) 72-1 5-6-3(B) 72-1 5-6-4 72-1 5-6-5 72-15-7-1(T) 72-1 5-7-1 (B) 72-1 5-7-2(T) 72-15-7-2(M) 72-1 5-7-2(B) 72-15-8-2(T) 72-15-8-2(B)
mine settlement. These readings were taken until the elevation change in a 4-h period was negligible (less than 1/32 in. (0.08 cm) ), when the load and aluminum platten were removed.
Test Procedure
A probe was pushed carefully into the thawed sample. The sample was wrapped with 4 in. (10.2 cm) of glass fibre insulation to damp out temperature oscillations of the room. Measurements were made after temperature equilibrium had been established. At least two runs were made on each sample.
Preparation of Reconstituted, Thawed Permafrost Samples
After the permafrost samples (thawed under load) had been tested, the soil was dried in an oven and pulverized in a muller. The result- ing dry pulverized material was placed in lay- ers in a sample holder 12 in. (30.5 cm) in diameter and 13% in. (34.8 cm) in height for testing. The probe was positioned in the center of the container, the soil placed in 4-in. (10.2- cm) layers around it, and compacted using a 3-in. (7.6-cm) diameter wooden dowel. When the container was filled an acrylic plastic lid
was placed on top to prevent moisture move- ment into the sample from the atmosphere.
Sample preparation for the reconstituted, saturated soil consisted of mixing water with the dry pulverized soil in the muller until a predetermined water content had been at- tained. This soil was then placed in a con- tainer identical to the one used for the dry reconstituted samples. The soil was placed in 4-in. (10.2-cm) lifts and compacted with a 3-in. (7.6-cm) diameter wooden dowel. A lid was placed on the container so that the water in the sample would not evaporate.
The reconstituted samples were wrapped with insulation and tested after temperature equilibrium had been established. At least two runs were made on each sample.
Classification Tests
Several properties in addition to thermal conductivity were determined. These proper- ties are given in Tables 1, 2, and 3 for both the frozen and thawed samples. Typically, the soil consisted of approximately 9% sand, 55% silt, and 36% clay-size particles and was clas- sified as ML-CL according to the Unified Clas-
SLUSARCHUK AND WATSON: THERMAL CONDUCTIVITY
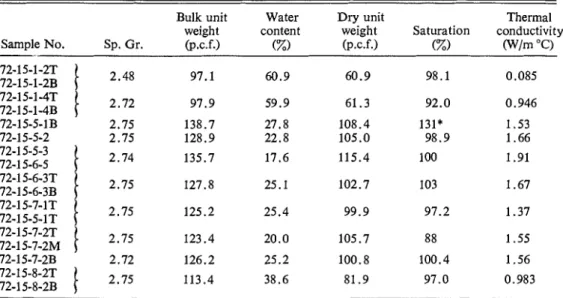
TABLE 2. Data for soil thawed under load
Bulk unit Water Dry unit Thermal weight content weight Saturation conductivity Sample No. Sp. Gr. (p.c.f.) (%I (p.c.f.) (%) (W/m "C)
*A rock was found in this sample.
TABLE 3. Data for reconstituted soil samples
Bulk unit Water Dry unit Thermal weight content weight Saturation conductivity Sample No. Sp. Gr. (p.c.f.) (%) (p.c.f.) (%) (W/m "C)
sification System. The results of X-ray diffrac- tion tests on five samples indicated the presence of montmorillonite and vermiculite in the clay- size fraction.
samples, and between 0.25 and 0.4 "C for the thawed samples. As shown by the data points presented in Figs. 3 and 4, a very linear t i m e temperature rise relation was obtained during the tests.
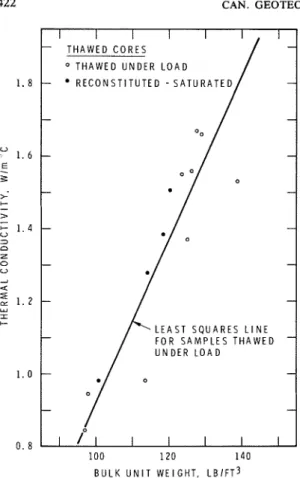
At least two measurements for each condi- tion were performed on each sample, and in many cases several repeat runs were made. The average values of these repeat tests are given in Tables 1, 2, and 3 and are illustrated in Figs. 5 to 8. Least squares equations were determined for the various conductivity-unit weight relations; examples are shown on the graphs. The least squares equations determined for the thermal conductivity, k, (W/m "C) are:
Results and Discussion
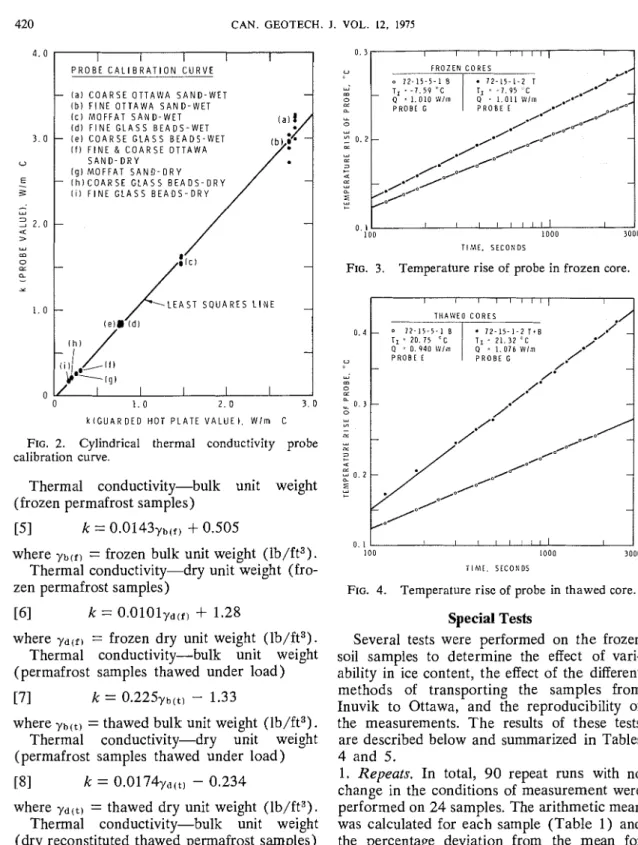
The calibration curve determined for the probes is shown in Fig. 2 (Slusarchuk and Foulger 1973). Thermal conductivity values determined for the permafrost samples in the frozen and thawed states were adjusted using this calibration curve.
Typical time-temperature rise curves for frozen and thawed samples are given in Figs. 3 and 4. The maximum temperature rise is shown to be less than 0.3 "C for the frozen
420 CAN. GEOTECH. J. VOL. 12. 1975
I
P R O B E C A L I B R A T I O N C U R V EI
t
l a ) C O A R S E O T T A W A S A N D - W E T ( b ) F I N E O T T A W A S A N D - W E Ti
I c ) M O F F A T S A N D - W E T I d ) F l N E G L A S S B E A D S - W E T ( e ) C O A R S E G L A S S B E A D S - W E T ( f ) F l N E & C O A R S E O T T A W A S A N D - D R Y lg) M O F F A T S A N D - D R Y I h I C O A R S E G L A S S B E A D S - D R Y ( i l F l N E G L A S S B E A D S - D R Y ~ L E A S S Q U A R E S L I N E T l e ) O ( d l1
k l G U A R D E D H O T P L A T E V A L U E ) . W l m CFIG. 2. Cylindrical thermal conductivity probe calibration curve.
Thermal conductivity-bulk unit weight (frozen permafrost samples)
where y b ( f ) = frozen bulk unit weight (Ib/ft3). Thermal conductivity-dry unit weight (fro- zen permafrost samples)
161 k = 0.010lYd(f,
+
1.28where y d ( f , = frozen dry unit weight (lb/ft3). Thermal conductivity-bulk unit weight (permafrost samples thawed under load) [ 7 ~ k = 0.225yb(t) - 1.33
where y b ( t ) = thawed bulk unit weight (lb/ft3). Thermal conductivity-dry unit weight (permafrost samples thawed under load) CgI k = 0.0174y,l(t, - 0.234
where y d ( t ) = thawed dry unit weight (lb/ft3). Thermal conductivity-bulk unit weight (dry reconstituted thawed permafrost samples)
where Y ~ ( I I D ) = bulk unit weight of the dry
reconstituted material (Ib/ft3).
FROZEN CORES PROBE C - 0 . 1 I 1 I 1 1 I 1 1 1 I I 100 1000 3000 T I M E . SECONDS
FIG. 3. Temperature rise of probe in frozen core.
I
THAlVEO CORES.A
0. 1 I / I I I I 1 1 1 I
100 1000 3000
l l h \ E . SECONDS
FIG. 4. Temperature rise of probe in thawed core.
Special Tests
Several tests were performed on the frozen soil samples to determine the effect of vari- ability in ice content, the effect of the different methods of transporting the samples from Inuvik to Ottawa, and the reproducibility of the measurements. The results of these tests are described below and summarized in Tables 4 and 5.
1. Repeats. In total, 9 0 repeat runs with no \
change in the conditions of measurement were performed on 24 samples. The arithmetic mean was calculated for each sample (Table 1) and the percentage deviation from the mean for each test run. For example, for sample 72-15- 1-2T, four repeat runs were made with probe
E giving a mean conductivity value of 1.69 W/m "C and deviations from this mean of
SLUSARCHUK AND WATSON: THERMAL CONDUCTIVITY 42 1 -5.3, 0.0, f 2 . 4 , +2.9%. The average devia-
tion from the mean for the 90 runs was found to be 2.2%, with maximum deviations from the mean of
+
10.9 to -9.9% (Table 4 ) . The results of these measurements are presented in Tables 5 and 6.2. Rotations. In total, 18 rotation tests were performed on eight permafrost samples; the average of the means of the rotation tests was 1.3% lower than the average of the means of the repeat tests on the same samples. The average deviation of the rotation tests from the mean of the repeat measurements was 2.0%. The maximum deviations were +2 and -5.7%. These results show that the rotation of the probe did not significantly affect the measurements.
3. Pull-Out Tests. Sixteen pull-out tests were performed on five samples. The average devia- tion of the measurements from the mean for the repeat measurements on the same samples was 2.8%, and the maximum deviations +2.4 and -4.5%. The difference between the mean of the pull-out runs and the mean of the repeat tests on the same sample was -1.8%. These results show that some additional scatter is
2. 4 I I I I I I I F R O Z E N C O R E S B U L K U N l T W E I G H T . L B I F T ~ I I I I I I I 20 40 6 0 8 0 100 D R Y U N l T W E I G H T . L B I F T ~
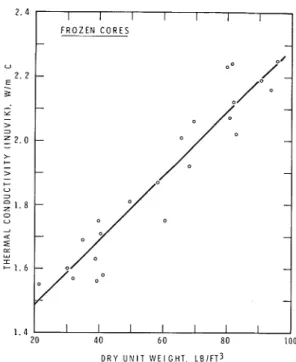
FIG. 6. Frozen cores-thermal conductivity ver- sus dry unit weight.
I I I I I I I T H A W E D C O R E S o T H A W E D U N D E R L O A D R E C O N S T I T U T E D - S A T U R A T E D A R E C O N S T I T U T E D - D R Y - L E A S T S Q U A R E S L I N E F O R S A M P L E S T H A W E D U N D E R L O A D - - -
/
A / A A / I I I I I I I 8 0 100 D R Y U N l T W E I G H T . L B I F T ~FIG. 5. Frozen cores-thermal conductivity ver- FIG. 7. Thawed cores-thermal conductivity ver- sus bulk unit weight. sus dry unit weight.
422 CAN. GEOTECH. J. VOL. 12, 1975 0. 8 1 0 0 1 2 0 140 B U L K U N I T W E I G H T . L B I F T ~ I I - T H A W E D C O R E S - O T H A W E D U N D E R L O A D - R E C O N S T I T U T E D - S A T U R A T E D - - - - - - -
-
- --
- - L E A S T S Q U A R E S L I N E - F O R S A M P L E S T H A W E D-
U N D E R L O A D - --
-
I I I I IFIG. 8. Thawed cores-thermal conductivity ver-
sus bulk unit weight.
introduced by pulling out and reinserting the probe, but that the effect is small.
4. Pull-Up Tests. Pull-up tests were performed on nine samples, with the probe pulled up 1 in. (2.54 cm) from the original probe position. Either two or three measurements were made in each position. Twenty runs were made giv- ing an average deviation from the mean of the repeat tests on the same samples of 3.3%, and maximum deviations of f 5 . 3 and -6.4%. The difference between the mean of the conduc- tivity values for the nine samples and the mean of the repeat tests on the same samples was +0.08%. These results show that a small change in the vertical position of the probe within the sample affected the scatter of the results, but only to a relatively small degree. 5. Method of Transportation (Inuvik to Ot- tawa). Five samples shipped in dry ice and
ten samples shipped under controlled condi- tions were retested with the same probe as was used at Inuvik. The results of these mea- surements are summarized in Table 4. The
average deviation from the mean of the repeat tests was 3.8% for samples shipped in dry ice, and 3.7% for samples shipped under con- trolled temperature conditions. The difference between the mean for the dry ice and the mean of the repeat tests was -1.4%; the cor- responding difference for the samples shipped at 24 O F (-4.5 "C) was -1.3%. These re-
sults show that the method of transportation has no significant effect on thermal conduc- tivity.
6. Interchangeability of Probes. In total, 97 tests were run on 15 samples to determine the effect of interchanging the probes. Five probes made to identical specifications were used in the tests. The results are summarized in Table 5. For a particular sample the average devia- tion of the results for a given probe from the mean for all probes varied from 1.44 to 2.00%. The difference between the average value for each probe and the mean of all inter- changeability tests on the samples varied from -0.73 to +0.41%. These results indicate that the thermal conductivity value obtained did not depend upon the probe used for the test.
Comparison with Kersten's (1949) Data The results of conductivity measurements on frozen and thawed permafrost samples were compared with those given by Kersten ( 1949). The data for the high ice content soils could not be compared, however, because they were outside the range of ice contents with which Kersten worked. Table 6 shows that close agreement was obtained in the range of water contents and dry unit weights common to both studies.
The thermal conductivity of pure ice is about 2.2 W/m OC. As shown in Table 6, the conductivity for ice-rich permafrost does not tend to the value for pure ice as the ice con- tent increases. It is incorrect, therefore, to use the conductivity value of ice for ice-rich perma- frost. The explanation offered for the observed lower values is that many small air bubbles and discontinuities are present in naturally occur- ring ice-rich permafrost. These tend to lower the effective conductivity of the permafrost.
Conclusions
1. Functional relations have been determined for permafrost samples between thermal con- ductivity and:
SLUSARCHUK AND WATSON: THERMAL CONDUCTIVITY 423
TABLE 4. Summary of deviations of conductivity values for special tests on permafrost samples Net difference Average deviation Maximum deviations between mean of No. of Total of each run from of one run from special test and samples No. of mean of repeats mean of repeats mean of repeats Type of test measured measurements (%) (%) (%)
Repeats 24 90 2 . 2
Rotations 8 18 2 . 0
Pull-ups 9 20 3 . 3
Method of trans- portation
(a) Dry ice 5 10 3 . 8 (b) Controlled
temperature 10 21 3 . 7
TABLE 5. Summary of deviations of conductivity values for probe interchangeability tests on permafrost samples
-
-Average deviation of Net difference between each run from mean average value for one probe No. of of all interchangeability and mean of all interchange- samples No. of tests on the same samples ability tests on the same samples Probe measured measurements (%) (%)
TABLE 6. Comparison of conductivities from this study and those by Kersten (1949) Dry unit Water content Study Water content
weight (this study) results Kersten (Kersten) Material (p.c.f.) (%) (w/m "'2) (Wlm "c) (%I
Frozen fine-
30 130 1.58 Outside -
grained soil range
9, ,, 60 45 1.90
-
$ 9 9 , 90 27 2.20 2.05 29 Thawed fine- 60 60 Extrapolatedgrained soil to approx. 0.8 60
7 , 7,
1 , 9 ,
90 22 1 . 3 1.33 32
120 16 1 . 8 1.85 15
( a ) frozen bulk unit weight (Eq. [5]); ( b ) frozen dry unit weight (Eq. [6]) ;
( c ) thawed bulk unit weight (Eq. [7]) for nearly saturated soil;
( d ) thawed dry unit weight (Eq. [8]) for nearly saturated soil;
(e) bulk unit weight (Eq. [9]) for reconsti- tuted dry soil.
These equations should not be used for pre- dicting thermal conductivity outside the range of unit weights and water contents presented in this paper.
2. Conductivity values for ice-rich, fine- grained permafrost do not tend towards the value for pure ice.
424 C A N . GEOTECH. J. VOL. 12, 1975 content and unit weight (i.e., at low water con-
tents for these studies and high water contents for Kersten's studies) there is good agreement between the conductivity values obtained in the present studies and those of Kersten
(1949).
4. It was possible to control the construction of the probes sufficiently to ensure that they all had the same calibration factor and per- formance characteristics.
5. No significant difference was observed be- tween the thermal conductivities of samples shipped in dry ice and samples shipped under controlled temperature conditions. The temper- ature of shipping and storage was always below
25 O F (-4.4 OC), however, and this conclu-
sion cannot automatically be applied to warm- er permafrost samples.
Acknowledgments
The authors are grateful for the interest and assistance of their colleagues throughout this project, in particular Mr. R. K. Rowley, Mac- kenzie Valley Pipe Line Research Limited, and Dr. L. W. Gold and Mr. E. Penner, Divi- sion of Building Research.
The assistance of Mr. P. H. Foulger, Divi-
sion of Building Research, and Mr. F. Greebe, Mackenzie Valley Pipe Line Research Limited, in conducting the tests is gratefully acknowl- edged.
This paper is a joint contribution of Mac- kenzie Valley Pipe Line Research Limited and the Division of Building Research, National Research Council of Canada, and is published with the approval of the Research Coordinator of Mackenzie Valley Pipe Line Research Limited and the Director of the Division of Building Research.
BLACKWELL, J . H. 1954. A transient-flow method for de-
termination of thermal constants of insulating materi- + als in bulk. J. Appl. Phys.,25, No. 2.
BLACKWELL, J. H. 1956. The axial-flow error in the ther- mal conductivity probe. Can. J. Phys., 34, No. 4, pp. 412417.
JAEGER, J. C. 1956. Conductionof heat in an infinite region bounded internally by circular cylinder of a perfect conductor. Aust. J. Phys., 9, No. 2.
KERSTEN, M. S. 1949. Thermal properties of soils. Univ. Minnesota, Eng. Exp. Stn., Bull. No. 28.
SLUSARCHUK, W. A., and FOULGER, P. H. 1973. Develop- ment and calibration of a thermal conductivity probe apparatus for use in the field and laboratory. Nat. Res. Counc. Can., Div. Bldg. Res., NRC 13267.
WECHSLER, A. E. 1966. Development of thermal conduc- tivity probes for soils and insulations. Cold Reg. Res. Eng. Lab., Hanover, N.H., Tech. Report 182.