HAL Id: hal-01756694
https://hal.archives-ouvertes.fr/hal-01756694
Submitted on 2 Apr 2018
HAL is a multi-disciplinary open access
archive for the deposit and dissemination of
sci-entific research documents, whether they are
pub-lished or not. The documents may come from
teaching and research institutions in France or
abroad, or from public or private research centers.
L’archive ouverte pluridisciplinaire HAL, est
destinée au dépôt et à la diffusion de documents
scientifiques de niveau recherche, publiés ou non,
émanant des établissements d’enseignement et de
recherche français ou étrangers, des laboratoires
publics ou privés.
Formulation and characterization of blended
alkali-activated materials based on flash-calcined
metakaolin, fly ash and GGBS
Gabriel Samson, Martin Cyr, Xiao Xiao Gao
To cite this version:
Gabriel Samson, Martin Cyr, Xiao Xiao Gao. Formulation and characterization of blended
alkali-activated materials based on flash-calcined metakaolin, fly ash and GGBS. Construction and Building
Materials, Elsevier, 2017, 144, pp.50 - 64. �10.1016/j.conbuildmat.2017.03.160�. �hal-01756694�
Formulation and characterization of blended alkali-activated
materials based on flash-calcined metakaolin, fly ash and GGBS
Gabriel Samson
1, Martin Cyr
1, Xiao Xiao Gao
21 LMDC, INSAT/UPS Génie Civil, 135 Avenue de Rangueil, 31077 Toulouse cedex 04 France. 2 ECOCEM, 3rd Floor Port view House, Grand Canal Docks, Dublin 4, Ireland
To cite this article: G. Samson, M. Cyr, X.X. Gao, Formulation and characterization of blended
alkali-activated materials based on flash-calcined metakaolin, fly ash and GGBS, Constr. Build.
Mater. 144 (2017) 50–64. doi:10.1016/j.conbuildmat.2017.03.160.
Highlights
AAMs initial setting time, shrinkage, mass loss, compressive strength were studied.
Low activation leads to high drying shrinkage because of important mass loss.
Very low shrinkage values were found for MK-GGBS compared to the other AAMs.
High early strength compressive strength was observed for MK-GGBS blends.
Abstract
Studies performed on alkali-activated materials (AAMs) in recent years reveal that they could be an alternative to ordinary Portland cement (OPC). The main precursors used are flash-calcined metakaolin (MK), fly ash (FA), and ground granulated blast furnace slag (GGBS). Usually, only one precursor is used to produce an AAM. The aims of this study were to measure and compare the performances of pure (one precursor) and blended AAMs (two precursors). Alkaline solution is added to activate the precursors and the influence of the activation rate was also investigated by changing the activator amount (15% and 25% of alkaline solution dry extract). Twenty-six different mixes were studied and are presented in a ternary representation. The mixtures were characterized in the fresh state (initial setting time) and the main properties useful for building applications (shrinkage, mass loss, and compressive strength) were recorded and analysed. In contrast to the situation in OPC systems, shrinkage and mass loss in AAMs were not directly correlated. The high shrinkage values observed for pure MK AAMs and pure GGBS AAMs were significantly reduced when they were associated in appropriate proportions. The association of MK and GGBS also proved very interesting regarding early age compressive strength.
Keywords: Alkali-activated material (AAM), metakaolin (MK), fly ash (FA), ground granulated blast
1 Introduction
The building sector is faced with the gradual exhaustion of natural resources and/or increasing difficulty in accessing them. The worldwide demand for ordinary Portland cement (OPC) has grown to around 4.2 Gt/year (in 2014 [1]). The development of AAMs has aroused the interest of the scientific community in recent decades because these materials appear to provide an effective alternative to OPC cement [2] and because most of them are produced with industrial by-products. AAMs are not intrinsically or fundamentally ‘low-CO2’. However, if mix design and raw materials selection are carried out with a view
towards optimisation of environmental performance, the outcomes can result in very significant savings [3]. They can exhibit comparable or better mechanical properties [4] and thermal stability [5,6] than OPC cements and they can also be employed for thermal insulation [7], wall panelling and fire resistant coating [8,9]. One of the major newer applications is in the storage of waste, such as toxic or nuclear waste [10– 12]. All these reasons explain why they are considered as the third generation of binders (after lime and OPC).
AAMs are produced from aluminosilicate(s) mixed with an alkaline solution [13]. AAMs can be divided into two main categories depending on the calcium (Ca) content of the precursors [14], although other classifications are possible (Shi et al. [15] purposed five categories depending on the precursors used). Low Ca content AAMs are often called geopolymers. They are based on low Ca content precursors such as metakaolin (MK) or fly ash (FA) and the major reaction product is a N-A-S-H type gel (Na2O-Al2O3
-SiO2-H2O) within a three dimensional network [16]. When the precursor employed has a high Ca content,
the mechanisms of the activation and the reaction products are different and include a C-A-S-H type gel (CaO-Al2O3-SiO2-H2O). GGBS is the most common precursor for high Ca AAMs. Several parameters
influence AAM reactivity: mineral composition, morphology, and fineness. To achieve high performance, the precursor(s) must contain a sufficient amount of reactive glass, have a low water demand and be able to release aluminium easily [17]. Studies have been conducted on pure MK (paste [18–20], mortar [21] or concrete [22]). One of the main drawbacks of MK-geopolymer is a tendency to shrink and crack on drying [23,24]. Pure GGBS (paste [25], mortar [26,27]) have also been investigated. GGBS AAMs usually achieved good compressive strength [26,28], but these AAMs suffer from high shrinkage [29]. Melo Neto et al. [25] showed that pure GGBS AAMs show significantly higher shrinkage than OPC mortar. Moreover, these materials exhibit very short setting time [27].
Studies on pure FA AAMs (paste [30], mortar [31–33] or concrete [34]) indicated that FA geopolymer presents low reactivity compared with MK geopolymer and a thermal treatment is usually necessary to achieve reasonable properties (setting time and early age mechanical properties) [33]. Under ambient conditions, pure FA AAMs initial setting time is very long (more than 24 h) because of the low reactivity of the FA but good mechanical properties can be achieved if the FA AAMs are thermally cured [30,32,34]. However, curing FA geopolymer at elevated temperature (usually between 40 and 90°C) greatly increases the energy needed to produce the material [35].
Slightly fewer studies have concerned blended AAMs. Blended AAMs are defined as AAMs that contain at least two solid precursors. Properties of MK-FA AAMs mortar [36,37] were studied. Rajamma et al. [36] observed that adding MK to FA mortars increased the compressive strength. Logesh Kumar et al. [37] found different optimized MK/FA ratio depending on the liquid/solid ratio. GGBS-FA AAMs (paste [38–43], mortar [16,43,44] or concrete [45]) were also investigated. Kumar et al. [38] revealed that at 27°C, the reaction of alkali-activated GGBS-FA blend paste is dominated by the GGBS activation (dissolution and precipitation of C-A-S-H) while at 60°C the reaction is due to combined interaction of FA and GGBS, which indicates that FA has lower reactivity than GGBS under ambient conditions. There is only small interaction of fly ash and GGBS probably due to different kinetics of dissolution process and distribution of species. Puligulla et al. [39] studied GGBS-FA blend pastes. They found that the calcium that dissolves from slag significantly influences both early and late age properties. The availability of free Ca ions seems to prolong FA dissolution and enhance geopolymer gel formation. It is proposed that the hardening process is initiated by the precipitation of C-A-S-H and that rapid hardening continues due to accelerated geopolymerization. Liu et al. [40] achieved similar conclusions. Adding FA to GGBS decreases mechanical properties because FA used is less reactive than GGBS and has a low efficiency factor of 0.13. Yao et al. [41] studied the influence of FA addition in GGBS. As the previous quoted references, FA has a negative impact on compressive but it reduces shrinkage. MK-GGBS AAMs (paste [23,46–48], mortar [49]) have been investigated too. Bernal et al. [23] showed the beneficial effects of GGBS addition on MK AAMs compressive strength. In these systems, both type of reaction products C-A-S-H from GGBS and N-A-S-H from the metakaolin are able to coexist and have only small interactions [47]. Borges et al. [49] partly explained the compressive stress gain by a lower porosity.
The studies mentioned above reveal that, under particular conditions, mixing two different precursors can give very interesting results. However, these studies have usually focused on the identification of a particular property under particular experimental conditions (curing, water/binder mass ratio, etc.). The aims of the present study were to measure and compare the performances of pure and blended AAMs. The blended AAMs were produced by associating two of the three most common solid precursors: MK, FA and GGBS in several proportions. As far as we know, there is no study combining these three aluminosilicate sources (in pairs) under exactly the same conditions (water/binder ratio, mixing procedure, curing, testing). Twenty-six mixes were made, associating two precursors with two activation rates (alkali-activation performed with sodium silicate solution). The mixtures were characterized in the fresh state (initial setting time) and the main properties useful for building applications (shrinkage, mass loss, compressive strength) were recorded and analysed. This experimental approach enabled precursor interactions to be analysed and interesting mix proportions to be identified. The significant differences observed with the addition of high Ca content GGBS were also analysed. All the samples were produced at ambient temperature. The fact that some AAMs need to be thermally treated to achieve a reasonable initial setting time, sufficient early strength or good mechanical properties is major problem. These thermally treated materials cannot be used on site such as concrete unless precast elements are routed. The alternative binders proposed here had to be produced under ambient conditions so as to be economically and environmentally competitive.
2 Materials
2.1 Binders
Many materials can be alkali-activated. Most of them are produced from industrial by-products: FA, GGBS, rice husk ash, red mud, recycled glass [50], etc. This study focusses on the three main solid precursors: MK, FA and GGBS.
The MK used in this study is produced in the south of France (Argeco Developpement®) by flash calcination at around 700°C. The kaolinite is transformed into MK by passing close to a flame for a few tenths of a second. This process is rapid and consumes less energy than classical MK production methods (such as a rotary oven [51]). XRD, ICP and Rietveld analysis performed by Pouhet [24] showed that this MK contained large amounts of impurities (quartz, anatase, mullite, kaolinite). The different compositions are presented in Table 1. The analyses of Pouhet [24] revealed that the amorphous phase contained 29% and 24% of SiO2 and Al2O3 respectively.
The FA used in this study came from France (Silicoline®) and its chemical composition (in oxides) is detailed in Table 1. It was a coal power plant by-product certified to comply with the EN 450 standard. Its activity index at 28 days was between 75% and 83% (EN 196-1). XRD analysis showed that FA contained crystallized phases (quartz, mullite, hematite) and an amorphous phase. Rietveld analysis allowed us to quantify the crystallized phase contents and thus deduce the proportions of SiO2 and Al2O3
in the amorphous phase: 37.4 and 13.9%, respectively (Table 1).
The GGBS used in this study was produced in France at Fos sur Mer (Ecocem®) and complied with standard EN 151-67-1. A diffusion hump seen on the XRD diagram confirmed that the GGBS was almost totally amorphous. It had a high specific surface (Blaine) of 4450 cm2/g. The activity index at 28 days was 98% (EN 196-1).
Table 1. Raw material chemical composition.
Amorphous phase
SiO₂ Al₂O₃ CaO MgO Fe₂O₃ K₂O Na₂O TiO₂ SO₃ H₂O Fire
loss SiO₂ Al₂O₃ SiO₂ / Al₂O₃ SiO₂ / Na₂O Metakaolin % 68.1 24.1 0.2 0.2 3.7 0.4 0.1 1.1 0.0 - 1.8 29.0 24.0 2.1 878.0
GGBS % 37.2 11.3 43.9 6.1 - - - - 0.1 - - 37.2 11.3 5.6 - Fly ash % 49.7 26.3 1.7 1.6 6.0 4.2 0.6 0.8 - - 2.5 37.4 13.9 4.5 85.4 Bétol 47T % 27.5 - - - 16.9 - - 55.6 - - - - 1.68
The physical properties of the three precursors are summarized in Table 2. The densities of the three binders and GGBS and FA Blaine specific surface were provided by the producers. Due to its plate-like particle shape, MK Blaine specific surface cannot be measured. San Nicolas et al. [52] performed a BET analysis on the MK used in this study and found a high BET surface value (14000 cm²/g). The particle size distributions were measured with a LASER granulometer, Cilas 1090 LD (Figure 1). Special precautions were taken during the post treatment of results. The optical refractive indices presented in Table 2 were used to calculate the particle size distributions with the Mie mathematical model as some errors can occur on the evolution of the fines (less than some microns) if the Fraunhofer approximation is used [53]. Figure 1 and Table 2 reveal that GGBS is much finer than MK and FA.
Table 2. Raw material physical characteristics, * = obtained with BET analysis [52].
Refractive index [54] Particle size distribution
Density Blaine specific
surface Real part
Imaginary part d₁₀ d₅₀ d₉₀ dmoy kg/m³ cm²/g µm µm µm µm Measurement precision 100 200 - - 0.2 0.2 0.2 0.2 Metakaolin 2500 14000* 1.65 0.1 5.1 28.0 81.9 36.8 GGBS 2900 4450 1.65 0.1 2.5 12.5 33.1 15.0 Fly ash 2200 2730 1.73 0.1 6.7 37.7 97.0 37.7
Figure 1. Raw material particle size distributions.
0 10 20 30 40 50 60 70 80 90 100 0.1 1 10 100 Fly ash GGBS Metakaolin Diameter [µm] Cumulative volume [%]
2.2 Activator
The alkali activation was performed with a commercial sodium silicate solution (Bétol 47T - Woellner®), the composition of which is given in Table 1. The SiO2/Na2O molar ratio was 1.68. Caustic soda was
added to improve the activation (3.2% of the mass of the commercial alkaline solution). The term “activator” is used to defined the solid remaining material obtained if all the water was evaporated (the solid part) from the alkaline solution (commercial alkaline solution + NaOH). Activator content of the alkaline solution is 44.4%.
3 Methods
3.1 Mix-design
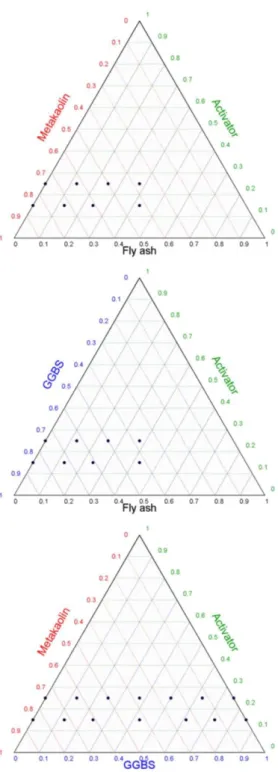
All the mixes made in this study are presented in ternary diagrams (Figure 2). The design of experiments was built by changing the proportion of three raw materials: the activator (the dry extract of the alkaline solution) and the two precursors (chosen from MK, FA and GGBS). The literature shows that single precursor AAMs can suffer from different problems. The aim is to find an appropriate formulation to produce AAMs with better properties. Moreover, different raw material consumes different quantity of alkaline solution which has a great influence on the final price of product. Reducing its content is necessary to reduce AAMs cost. The 26 mixes were made with the same water to binder mass ratio, W/B = 0.36. The binder comprised the two powders (MK, FA, GGBS) and the activator. The water came from the alkaline solution and enough water was added to obtain the constant W/B ratio for each mix. Hereafter, the samples will be designated as: AiBjCk where A is the activator and i the associated
percentage; B is the first solid precursor and j its percentage; C is the second solid precursor and k its percentage. Each sample verified i + j + k = 100. An example of ternary reading is presented on Figure 3. The minimum value of the W/B ratio was evaluated with preliminary tests on samples that contained only MK (A₂₅MK₇₅ and A₁₅MK₈₅ - Figure 2). MK led to higher water demand than GGBS and FA [55] because of the plate-like morphology of MK particles. The minimum W/B was defined from the minimum fluidity required to fill all the moulds (Table 3) without vibration for the pure MK AAMs. With lower W/B, it became very difficult to fill all the moulds without vibration for the pure MK pastes.
Figure 2. Mix design: Ternary diagrams.
Each ternary mixture was made with two activator percentages, 15% and 25%, to observe the influence of the quantity of alkaline activator on the AAM properties. These percentages will be referred to as low (15%) and high activation rates (25%) hereafter. The first two ternary mixtures had limited FA content because of the low reactivity of FA at ambient temperature (Figure 2). As the samples were unmoulded after 24 h, higher FA content samples were impossible to unmould for MK-FA mixtures without breaking them. Preliminary tests on GGBS-FA mixtures revealed that it was possible to increase FA content but very low mechanical performances were achieved and explained why FA contents studied of GGBS-FA
blends were voluntarily maintained as low as for MK-FA blends. The last ternary mixture (MK-GGBS) was made in 14 different mix proportions. MK and GGBS could be associated in any proportion without causing unmoulding problems after 24. All the compositions and associated results are summarized in Table 4.
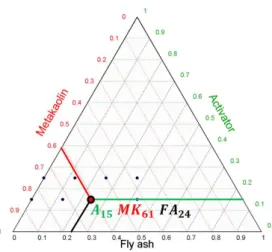
Figure 3. Ternary reading: an example.
3.2 Sample production and characterization
To produce the different samples (Table 3) of the three ternary mixes, the dry powders were first mixed to obtain a homogeneous powder. The soda was diluted in the additional water and this solution was mixed with the alkaline solution. The resulting liquid was added to the powder (the moment of this addition defined the initial time, t = 0) and mixed for 1 minute at low speed then 2 minutes at high speed using an ordinary mixer (Automix 65 - Controls®). The paste was then cast in the different moulds (Table 3). To prevent water evaporation, the moulds were covered with plastic sheets. They were then placed in a room at 20°C for 24h.
Table 3. Sample characterization.
Test Quantity measured Mould Time
[days]
Initial setting time mins Truncated conical moulds - height 40 mm - diameter 80 mm 0
Compressive strength MPa Cubic (x 8) - height 20 mm 1, 7, 28
Mass loss %
Prismatic (x 3) - 20 x 20 x 160 mm 1, 2, 7, 14,
21, 28
Shrinkage %
The paste setting time was characterized in the fresh state using an automatic Vicat device (Vicatronic®). The Vicat initial setting time was calculated as the time that elapsed between the initial contact (t = 0) of dry powder and alkaline solution and the time when the probe penetrated to 25 mm from the bottom of
the mould (ASTM C191- 01 standard [56]). Cubic and prismatic samples were unmoulded after 24 h. Cubic samples were stored in plastic bags to limit water loss for strength measurements. Compressive strength was measured after 1, 7 and 28 days on cubic samples. Eight samples were tested at each term (100 kN IGM® press, loading speed 0.5 kN/s) to obtain a representative average of the compressive strength. Prismatic samples were placed at 20°C and 50% HR without any protection for shrinkage measurements. The shrinkage tests were based on an adaptation of the ASTM C 596 - 01 standard [57]. Prismatic samples (3 per composition) were weighed and measured at 1, 2, 7, 14, 21 and 28 days. Samples were measured using a length comparator with a precision of ± 0.01 mm. The shrinkage was calculated as (l-l0)/l0, where l is the measured dimension of the sample and l0 is the sample dimension
immediately after unmoulding. The mass loss was calculated as (m-m0)/m0, where m is the weight of the
sample and m0 is the sample weight immediately after unmoulding. Thus, the first mass loss and
shrinkage results are obtained after 2 days which corresponds to one day after unmoulding (under shrinkage conditions).
Figure 4. Molar ratios (SiO2/Al2O3, SiO2/Na2O and Na2O/Al2O3).
Figure 4 presents three overall molar ratios (dry powder + alkaline solution) introduced for geopolymers (SiO2/Al2O3, SiO2/Na2O and Na2O/Al2O3). These ratios were calculated considering the amorphous
quantity (Table 1) of each oxide because the crystallized part did not react. Geopolymer properties are highly dependent on these molar ratios [20,22]. MK-FA AAMs presented SiO2/Al2O3 ratios ranging from
2.80 to 4.75 (Figure 4 - (a)). The highest value (in red on Figure 4) was obtained for the samples that simultaneously contained the highest proportions of FA and activator (A₂₅MK₃₇.₅FA₃₇.₅) because MK
contains less amorphous SiO2 than either FA or activator (Table 1). The SiO2/Na2O ratio of MK-FA
AAMs mostly depended on the activator content as it provided nearly all the sodium oxide Na2O, and the
amorphous SiO2 contents of MK and FA were quite similar (Table 1). For low activation (activator =
15%), the SiO2/Na2O ratios were maximums (SiO2/Na2O ≥ 5.81). The same logic explains why
The SiO2/Al2O3 ratio evolution was different with GGBS-FA because GGBS was nearly 100%
amorphous and thus had a high SiO2/Al2O3 ratio. The highest SiO2/Al2O3 value (Figure 4 (d)) was
obtained by the sample that simultaneously contained the highest proportions of GGBS and activator (A₂₅GGBS₈₅). As for MK-FA AAMs, the SiO2/Na2O and Na2O/Al2O3 ratios of GGBS-FA mostly
depended on activator content (Figure 4 (e) and (f)).
For MK-GGBS, the SiO2/Al2O3 ratio evolved significantly. It was 3.46 and 2.80 for A25MK75 and
A15MK85 respectively (Figure 4 (g)). Much higher values were observed for pure GGBS AAMs (8.60 for
A25MK75 and 7.19 for A15MK85). As seen above, the SiO2/Na2O ratio of MK-GGBS AAMs depended on
the activation rate but, as there was also a significant difference in SiO2 content between MK and GGBS,
significant SiO2/Na2O variations were observed when changing the MK/GGBS proportion.
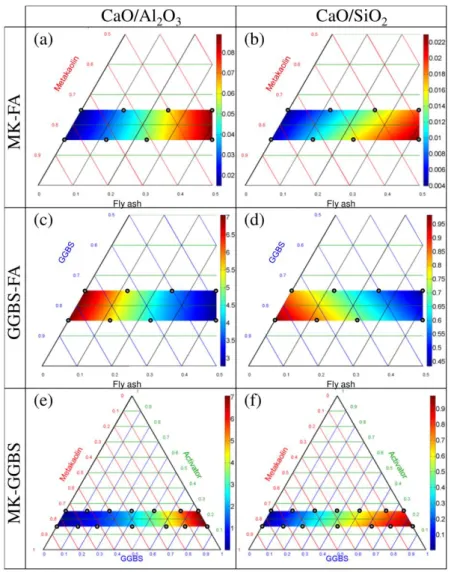
For high Ca content AAMs, the presence of Ca significantly changed the chemical reaction and the species produced [14]. For this reason, the properties of high Ca content AAMs might also depend on CaO/Al2O3 and CaO/SiO2 ratios. These ratios are presented in Figure 5:
FA contained a small amount of Ca (Table 1), explaining why the CaO/Al2O3 and CaO/SiO2 ratios of
MK-FA AAMs increased a little with FA content (Figure 5 (a) and (b)). However, the ratios remained small (CaO/Al2O3 ≤ 0.18 and CaO/SiO2 ≤ 0.05) and were maximum for the two MK-FA samples with the
highest FA content, A₂₅MK₃₇.₅FA₃₇.₅ and A₁₅MK₄₂.₅FA₄₂.₅.
These two ratios increased considerably for both GGBS-FA and MK-GGBS samples due to the high Ca content of GGBS. The CaO/Al2O3 ratio was greater than 7 for pure GGBS samples (Figure 5 (c) and (e)).
The CaO/SiO2 ratios also increased with GGBS content, to reach values near 1 (Figure 5 (d) and (f)).
Increasing the Ca content would lead to a different chemical process and different chemical products from those obtained with low Ca AAMs [58].
4 Results
4.1 Initial setting time
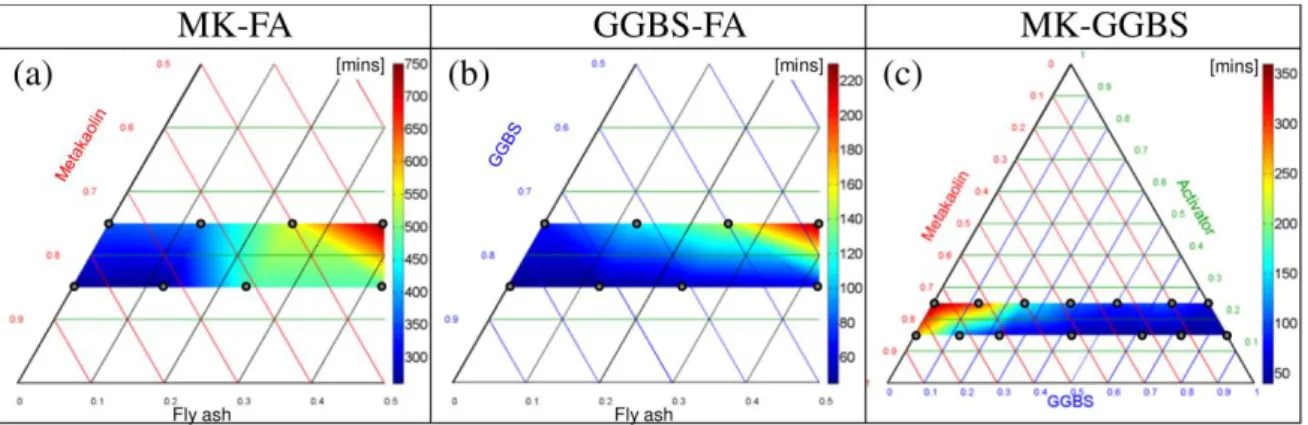
Figure 6. Initial setting time.
The initial setting time results are presented in Figure 6. Pure MK initial setting times (Figure 6 (a)) were 360 and 265 minutes for A₂₅MK₇₅ (SiO2/Al2O3 = 3.46) and A₁₅MK₈₅ (SiO2/Al2O3 = 2.80). As stated in
the literature [59], for pure MK, the initial setting time was shorter for lower SiO2/Al2O3 ratios. Adding
FA increased this ratio and, above all, FA showed extremely low reactivity under ambient conditions. These two reasons explained why the initial setting time increased with FA addition, reaching 750 minutes for A₂₅MK₃₇.₅FA₃₇.₅ (SiO2/Al2O3 = 4.75). It should not be forgotten that the higher water
demand of MK could lead to a decrease in workability in the mixtures with high MK contents. Thus it could have a slight effect on the initial setting time of the mixtures.
For GGBS-FA samples, the highest SiO2/Al2O3 ratio (A₂₅GGBS₃₇.₅FA₃₇.₅) was also associated with the
high Ca content of GGBS. Ca significantly decreased the initial setting time compared to those of MK-FA blends. In GGBS AAMs, both C-A-S-H and aluminosilicate phases (N-A-S-H) observed on geopolymer AAMs are present [60]. The hydration products of alkali-activated GGBS are controlled by the composition of the GGBS, the type of activator and the pH environment. The pH is controlled either by the activator quantity or the GGBS content (GGBS is basic). The main hydration product is C-A-S-H whatever the activator employed [14]. However AFm, hydrotalcite (Mg6Al2CO3(OH)16.4H2O) and calcite
can also be found if the GGBS is activated with NaOH [61]. The hardening process is initiated by the fast precipitation of C-A-S-H gels. The lowest initial setting times were obtained for the pure GGBS, which corresponded to the highest Ca content (Figure 5 (c) and (d)). This is in agreement with the findings of Kumar et al. [38] and Gao et al. [16]. Ca is easily converted into Ca2+ ions, which quickly associate with the silicates coming from the alkaline solution to produce C-A-S-H. A gradient of Ca2+ concentration appears between the solution and the GGBS particles, promoting the dissolution of Ca into the solution. According to Puligilla and Mondal [39], GGBS also enhances long-term polymerization because the medium is more basic. The fast initial setting observed for pure GGBS AAMs can also be explained by the fineness of the GGBS (Figure 1). Adding FA, which has a very low reactivity at ambient conditions, significantly delayed the initial setting time (Figure 6 (b)) and explains why higher FA content was not considered. Kumar et al. [38] show that the setting time of GGBS-FA paste can be significantly reduced by curing the sample at 60°C. However, this is associated with higher energy consumption and was thus banned from this study. The compatibility of the two cementitious gels (C-A-S-H and N-A-S-H) has important implications for AAMs with high Ca content, in which both products might be expected. Under high pH conditions (pH > 12), the presence of Ca degrades N-A-S-H and promotes C-A-S-H formation. Replacing a large proportion of low Ca content aluminosilicate precursors by GGBS would lead to a high pH medium. If the pH is low enough (< 12), N-A-S-H persists [62].
For MK-GGBS AAMs, the highest Ca content (Figure 5 (e) and (f)) was also associated with the lowest initial setting time (Figure 6 (c) - 70 and 45 minutes for A₂₅GGBS₇₅ and A₁₅GGBS₈₅, respectively) for the same reasons as for GGBS-FA AAMs.
Very fast initial setting time (less than one hour) can cause placing problems on a construction site. The proportions of raw materials (ternary - Figure 2) must be adapted according to the initial setting time requirements. Thus, varying the proportions of the precursors should allow us to manage the setting time.
4.2 Mass loss
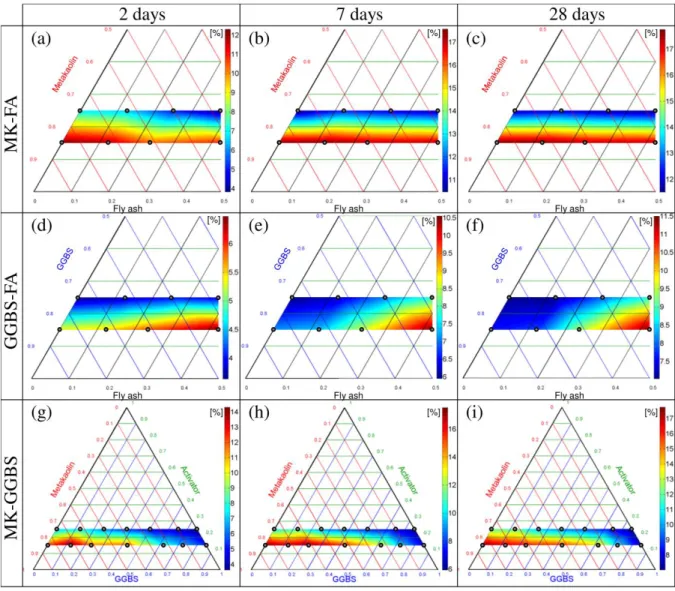
Figure 7. Mass loss.
The mass loss results are presented in Figure 7. This phenomenon has not been widely studied in the literature for blended AAMs. As a reminder, after only 24 h, our samples were unmoulded and placed directly in unrestrained shrinkage conditions (20°C - 50% HR). These conditions are harsh for early age samples (even more so because there is no aggregate to restrain the shrinkage). Originally, all the samples contained exactly the same amount of water (coming from the alkaline solution and a water addition to reach the desired fixed W/B ratio of 0.36). Three types of water were considered: chemically bound, physically absorbed and free. The chemically bound water was not evaporable at ambient temperature. However, major differences appeared at 28 days: the maximum mass loss was 17.8% (A₁₅MK₇₂.₅FA₁₂.₅)
For MK-FA, mass loss mostly depended on activator content (Figure 7 (a), (b) and (c)) and was maximum with low activation rate (high SiO2/NA2O ratio). Mass loss was a very fast phenomenon. After
2 days (1 day under unrestrained shrinkage conditions), mass loss had reach high values, from 4% to 12% (Figure 7). Furthermore, as the FA contained a small amount of Ca, a higher activation could have created more C-A-S-H and more chemically bound water.
Replacing MK by GGBS led to lower mass loss values. This is in agreement with the formation of C-A-S-H structures. GGBS contributed a significant amount of Ca that quickly reacted with water which explained the short initial setting time observed in Figure 6 (b). In contrast to the geopolymerization process observed for low Ca content, in which the water was finally released, some water was incorporated in the C-A-S-H structure and chemically bound. This explains why mass loss was lower for GGBS-FA than MK-FA AAMs. The maximum mass loss was observed for higher FA content and lower activator content (11.5% - A₁₅GGBS₄₂.₅FA₄₂.₅). For this sample, the pH might have been lower because
the activation rate was low and GGBS content was minimum. Thus, C-A-S-H gel formation (and chemical binding of water) may have been limited and could explain the large mass loss observed. Adding GGBS may increase the pH and lead to higher C-A-S-H formation [62] which would explain the lower mass loss values obtained for the higher GGBS content at 28 days (Figure 7 (f)).
The influence of Ca content on mass loss is also observable on MK-GGBS AAMs in Figure 7 (g), (h) and (i). For higher GGBS content, the mass loss was also reduced because of massive C-A-S-H formation (only 7.0% and 7.6% mass loss for A₂₅GGBS₇₅ and A₁₅GGBS₈₅ after 28 days, respectively). Increasing the MK content simultaneously reduced the CaO/Al2O3 and CaO/SiO2 ratios (Figure 5 (e) and (f)) and
may have reduced the pH. It could enhance A-S-H formation and lead to higher water loss because N-A-S-H gel releases water after geopolymerization. Water plays the role of a reaction medium, but resides within pores in the gel [4]. Significant difference was also observed between the pure MKs although they did not contain Ca. Lower activation led to higher mass loss (17.8% and 11.9% for A₁₅MK₈₅ and A₂₅MK₇₅, respectively). Because the geopolymer matrix was poorly formed, a relatively large amount of water was free and could evaporate easily. The microstructure was weak and little water was chemically bound, so water loss became impossible to prevent after only 24 h. This water release was detrimental to the AAMs’ properties (compressive strength, shrinkage, etc.) because the geopolymerization process occurred in an aqueous medium. The presence of water is indispensable for good geopolymerization. We think that the relationship between Ca content and mass loss could only be made in the same category of
AAM, as the products of reaction are completely different depending on the presence of Ca (for instance AAM containing GGBS produced some C-A-S-H, while MK-FA mixtures produced only alumino-silicates). The average of the mass loss relative standard deviation obtained for the 26 mixes is presented in Table 4 (last line). The highest mass loss relative standard deviation was observed at 2 days while the mass loss rate was fast. However, the value was quite small (3.8%), which indicates good repeatability of the measurements.
4.3 Shrinkage
Most studies on AAMs have focused on mechanical and microstructural properties. However, shrinkage problems cannot be ignored [27,43,44]. Estimating and limiting this volume change is extremely important if the use of AAMs is to spread in civil engineering applications. In this part the total shrinkage was measured. The total shrinkage of AAMs is caused by several concurrent phenomena, chemical shrinkage, self-desiccation shrinkage and drying shrinkage. The sum of chemical and self-desiccation shrinkages is called autogenous shrinkage.
Figure 8. Shrinkage.
The shrinkage results are presented in Figure 7. Under the severe shrinkage conditions employed (20°C - 50% HR - 24h after sample preparation), some samples reached huge shrinkage values. The greatest shrinkage, at 28 days, was 4.3% (A₁₅GGBS₈₅). For the three ternary compositions, it should be noted that, after 2 days (1 day under shrinkage test), the shrinkage values were already significant, in agreement with [25,27].
At 2 days, for geopolymers, higher shrinkage values are obtained for AAMs made with pure MK or MK-FA having a high MK content and for high activation rates (2.2% and 2.1% for A₂₅MK₇₅ and A₂₅MK₆₂.₅FA₁₂.₅ respectively). For geopolymer, only a small percentage of the mixing water remains as
pore water in the geopolymer gel. There is a large excess of unbound or free water, which can evaporate from the hardened state at low relative humidity at ambient temperature [18]. These high total shrinkage values can be partially explained by the significant mass loss observed after only 2 days (Figure 7 (a)). However, the maximum mass loss values (Figure 7 (a)) do not correspond to the maximum shrinkage
values (Figure 7 (a)), which means that self-desiccation shrinkage plays an important role when the activation rate and MK content are high, at 2 days. At 28 days, the highest shrinkage values are obtained for the highest amount of FA and high alkali activation (3.4% for A₂₅MK₃₇.₅FA₃₇.₅, at 28 days) which
corresponds to the highest Na2O/Al2O3 ratio. At low temperature (20°C), the FA are not well activated
and do not participate completely in the strength gain of these samples. After 24 h, only MK had partially reacted and these two samples would have very low mechanical properties (see Figure 9 (a) - Rc =
3.7 MPa for A₂₅MK₃₇.₅FA₃₇.₅). It is reasonable to say that, at 28 days, the contribution of FA to the stress
gain is very small. The high shrinkage values can be explained by the inability of the weak microstructure to prevent volume change caused by drying and autogenous shrinkage. For pure MK, shrinkage remains high (2.4 and 1.3% for A₂₅MK₇₅ and A₁₅MK₈₅ at 28 days).
The shrinkage of pure GGBS AAMs is presented in Figure 7 ((d), (e) and (f)). At 2 days, a significant difference is seen between high and low activation rates. The shrinkage values are 1.1% and 2.4% for A₂₅GGBS₇₅ and A₁₅GGBS₈₅ respectively. For A₂₅GGBS₇₅, the activation is fast and a larger quantity of GGBS is converted into C-A-S-H when the samples are unmoulded. The degree of hydration is higher, which would results in an increase in C-A-S-H volume and a decrease in porosity. A₂₅GGBS₇₅ trapped more water than A₁₅GGBS₈₅ (Figure 7 (d)). The mass losses were 3.6% and 5.3% for A₂₅GGBS₇₅ and A₁₅GGBS₈₅, respectively, at 2 days. Thus, the significant shrinkage differences may be explained by a better ability of A₂₅GGBS₇₅ to convert free water into chemically bound water, thus preventing fast drying shrinkage. At 28 days, the highest shrinkage value was obtained by A₁₅GGBS₈₅ (4.3%) and correspond to the highest CaO/SiO2 ratio. A₂₅GGBS₇₅ shrinkage was 3.6%. Under these conditions, mass
losses were relatively low and similar (7.0 and 7.6% for A₂₅GGBS₇₅ and A₁₅GGBS₈₅ - Figure 7 (f)) compared to the other MK-FA AAMs. Actually, compared to A15GGBS85, A25GGBS75 can have a
relatively high degree of hydration and is likely to form a well-structured silicate-aluminate network due to the high activator content used. Thus, the water in A25GGBS75 is likely to manifest itself in the form of
chemically bound water instead of free water, which prevents fast drying shrinkage and mass loss. This means that the very high shrinkage values obtained are not only correlated with water loss. They might come from endogenous shrinkage as announced by Melo Neto et al. [25]. These results are in contradiction with the results of Chen et al. [63] who found that shrinkage of pure GGBS AAMs increased with higher doses of activator (and GGBS fineness).
Adding FA to pure GGBS AAMs reduced the shrinkage slightly, although mass loss increased (the shrinkage was 3.6% and 1.8%, and mass loss was 11.5% and 8.8% for A15GGBS42.5FA42.5 and
A25GGBS37.5FA37.5, respectively, at 28 days). Gao et al. [44] also obtained the lowest shrinkage value for
GGBS-FA mortars with the highest FA content. This could stem from a different pore-size distribution. Lee et al. [43] found similar results on GGBS-FA paste and mortar and attributed the high shrinkage values, observed when the proportion of GGBS was high, to high autogenous shrinkage. The highest shrinkage values were obtained for low activation rate (≥ 1.8% at 2 days; ≥ 3.6% at 28 days). Whatever the proportion employed, GGBS-FA shrinkage remained high (≥ 1.8% at 28 days). This is a serious handicap for building applications when it is applied in practice.
Interesting evolution of shrinkage in the MK-GGBS AAMs is presented in Figure 7 ((g), (h) and (i)). After 2 days, pure MK and pure GGBS shrinkage were 1.2% (A₁₅MK₈₅) and 2.4% (A15GGBS85). At 28
days, shrinkage values reached 1.3 and 4.3% for A15MK85 and A15GGBS85 respectively. After 28 days,
the samples A₁₅MK₇₂.₅GGBS₁₂.₅ and A₁₅MK₆₁GGBS₂₄ presented very low shrinkage (0.5%) compared
to pure MK or pure GGBS and the other AAMs studied.
Figure 9. Shrinkage versus mass loss (circle: high activation rate; square: low activation rate).
To understand the differences between pure MK, pure GGBS and blended MK-GGBS AAMs regarding the relationship between shrinkage and mass loss, Figure 9 presents the shrinkage and mass loss evolution at 2, 7, 14, 21 and 28 days (Table 4). For pure GGBS, however low or high the activation is, the shrinkage shows a similar increasing trend with mass loss. However, for pure MK, the increasing rate of
0.0 0.5 1.0 1.5 2.0 2.5 3.0 3.5 4.0 4.5 0 5 10 15 20 A₂₅GGBS₇₅ A₁₅GGBS₈₅ A₂₅MK₇₅ A₁₅MK₈₅ A₂₅MK₆₂.₅GGBS₁₂.₅ A₁₅MK₇₂.₅GGBS₁₂.₅ A₂₅MK₅₀GGBS₂₅ A₁₅MK₆₁GGBS₂₄ Shrinkage [%] Mass loss [%]
shrinkage vs mass loss is totally different between low and high activations. For high activation A25MK75,
the shrinkage is higher than that for low activation A15MK85 when the same level of mass loss is taken
into account. The excessive shrinkage of A25MK75 compared to A15MK85 can be attributed to autogenous
shrinkage.
It is surprising to see that some compositions mixing MK and GGBS have lower shrinkage values than values obtained with these precursors alone. At low activation rate, A15MK85 and A15GGBS85 initial
setting times are 265 and 45 minutes respectively. Thus, in A15MK72.5GGBS12.5, between 45 and 265
minutes, the C-A-S-H solid phase would appear in the paste as N-A-S-H solid phase appear more than 2 hours later. In these systems, both type of reaction products C-A-S-H from GGBS and N-A-S-H from the metakaolin are able to coexist [47]. As GGBS content is quite small compared to MK content, these particles would act as solid aggregates (discontinuous phase) that restrain the strong shrinkage caused by mass loss and explain the low shrinkage value obtained (0.5% at 28 days). If the GGBS content is increased (A15MK61GGBS24) the shrinkage does not evolve (0.5% at 28 days) because the GGBS content
remains small compared to MK. However if the GGBS content becomes equal to or greater than the MK content, shrinkage increases, probably because GGBS quickly creates a continuous solid skeleton in which the lower Ca N-A-S-H phase is included (1.1% and 2.5% for A15MK42.5GGBS42.5 and
A15MK61GGBS24 respectively). A similar evolution is observed at higher activation rate and the shrinkage
values reached are always higher than the values obtained for low activation rate. As observed for mass loss, the highest shrinkage relative standard deviation is observed at 2 days (3.3% - Table 4 - last line). The shrinkage average relative standard deviation remains small, revealing good repeatability of the shrinkage measurements.
Shrinkage is a major issue for AAMs [18,25]. The shrinkage results presented were obtained under severe shrinkage conditions. However, some interesting results were found by changing the proportions of the raw materials. To prevent shrinkage on MK-FA samples, low activation and low FA content is advised. GGBS-FA AAMs present high shrinkage, especially if the amount of GGBS is high. The association of the right proportions of GGBS and MK can significantly reduce the shrinkage problems encountered with pure MK [18] or pure GGBS AAMs [27]. Furthermore, protecting the samples from fast water loss for a few days would probably have led to much lower shrinkage values (especially for MK samples).
4.4 Compressive strength
The compressive strengths of the 26 mixes made are presented in Figure 9. Tests were carried out after unmoulding (1 day), 7 and 28 days. After 1 day, MK-FA samples presented a wide range of compressive strength values (Figure 9 (a)). The lowest values were obtained for the highest FA content (Rc = 3.7 MPa
for A₂₅MK₃₇.₅FA₃₇.₅ and Rc = 1.2 MPa for A₁₅MK₄₂.₅FA₄₂.₅) which corresponds to the lower
SiO2/Na2O ratio. High FA substitution tends to reduce the early strength development of MK-FA AAMs.
At 1 day, the highest compressive strength values were obtained for high activation rates with pure MK and small FA substitution (Rc = 21.4 MPa for A₂₅MK₇₅ and Rc = 22.0 MPa for A₂₅MK₆₂.₅FA₁₂.₅). The
fact that the compressive strength of A₂₅MK₆₂.₅FA₁₂.₅ was similar to that of A₂₅MK₇₅ may be explained
by better packing of the particles because of their different shapes. Whatever the FA substitution, low activation rate led to low 1 day compressive strength, Rc ≤ 5.6 MPa (Figure 4 (b)). At 7 days, all
compressive strengths increased significantly (Figure 9 (b)). The highest value was still obtained by A₂₅MK62.5FA₁₂.₅ (Rc = 52.0 MPa). This is in agreement with the results of Duan et al. [64]. Between 7
and 28 days, the compressive strength did not evolve to any great extent (+ 2.6 MPa on average), which means that the degree of reaction of MK was already significant at 7 days.
Figure 10. Compressive strength.
The compressive strength evolution of GGBS-FA mixes showed significant differences (Figure 9 (d), (e) and (f)). At 1 day (Figure 9 (d)), the highest compressive strength was obtained with A₂₅GGBS₇₅ (Rc = 52.0 MPa). In a medium that was highly alkaline, because of high the Ca content, a strong C-A-S-H
structure appeared quickly, leading to this fairly high compressive strength after 1 day. As observed for MK-FA, adding FA was detrimental to compressive strength because of its low activity. After 7 days (Figure 9 (e)), the pure GGBS sample with the low activator content (A₁₅GGBS₈₅) had reached the highest compressive strength (Rc = 80.4 MPa). At 28 days, this sample still had the highest compressive
strength (Rc = 110.5 MPa). A lower activator content was preferable to dissolve more GGBS and enhance
the long-term reaction.
In FA systems, replacing MK by GGBS had a very positive effect on the compressive strength and, at 28 days, the lowest GGBS-FA compressive strength was 61.6 MPa (A₂₅GGBS₃₇.₅FA₃₇.₅) while it was 10.2
because of its low reactivity [38]. A significant development of the compressive strength (+ 23 MPa on average) was also observed between 7 and 28 days, meaning that the high pH provided by the Ca promoted a long-term reaction that could dissolve FA particles, enabling them to contribute to the strength gain, contrary to what was observed for MK-FA AAMs. The negative effect of FA on the compressive strength of GGBS-FA AAMs is also highlighted in [41,44]. GGBS grains are very fine (Table 2) and this physical characteristic could also explain the good mechanical performance observed. The evolution of MK-GGBS compressive strength is presented in Figure 9 ((g), (h) and (i)). Interesting compressive strength values are observed at 1 day for some MK-GGBS blends when GGBS content is lower than or equal to the MK content. The compressive strengths are 45.5 and 41.0 MPa for A25MK50GGBS25 and A25MK37.5GGBS37.5, respectively. These values are higher than for the pure MK
sample A25MK50 (21.4 MPa), but also higher than values obtained with higher GGBS substitution rates
(Rc = 31.6 and 15.5 MPa for A₂₅MK₂₅GGBS₅₀ and A25MK12.5GGBS62.5, respectively). This good
compatibility between MK and GGBS, already observed regarding shrinkage results, may be associated with good interactions between C-A-S-H and N-A-S-H gels. At 7 and 28 days the effect was less marked in (h) and (i) because of the high compressive strength obtained by pure GGBS AAMs. The compressive strength average relative standard deviations were higher than those observed for mass loss and shrinkage, with values of 8.7, 12.2 and 11.7% for 1, 7 and 28 days, respectively. Due to the relatively small size of the specimens, there was a higher dispersion in the compressive strength results, which explains why the measurements were performed on eight specimens at each term.
Ternary composition Molar ratio
Initial setting time
Shrinkage Mass loss Compressive strength Activator MK FA GGBS SiO₂/Al₂O₃ SiO₂/Na₂O Na₂O/Al₂O₃ H₂O/Na₂O CaO/Al₂O₃ CaO/SiO₂ Ts Δl / l₀ Δm / m₀ Rc
Unit % % % % - mins % % MPa
Time [days] - 2 7 14 21 28 2 7 14 21 28 1 7 28 A₂₅MK₆₂.₅FA₁₂.₅ 62.5 12.5 25 0 3.83 3.91 0.98 12.43 0.04 0.01 380 2.1 2.2 2.3 2.3 2.3 6.5 11.5 12.0 12.0 12.1 22.0 52.0 54.2 A₂₅MK₅₀FA₂₅ 25.0 50.0 25.0 0.0 4.25 3.99 1.06 12.35 0.06 0.01 550 1.5 2.6 2.7 2.7 2.7 5.0 11.0 11.7 11.7 11.7 7.8 41.6 46.7 A₂₅MK₃₇.₅FA₃₇.₅ 25.0 37.5 37.5 0.0 4.75 4.08 1.17 12.27 0.09 0.02 750 1.4 3.2 3.3 3.3 3.4 3.8 10.8 11.5 11.5 11.5 3.7 28.1 30.8 A₁₅MK₇₂.₅FA₁₂.₅ 15.0 72.5 12.5 0.0 3.07 5.93 0.52 20.52 0.03 0.01 260 1.0 1.1 1.1 1.1 1.2 11.8 17.6 17.7 17.7 17.8 5.6 15.9 17.5 A₁₅MK₆₁FA₂₄ 15.0 61.0 24.0 0.0 3.36 6.03 0.56 20.32 0.05 0.02 475 1.1 1.2 1.2 1.2 1.2 10.3 17.2 17.3 17.4 17.4 1.9 10.1 12.0 A₁₅MK₄₂.₅FA₄₂.₅ 15.0 42.5 42.5 0.0 3.91 6.20 0.63 20.01 0.09 0.02 480 1.2 1.3 1.3 1.3 1.3 11.0 17.1 11.5 17.4 17.4 1.2 9.3 10.2 A₂₅MK₇₅ 25.0 75.0 0.0 0.0 3.46 3.83 0.90 12.52 0.02 0.00 360 2.2 2.3 2.3 2.4 2.4 6.8 10.5 11.6 11.8 11.9 21.4 50.5 53.2 A₁₅MK₈₅ 15.0 85.0 0.0 0.0 2.80 5.81 0.48 20.75 0.02 0.01 265 1.2 1.2 1.2 1.3 1.3 12.3 17.5 17.7 17.7 17.8 2.5 7.7 10.4 A₂₅MK₆₂.₅GGBS₁₂.₅ 25.0 62.5 0.0 12.5 3.90 4.04 0.99 12.53 0.62 0.16 300 0.8 0.8 0.9 0.8 0.9 7.6 11.1 11.7 11.9 12.0 31.6 66.5 69.8 A₂₅MK₅₀GGBS₂₅ 25.0 50.0 0.0 25.0 4.44 4.05 1.10 12.54 1.36 0.31 160 1.0 1.2 1.3 1.3 1.3 6.2 9.0 9.9 10.2 10.2 45.5 58.6 62.7 A₂₅MK₃₇.₅GGBS₃₇.₅ 25.0 37.5 0.0 37.5 5.11 4.16 1.23 12.55 2.27 0.44 115 1.0 1.7 1.7 1.9 1.9 5.4 8.3 9.0 9.3 9.6 41.0 55.3 65.3 A₂₅MK₂₅GGBS₅₀ 25.0 25.0 0.0 50.0 5.95 4.28 1.39 12.57 3.43 0.58 90 1.1 2.5 2.9 3.0 3.1 4.7 7.7 8.5 8.8 9.1 31.6 57.6 79.3 A₂₅MK₁₂.₅GGBS₆₂.₅ 25.0 12.5 0.0 62.5 7.07 4.39 1.61 12.58 4.96 0.70 105 1.3 3.3 3.7 3.8 3.8 4.3 7.3 7.9 8.3 8.3 15.5 47.6 82.3 A₁₅MK₇₂.₅GGBS₁₂.₅ 15.0 72.5 0.0 12.5 3.13 6.00 0.52 20.78 0.54 0.17 115 0.3 0.4 0.4 0.5 0.5 14.3 16.6 16.7 16.7 16.7 16.4 36.9 47.1 A₁₅MK₆₁GGBS₂₄ 15.0 61.0 0.0 24.0 3.48 6.17 0.56 20.81 1.12 0.32 65 0.3 0.4 0.4 0.5 0.5 11.5 16.1 16.1 16.2 16.2 26.8 38.2 50.8 A₁₅MK₄₂.₅GGBS₄₂.₅ 15.0 42.5 0.0 42.5 4.20 6.45 0.65 20.87 2.27 0.54 50 0.9 1.0 2.6 1.1 1.1 11.7 15.6 15.7 15.7 15.7 21.7 34.0 46.3 A₁₅MK₂₄GGBS₆₁ 15.0 24.0 0.0 61.0 5.19 6.74 0.77 20.92 3.85 0.74 40 2.0 2.3 2.4 2.4 2.5 7.9 13.0 13.8 14.1 14.1 16.0 31.5 92.8 A₁₅MK₁₂.₅GGBS₇₂.₅ 15.0 12.5 0.0 72.5 6.91 6.91 0.87 20.95 5.17 0.86 40 3.1 3.9 4.1 4.2 4.2 6.9 9.7 10.6 10.7 10.8 17.9 66.5 98.6 A₂₅GGBS₇₅ 25.0 0.0 0.0 75.0 8.60 4.50 1.91 12.59 7.06 0.82 70 1.1 2.8 3.4 3.6 3.8 3.6 5.9 6.5 6.6 7.0 44.5 67.3 83.7 A₁₅GGBS₈₅ 15.0 0.0 0.0 85.0 7.19 7.10 1.01 20.99 7.06 0.98 45 2.4 3.9 4.1 4.2 4.3 5.3 7.1 7.5 7.6 7.6 32.2 80.4 110.5 A₁₅GGBS₇₂.₅FA₁₂.₅ 15.0 0.0 12.5 72.5 6.53 7.09 0.92 20.68 5.49 0.84 45 2.2 3.5 3.8 3.9 3.9 5.5 7.4 7.7 7.8 7.8 29.5 75.7 103.1 A₂₅GGBS₆₂.₅FA₁₂.₅ 25.0 0.0 12.5 62.5 7.70 4.52 1.70 12.48 5.30 0.69 110 1.1 2.9 3.3 3.3 3.4 3.8 6.2 6.8 7.0 7.1 22.1 63.4 78.9 A₂₅GGBS₅₀FA₂₅ 25.0 0.0 25.0 50.0 6.98 4.53 1.54 12.37 3.91 0.56 145 0.9 2.2 2.3 2.3 2.3 4.0 7.1 7.7 7.9 8.0 23.8 48.6 67.5 A₂₅GGBS₃₇.₅FA₃₇.₅ 25.0 0.0 37.5 37.5 6.41 4.55 1.41 12.27 2.77 0.43 230 0.8 1.7 1.8 1.8 1.8 3.9 7.8 8.7 8.7 8.8 12.8 34.2 61.6 A₁₅GGBS₆₁FA₂₄ 15.0 0.0 24.0 61.0 6.03 7.08 0.85 20.41 4.30 0.71 50 2.0 3.4 3.6 3.7 3.8 5.9 8.6 10.5 9.1 9.4 24.0 67.2 94.3 A₁₅GGBS₄₂.₅FA₄₂.₅ 15.0 0.0 42.5 42.5 5.39 7.07 0.76 19.98 2.77 0.51 60 2.1 3.3 3.5 3.6 3.6 6.5 10.5 11.1 11.3 11.5 12.4 42.8 67.5 Relative average standard deviation [%] 3.8 3.1 2.5 2.1 2.2 3.3 1.6 1.0 1.0 1.2 8.7 12.2 11.9
5 Discussion
This discussion part and associated summary table (Table 5) aim to summarize all the information presented in this article and to guide the formulation of blended AAMs depending on the users’ needs. On-site, it is important to mastered initial setting time and FA can be used as a retarder for both MK and GGBS AAM. For pure MK, initial setting lied between 360 and 235 minutes which can be long enough for on-site production. However, pure GGBS AAMs presented very short initial setting time (70 and 45 minutes for A25GGBS75 and A15GGBS85 respectively) which can cause problems on-site. Using FA to
mastered initial setting time seemed appropriate as it reduce the SiO2/Al2O3 ratio. For MK-GGBS blends,
MK content could also be adjusted to achieve to required initial setting time.
Mass loss is not a very important property for civil engineering applications. However, it is highly correlated to shrinkage for geopolymers (low Ca content, MK or FA). For geopolymers, mass loss strongly depended on activation rates. Increasing activator content (i.e. increasing Na2O/Al2O3 ratio)
reduced mass loss. When GGBS was employed, the reaction path was very different and a significant amount of water was chemically bonded, which explained why the mass loss was reduced with GGBS. The literature and experimental results indicate that pure MK or pure GGBS AAMs suffer from shrinkage. Adding FA to MK had a positive impact on shrinkage after 2 days. However, at 28 days, the highest shrinkage values were obtained for the highest amount of FA and high alkali activation (higher SiO2/Al2O3 ratio). For GGBS-FA blends, FA addition interestingly reduced the shrinkage (for both
activation rates). Finally, the experimental results revealed that if MK and GGBS were mixed in proper proportion, it significantly decreased the shrinkage problems encountered with pure MK [18] or pure GGBS AAMs [27].
Very different compressive strength results were achieved. The experiments showed that adding small FA content (12.5%) to MK AAMs did not modify the compressive strength for high activation rate and it increased the compressive strength for low activation rate. However, FA content must be kept below or equal to 12.5%, otherwise compressive strength decreased. Nonetheless, acceptable compressive strength was still achieved for high activation rate and high FA content (30.8 MPa for A25MK37.5FA37.5 at 28
days). Compared to MK-FA, GGBS-FA systems reached higher compressive strength. As observed for MK-FA blends, FA tended to decrease the compressive strength value but could be required to achieve longer initial setting time as indicated above. Unlike MK-FA AAMs, the higher compressive strength
were obtained at low activation rate which was very interesting because alkaline solution was the most expensive component of these AAMs. Finally, at 28 days, MK-GGBS blends compressive strength were between those of pure MK and pure GGBS AAMs. However, very high early strength were observed for MK-GGBS blends if the GGBS content was below or equal to MK (1 day - 45.5 and 41.0 MPa for A25MK50GGBS25 and A25MK37.5GGBS37.5, respectively). It corresponded to the MK-GGBS blends that
also achieved very low shrinkage.
Table 5. Summary of the main results of pure and blended AAMs.
Precursor(s) Initial setting time Mass loss Shrinkage Compressive strength
MK Increase with
SiO2/Al2O3 ratio
Decrease when activator content is increased (i.e. when Na2O/Al2O3 increase)
High Good. Increase with
activation rate
FA
Pure FA AAMs were not tested due to the lack of FA reactivity under ambient temperature. Most of the pure FA AAMs presented on literature are thermally treated to achieve
reasonable compressive strength.
GGBS Short due to Ca presence Small due to C-A-S-H formation High High compressive strength. Highest 28 days
compressive strength obtained for low
activation rate
MK-FA Increase with FA
content Increase with FA content High. Adding FA increases shrinkage. Shrinkage also increases with high activation rate
When FA content exceeds 12%, compressive
strength strongly decreased.
GGBS-FA
Increase with FA content but remain smaller than MK-FA blends Increase with FA content but remain smaller than MK-FA blends High FA content significantly decreases shrinkage, especially at high activation rate FA decreased compressive strength MK-GGBS Increase with MK content Decrease with GGBS and high activation rate MK-GGBS blends achieved lower shrinkage than pure
MK or GGBS AAMs
High early strength observed when GGBS content is lower than or equal to the MK content
6 Conclusion
The influence of several AAM compositions on the principal properties useful in civil engineering materials (initial setting time, shrinkage, mass loss, compressive strength) were investigated. All the tests were carried out at ambient temperature. Twenty-six different mixes were studied and have been presented using a ternary representation. The aim was to associate two different precursors (MK and FA, MK and GGBS, or FA and GGBS) in different proportions with two alkaline activator contents (15% and 25% of dry extract of alkaline solution) and investigate the properties obtained in the samples. Some interesting findings were made:
- Pure MK AAMs present an intermediate initial setting time while Pure GGBS AAMs have fast initials setting time. The high Ca content of GGBS explains its very short initial setting time, which is due to fast production of C-A-S-H gel. FA can be used to delayed setting for both pure MK and GGBS AAMs.
- For geopolymer (low Ca content precursors), mass loss and shrinkage are highly related. Shrinkage is mainly due to drying. Pure GGBS AAMs shrinkage is mostly autogenous.
- The association of MK and GGBS, in the right proportions enable to significantly reduce shrinkage. Very low shrinkage values were found for MK-GGBS (with low GGBS content) compared to the other AAMs.
- Good mechanical performances were achieved by both MK and GGBS AAMs. Higher
compressive strength value are obtained with high activation rate while he best values were observed for low activation rate for pure GGBS which is economically interesting given the high cost of the alkaline solution.
- High early compressive strength (up to 45.5 MPa at 1 day) was observed for MK-GGBS blends with high activator content and a relatively small proportion of GGBS (12.5 to 37.5%).
A summary table was presented at the end of the discussion part. This article should help in the formulation of blended AAMs based on the association of two aluminosilicate precursors depending on the desired properties.
7 References

![Table 2. Raw material physical characteristics, * = obtained with BET analysis [52].](https://thumb-eu.123doks.com/thumbv2/123doknet/14314596.495874/8.892.130.817.490.1142/table-raw-material-physical-characteristics-obtained-bet-analysis.webp)