HAL Id: hal-02288978
https://hal.umontpellier.fr/hal-02288978
Submitted on 16 Sep 2019
HAL is a multi-disciplinary open access
archive for the deposit and dissemination of
sci-entific research documents, whether they are
pub-lished or not. The documents may come from
teaching and research institutions in France or
abroad, or from public or private research centers.
L’archive ouverte pluridisciplinaire HAL, est
destinée au dépôt et à la diffusion de documents
scientifiques de niveau recherche, publiés ou non,
émanant des établissements d’enseignement et de
recherche français ou étrangers, des laboratoires
publics ou privés.
Impact-Induced Porosity and Microfracturing at the
Chicxulub Impact Structure
Auriol S.P. Rae, Gareth S. Collins, Johanna V. Morgan, Tobias Salge, Gail L.
Christeson, Jody Leung, Johanna Lofi, Sean P.S. Gulick, Michael H. Poelchau,
Ulrich Riller, et al.
To cite this version:
Auriol S.P. Rae, Gareth S. Collins, Johanna V. Morgan, Tobias Salge, Gail L. Christeson, et al..
Impact-Induced Porosity and Microfracturing at the Chicxulub Impact Structure. Journal of
Geo-physical Research. Planets, Wiley-Blackwell, 2019, 124 (7), pp.1960-1978. �10.1029/2019JE005929�.
�hal-02288978�
Auriol S. P. Rae1,2 , Gareth S. Collins1 , Joanna V. Morgan1 , Tobias Salge3,
Gail L. Christeson4 , Jody Leung1, Johanna Lofi5, Sean P. S. Gulick4 , Michael Poelchau2 ,
Ulrich Riller6 , Catalina Gebhardt7, Richard A. F. Grieve8 , and Gordon R. Osinski8
1Department of Earth Science and Engineering, Imperial College London, London, UK,2Institut für Geo- und Umweltnaturwissenschaften, Albert-Ludwigs-Universität Freiburg, Geologie, Freiburg, Germany,3Imaging and Analysis Centre, Natural History Museum, London, UK,4Institute for Geophysics and Department of Geological Sciences, Jackson School of Geosciences, University of Texas at Austin, Austin, TX,USA,5Gèosciences Montpellier, Universitè de Montpellier, Montpellier, France,6Institut für Geologie, Universität Hamburg, Hamburg, Germany, 7Alfred Wegener Institute, Helmholtz Centre of Polar and Marine Research, Bremerhaven, Germany,8Department of Earth Sciences/Centre for Planetary Science and Exploration, Western University, London, Ontario, Canada
Abstract
Porosity and its distribution in impact craters has an important effect on the petrophysical properties of impactites: seismic wave speeds and reflectivity, rock permeability, strength, and density. These properties are important for the identification of potential craters and the understanding of the process and consequences of cratering. The Chicxulub impact structure, recently drilled by the joint International Ocean Discovery Program and International Continental scientific Drilling Program Expedition 364, provides a unique opportunity to compare direct observations of impactites with geophysical observations and models. Here, we combine small-scale petrographic and petrophysical measurements with larger-scale geophysical measurements and numerical simulations of the Chicxulub impact structure. Our aim is to assess the cause of unusually high porosities within the Chicxulub peak ring and the capability of numerical impact simulations to predict the gravity signature and the distribution and texture of porosity within craters. We show that high porosities within the Chicxulub peak ring are primarily caused by shock-induced microfracturing. These fractures have preferred orientations, which can be predicted by considering the orientations of principal stresses during shock, and subsequent deformation during peak ring formation. Our results demonstrate that numerical impact simulations, implementing the Dynamic Collapse Model of peak ring formation, can accurately predict the distribution and orientation of impact-induced microfractures in large craters, which plays an important role in the geophysical signature of impact structures.Plain Language Summary
The Chicxulub crater, Mexico, is widely known for its association with the extinction of the nonavian dinosaurs at the end of the Cretaceous period. The crater was first identified due to its gravitational and magnetic anomalies. Potential impact structures are often identified, in part, on the basis of geophysical anomalies, most commonly including a circular gravity low. Gravity is slightly weaker at craters because the impact cratering process removes mass from the impact site. In this study, we examine the cause of the Chicxulub gravity anomaly by combining observations from recent drilling of the crater, geophysical data measured across the crater, and numerical impact simulations. We demonstrate that porosity in rocks beneath the crater floor is primarily accommodated by fracturing during the impact cratering process, that the orientation of those fractures are consistent with predictions from numerical impact simulations, and that impact-induced porosity is one of the primary causes of gravity anomalies in large impact craters.1. Introduction
Impact cratering is the dominant surface process on most solid bodies of the solar system. The process of hypervelocity impact causes irreversible changes to the nature and physical properties of rocks (Melosh, 1989). These changes produce anomalies in geophysical data that make craters conspicuous in compari-son to the surrounding rocks. The identification of potential craters, on Earth and, increasingly, across the
Key Points:
• The Chicxulub peak ring is extremely porous and low density due to pervasive shock-induced microfracturing
• The orientation of shock-induced microfractures are sensitive to the orientation of stress during shock • Shear-induced dilatancy is an
important cause of gravity anomalies in large complex craters
Supporting Information: • Supporting Information S1 Correspondence to: A. S. P. Rae, auriol.rae@geologie.uni-freiburg.de Citation: Rae, A. S. P., Collins, G. S., Morgan, J. V., Salge, T., Christeson, G. L., Leung, J., et al. (2019). Impact-induced porosity and microfracturing at the Chicxulub impact structure. Journal of
Geophysical Research: Planets, 124, 1960–1978. https://doi.org/10.1029/ 2019JE005929
Received 21 JAN 2019 Accepted 8 JUL 2019
Accepted article online 15 JUL 2019 Published online 26 JUL 2019
©2019. American Geophysical Union. All Rights Reserved.
Journal of Geophysical Research: Planets
10.1029/2019JE005929
Solar System (e.g., Zuber et al., 2013) is primarily achieved by remote geophysical surveying. The most com-monly observed geophysical signature of an impact structure is a circular region of negative residual gravity (Pilkington & Grieve, 1992). Negative residual gravity anomalies at craters are caused by the replacement of high-density intact rocks in the preimpact target with fractured para-autochthonous rocks, porous impact breccias, and/or the relative loss of mass due to excavation and basin infill (whether it is filled by atmosphere, water, post-impact sedimentary rocks, or vacuum). Within complex craters, which are shallow compared to their diameters, the main contributor to the gravity signature derives from fractured para-autochthonous target rocks beneath the floor of the crater (Pilkington & Grieve, 1992). Additionally, large complex craters (>40 km) may have relative gravity highs in their center due to the uplift of high-density material from depth during cratering. The presence of low-density, porous rocks in impact structures has important implications for the transport of fluids within craters: affecting the viability and longevity of hydrothermal activity (e.g., Abramov & Kring, 2007), the distribution of potential hydrocarbon reservoirs (Grieve, 2005), and the habit-ability of impact structures for microbial life (Cockell, 2006). Consequently, understanding how small-scale properties of impactites link to the large-scale geophysical characteristics of craters is of critical importance. Impact simulations are now capable of modeling the tendency of rocks and granular materials to change volume during shear failure, that is, dilatancy. Results of impact simulations using this model are consistent with porosity measurements and the gravity anomalies of simple craters (Collins, 2014). However, limited porosity data have hindered comparisons with complex craters. Furthermore, while the importance of frac-turing in reducing the density of para-autochthonous impactites has been widely acknowledged, detailed analysis of the microporosity and microfracturing of shocked para-autochthonous rocks (e.g., Winkler et al., 2018) is limited, particularly for naturally shocked rocks.
Here, the Chicxulub impact structure is used as a case study to understand the production of porosity during complex crater formation. We analyze the petrophysical and microstructural character of uplifted basement rocks in the Chicxulub peak ring and, through numerical impact simulations, link our results to the gravity signature across the crater. Our study provides insight into the formation of complex craters and, more specifically, the processes that produce the remarkable physical properties of impact-deformed rocks.
1.1. The Chicxulub Impact Structure and IODP-ICDP Expedition 364
The Chicxulub structure, located in the Yucatán peninsula of Mexico, is a 190- to 210-km diameter impact structure (Figure S1b in the supporting information). Its identification was first made on the basis of large-scale geophysical signatures: a large, circular, negative Bouguer gravity anomaly and magnetic anoma-lies (Hildebrand et al., 1991; Penfield & Camargo, 1981). The only surface expression of the crater's presence is a semicircular ring of water-filled sinkholes, cenotes, in the Cenozoic limestones that overlie the onshore portion of the crater.
Following the discovery of the crater, several attempts were made to constrain the size and structure of the Chicxulub crater based on forward modeling of potential field data (Espindola et al., 1995; Hildebrand et al., 1991, 1995; Sharpton et al., 1993, 1996). The variations between the models, in terms of structure and the density contrasts between lithologies, attest to the nonuniqueness of gravity modeling.
Seismic reflection and refraction surveys were carried out at Chicxulub to resolve the crater dimensions and subcrater structure (Gulick et al., 2008; Morgan et al., 1997). The results of those surveys indicated that the topographic (inner) rim of the crater is 140–170 km in diameter (beyond which are outer ring faults), with a floor approximately 1 km beneath the surface, and an 80- to 90-km diameter peak ring, which rises up to 400 m above the crater floor (Gulick et al., 2013). Beneath the crater center, the mantle has been uplifted by 1.5–2 km (Christeson et al., 2009). The basement, both outside and deep beneath the crater, possesses seismic velocities>5.8 km/ (Christeson et al., 2001), indicating that the preimpact crust, beneath the sedimentary cover, consisted of high-density, nonporous rocks. A ring-shaped Bouguer gravity minimum within the crater corresponds to a radial distance slightly interior to the peak ring. Additionally, beneath the peak ring a strong inward dipping reflector can be observed. Together, these observations indicate that the rocks of the peak ring, and its roots, which dip inwardly, are among the lowest density para-autochtonous rocks within the crater. A detailed review of the geophysical characteristics of the Chicxulub structure can be found in Gulick et al. (2013).
In 2016, a joint expedition of the International Ocean Discovery Program and International Continental scientific Drilling Program (IODP-ICDP Expedition 364) drilled into the peak ring of the Chicxulub
struc-ture (Figure S1c). The expedition recovered core between 505.42 and 1334.69 mbsf (meters below sea floor) including, from 750.25–1334.69 mbsf, a sequence of uplifted granitic target rocks, with occasional sheet intrusions of preimpact igneous rocks and impact-related breccias and melt rocks. A schematic lithological column and location map is shown in Figures S1a and S1b, respectively.
Physical property data from the expedition (Christeson et al., 2018; Morgan et al., 2017) have shown that the shocked target rocks within the Chicxulub peak ring have porosities of approximately 10%, which is a likely cause of the gravity minimum associated with the peak ring. However, the microstructural cause of this porosity is uncertain and it is not known how porosity is more widely distributed across the crater. Here, we assess the cause of the unusually low densities and high porosities of the uplifted granitic rocks of the Chicxulub peak ring. These results help constrain cratering-related deformation mechanisms and the timing of porosity generation. Observational results are obtained by petrophysical and petrographic tech-niques, with additional data from remote geophysical surveys. The observational data are then compared to the results of numerical impact simulations, which can predict porosity distribution and microfracture orientations.
2. Data Sets
2.1. Geophysical and Petrophysical Data 2.1.1. Gravity Data
Numerous gravity surveys have been acquired at the site of the Chicxulub structure. Data used here (Figure S1b) were provided by Alan Hildebrand and Mark Pilkington (see Pilkington et al., 1994), supplemented by data acquired during the 2005 seismic surveying of the structure (see Gulick et al., 2008). Comparison between the results of numerical impact simulations and gravity data requires the determination of an aver-age gravity profile across the structure, without any regional gravity effects. Following Vermeesch et al. (2009), data were initially transformed to a cartesian coordinate system with an origin at the crater center (21.31◦N, 270.46◦E):
X = (101.71 × Longitude) + 9, 107.56, (1)
Y = (112.02 × Latitude) − 2, 386.67. (2)
The gravity data were then corrected to account for the regional variation of the Bouguer gravity field across the site. This correction was achieved by excluding all data within 100 km of the crater center, and fitting a best fit plane through the remaining regional data set. The best fit plane, representing the regional Bouguer gravity field, Z, takes the following form:
Z =227.2 + 0.04641X + 0.7371Y. (3)
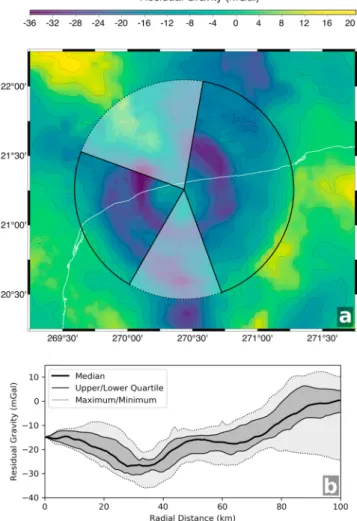
After correction of the Bouguer gravity data to account for the regional field, radial profiles were acquired in 1◦intervals. These radial profiles avoided anomalous regions of the gravity field to the south and northwest of the crater center (Figure 1a). From the 232 remaining radial profiles, the median and quartile values of the radial residual gravity field were determined with increasing radial distance (Figure 1b). The effect of removing profiles from the anomalous regions can be seen in the supporting information (Figure S2).
2.1.2. Expedition Data
IODP-ICDP Expedition 364 collected density data from cores using two different methods. First, cores were analyzed with a Geotek Multi-Sensor Core Logger (MSCL), which, alongside other physical property mea-surements, measured bulk density by gamma ray attenuation. These measurements were acquired at 2-cm intervals where, due to the machine setup, the individual resolution was 0.5 cm (see Morgan et al., 2017, for details). The second set of density data derives from He-pycnometry measurements (Quantachrome pen-tapycnometer) of discrete samples taken from the core. Samples had a diameter of 2 cm and an approximate volume of 6 cm3. Samples were taken approximately once per core section (approximately every 1.2 m), and
a total of 719 samples were measured. He-pycnometry, in addition to allowing determination of bulk density, also allows the determination of grain density and porosity (see Morgan et al., 2017, for details).
The raw expedition data are shown within the supporting information (Figure S3). Here, we have pro-cessed the data acquired during Expedition 364 in order to facilitate direct comparison between the results
Journal of Geophysical Research: Planets
10.1029/2019JE005929
Figure 1. (a) Residual Bouguer gravity map of the crater, with data contoured at 5-mGal intervals. The circle marks the
area within 100 km of the crater center; shaded sectors indicate the regions from which no gravity profiles were obtained during the calculation of (b) the average (median) radial gravity profile of the Chicxulub structure. Upper and lower quartiles, and minimum and maximum values are indicated.
of numerical simulations and the observations, and between the two observational methods. First, all data from lithologies that were not granitic target rocks were excluded; numerical simulations are not capable of modeling the injection of allochthonous impactites into the target rocks nor can they model fine-scale lithological variations between subvolcanic intrusive rocks and basement rocks. Subsequent data processing involved the calculation of a running average and standard deviation within ±6 m of each He-pycnometry sample. Averages and standard deviations were only calculated where three or more measurements were acquired within the 12-m-wide interval. Comparable measurements from the MSCL data were acquired by taking an average and standard deviation corresponding to the same depth interval for each He-pycnometry sample.
2.2. SEM Imaging and Analysis
To understand the microstructural cause of the porosity within the granitic basement rocks, 10 thin sections were prepared from samples of the recovered granitic target rocks at different depths within Hole M0077A. Backscattered electron images of the thin sections were obtained using a Zeiss Ultra Plus field emission scanning electron microscope (SEM) with the large-area imaging software and hardware package, ZEISS Atlas 5, at the Natural History Museum, London. Individual images were obtained with an accelerating voltage of 20 kV using the backscattered electron detector, a working distance of 8.0 mm, and a resolution of 748.9 nm per pixel. The Atlas 5 software was then used to stitch the individual images from a section to produce a single composite image. The total areas of each stitched image are shown in Table S1. As a consequence of the pixel size, and due to Nyquist's Theorem, the minimum width of a pore that can be accurately resolved in these images is ∼1.5 μm.
Image processing was carried out in order to analyze and quantify porosity within the thin sections. Pro-cessing was achieved using the ImageJ software package (Schindelin et al., 2012). The first stage required to analyze porosity is image thresholding. The images were deliberately acquired such that there was a signifi-cant contrast of grayscale values between pores (black), and mineral phases (gray to white). ImageJ provides several algorithms that automatically thresholds images into objects (pores) and background (solid mate-rial), resulting in an image consisting of only binary values, black for pores and white for background. Here, the default ImageJ thresholding algorithm was used, and the result then manually checked and, if required, adjusted.
Once pores were thresholded into a binary image file, porosity estimates could be made by assuming the application of the Delesse principle that the volume fraction of pores can be estimated by calculating the area fraction of pores in a 2-D image. Additionally, the orientation and aspect ratio of each pore were determined by fitting ellipses to each pore, an available function in ImageJ.
2.3. The iSALE Shock Physics Code
We simulated the formation of the Chicxulub impact structure using the iSALE shock physics code. iSALE is a multirheology, multimaterial code based on the SALE hydrocode (Amsden et al., 1980). The original code has been modified to include an elastoplastic constitutive model, fragmentation models (Melosh et al., 1992), various equations of state (Ivanov et al., 1997), a porous compaction model (Wünnemann et al., 2006), and a dilatancy model (Collins, 2014). iSALE and its precursor codes, SALES-2 (Collins et al., 2002) and SALE-B (Ivanov, 2005), have been used to simulate the formation of the Chicxulub impact structure in previous studies (Collins et al., 2002, 2008; Ivanov, 2005; Morgan et al., 2016; Rae et al., 2019). Here, we use the model parameters presented by Rae et al. (2019), where a 12-km diameter spherical impactor, using an equation of state for granite with a density of 2,630 kg/m3strikes a three-layer target at 15 km/s. The three-layer target is
composed of a 3-km layer of sedimentary rocks, represented with an equation of state for calcite, overlying a 30-km layer of crystaline basement rocks, represented with an equation of state for granite, overlying mantle, represented with an equation of state for dunite. This simulation was run at a resolution of 60 cells per projectile radius, that is, cell widths of 100 m. A complete list of the parameters used in our simulation is shown in the supporting information (Tables S2 and S3).
Predicting the gravity signal of an impact structure in a numerical model requires a dilatancy model. Dila-tancy is the tendency of granular and rocky materials to undergo volume change when subjected to shear deformation. Collins (2014) describes the dilatancy model used in iSALE. The equation used to update the distension in iSALE computational cells undergoing shear deformation is
d𝛼 dt =𝛼𝛽
d𝛾p
dt , (4)
where the first term,𝛼, is the distension, which can be defined as a function of porosity, 1
1−𝜙. The final
term of equation (4) is the plastic shear strain rate, which is determined based on velocity gradients in the cell. The second, and most important term in equation (4), is known as the dilatancy coefficient,𝛽, which describes the material's tendency to gain volume upon plastic shear strain, and is a function of pressure (p), temperature (T), and the preexisting distension (𝛼) of the material (see Table S3):
𝛽 = 𝛽max ( 𝛼 c−𝛼 𝛼c−𝛼min ) ( 1 − log(p∕10 5) log(plim∕105 ) tanh [ 𝜉 ( T Tm −1 )] . (5)
𝛽maxis a material-specific value, where large values indicate a large tendency to dilate upon shear
deforma-tion. For impact cratering simulations, and large-scale numerical simulations of rock masses, Collins (2014) suggests that𝛽maxvalues range between 0.045 and 0.180, where𝛽max= 0.045, corresponding to a Low
Geo-logical Strength Index (GSI) material, provides the best fit to the gravity and porosity data of simple craters and small complex craters. Here, that value is used to test its applicability to larger complex craters. From a simulation with this dilatancy model, it is possible to calculate the resultant gravity anomaly associ-ated with the simulassoci-ated crater including the effects of density reduction due to shear-induced dilatancy and the filling of the impact crater with postimpact sedimentary rocks. Gravity profiles are calculated by using the modeled distension field generated by iSALE; distension values are converted to a mass difference by assigning a reference density to each of the materials in the simulation, this assigned reference density can be varied independently from the reference density in the equation of state of the material. The additional
Journal of Geophysical Research: Planets
10.1029/2019JE005929
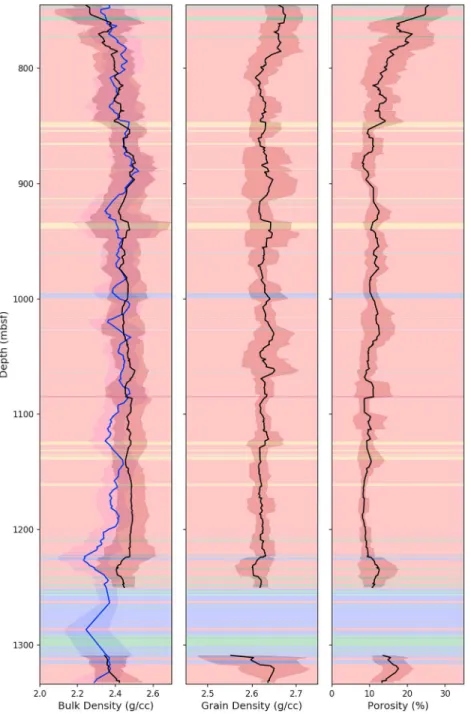
Figure 2. Processed physical property measurements of the granitic rocks recovered during Expedition 364. Black lines
indicate moving averages of discrete sample measurements within a 12-m window, while1𝜎distribution envelopes are indicated by the gray areas. The blue line and area on the bulk density profile (left) indicate the moving average and distribution envelope associated with Multi-Sensor Core Logger measurements of bulk density using gamma ray attenuation. Background colors indicate the stratigraphy of Hole M0077A (see Figure S1): pink = granitic basement, blue = suevitic breccia, green = impact melt rocks, orange = preimpact igneous dikes, and gray = Pg sedimentary rocks.
effect of low-density crater fill can then be included by filling, to whatever depth required, the modeled crater with a material of an assigned density. Finally, the effect of erosion can be considered by removing any mate-rial above a specified depth. High-density impact melt rocks are accounted for in this calculation because materials approaching or above their melting temperature have suppressed dilatancy. However, due to the simplifications of the model, preimpact vertical variations in crustal composition, and therefore density, are not accounted for. Crustal density is generally expected to increase with depth; therefore, the gravity calcu-lation is likely to underestimate the mass excess of the central uplift and overestimate the excess outside of the central uplift.
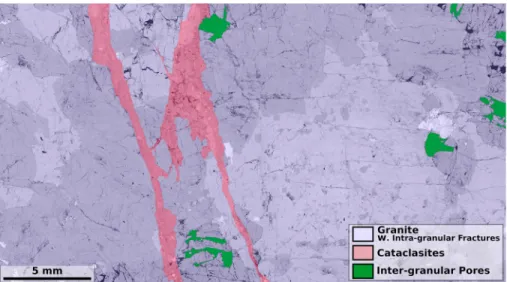
Figure 3. Whole thin-section backscattered electron scanning electron microscope image of Sample
364-77-A-276-R-1-17-19 (1,249.52 m below sea floor) with color overlay to distinguish between the three types of porosity. The largest region, highlighted in pale blue, is dominated by intragranular fractures. The region highlighted in red indicates a cataclasite network. Finally, the pores highlighted in green are the large intergranular pores, almost certainly produced during sectioning.
3. Results
3.1. Geophysical and Petrophysical Data
The processed residual 2-D gravity profile (Figure 1b) possesses a local gravity high in the crater center of −15 mGal. At 30- to 40-km radial distance, a gravity low of approximately −25 mGal can be observed, beyond which the gravity signal increases to match the regional gravity field. Beyond 80 km, the interquartile range of the radial gravity signal increases due to thickness variations of the Mesozoic and Cenozoic sedimentary rocks at various azimuths. The region to the northeast of the crater contains a thicker sequence of sedi-mentary rocks and therefore has a more negative residual gravity signal. The features of the average gravity profile are broadly consistent with the features seen in previously published individual profiles and average profiles (e.g., Sharpton et al., 1993). Additionally, the total mass deficit associated with the Chicxulub impact structure can be calculated from the gravity anomaly by applying Gauss's theorem (see Campos-Enriquez et al., 1998). The average gravity profile obtained here suggests a total mass deficit of 9.15 × 10¹⁵kg. Upper
and lower bounds on the deficit can be made using the upper and lower quartile profiles, which suggest mass deficits between 4.90 × 10¹⁵and 1.25 × 10¹⁶kg, respectively. These values are consistent with previous
estimates of the Chicxulub mass deficit (Campos-Enriquez et al., 1998).
The low seismic velocities of the Chicxulub peak ring, combined with the large gravity low slightly within the peak ring, had suggested, prior to drilling, that the Chicxulub peak ring is composed of unusually low density rocks (Morgan et al., 2000). Results from Expedition 364 have shown that the peak ring is composed of uplifted crystalline target rocks that possess unusually low densities and high porosities compared to typ-ical crystalline basement rocks (Christeson et al., 2018). Processed expedition data are shown in Figure 2. The target rocks possess consistent and typical grain densities for granite, averaging 2,628 ± 39 kg/m3(1𝜎),
but have remarkably high porosities. The average porosity of the granitic target rocks is 11.5 ± 4.7%, result-ing in average bulk densities of 2,444 ± 75 kg/m3; additionally, the raw porosity measurements show that
the granitic target rocks have a pervasive baseline porosity of approximately 8%, where few samples pos-sess less porosity, but where local excursions to higher porosities occur. There is some heterogeneity of porosity and bulk density with depth in the recovered core: in the upper 100 m, average porosities increase beyond 20% and the variability increases up to 𝜎 = 8.1%. Additionally, porosities within granitic rocks beneath 1,225-mbsf increase from<10% to >10%. Despite some discrepancy between bulk density measure-ments by He-pycnometry and the independently measured bulk density by gamma ray attenuation using the MSCL, particularly from depths below 1,075 mbsf, the 1𝜎 envelopes of both measurements always overlap, indicating full consistency between the data sets.
Journal of Geophysical Research: Planets
10.1029/2019JE005929
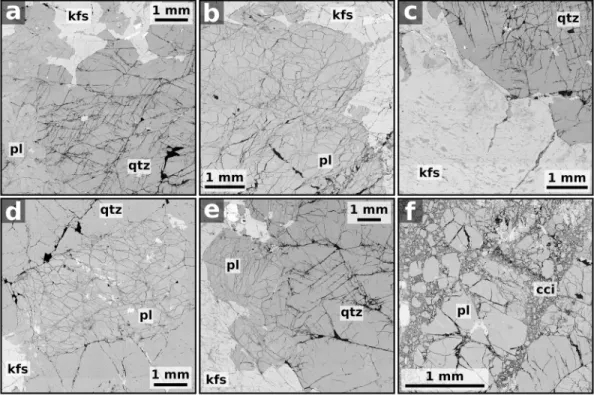
Figure 4. Intragranular fractures within granitic minerals of the Chicxulub peak ring, qtz = quartz, kfs = alkali
feldspar, pl = plagioclase, and cci = cataclasite. (a) Strongly dilated microfracture network in quartz. (b) Poorly dilated, diverging and converging microfracture network in plagioclase. (c) Poorly fractured alkali feldspar crystal contrasted with heavily fractured quartz. (d) High-density, poorly dilated, diverging and converging fracture network in a plagioclase grain surrounded by quartz with low-density fractures. (e) Fractured quartz, plagioclase, and alkali feldspar with distinctly different microfracture patterns. (f) Cataclasite partially incorporating a prefractured plagioclase grain.
3.2. SEM Imaging and Analysis
Inspection of the SEM images shows that the largest contributor to the total porosity of the granitic target rocks is by intragranular fracturing, with additional contribution from cataclasites and large intergranular pores (Figure 3). Cataclasites are easily distinguished by their finer grain sizes, increased grain angularity, and increased porosity relative to their host material, while large intergranular pores are defined by their anomalous sizes compared to the other sources of porosity (see supporting information Figures S4–S13). Across all the thin sections, the average fraction of the porosity contributed by intragranular fractures is 0.55, while the average fraction of porosity contributed by intergranular pores and cataclasites are 0.24 and 0.21, respectively.
Excluding the large intergranular pores and cataclasites, the average porosity of the intragranularly fractured granites is 6.4%. This intragranular fracturing is distributed heterogeneously throughout the thin sections and is primarily dependent upon the mineral that is fractured (Figure 4). The three major rock-forming minerals within the granites are alkali feldspar, quartz, and plagioclase feldspar. Quartz grains are pervaded by planar fracture (PF) sets, which rarely span the entire grain and which occasionally have feather feature lamellae (Figures 4a and 4e; Poelchau & Kenkmann, 2011). Additionally, the quartz grains possess occa-sional individual shear fractures on planar surfaces with observable submillimeter displacements, and rare nonplanar fractures, which typically contain a gouge of angular to subangular quartz fragments. Compared to the feldspars, the quartz grains are more porous. Plagioclase feldspar, while also pervasively microfrac-tured, possesses a distinctly different fracture pattern to the quartz grains. The microfractures are typically closer spaced than in quartz from the same sample, are rarely planar, and typically branch and converge into other fractures (Figures 4b and 4d). While the plagioclase crystals often have higher fracture densities than the quartz grains, the total dilation on each intragranular plagioclase fracture is significantly smaller than the intragranular fractures in quartz. Compared to the quartz and plagioclase feldspar within the granitic rocks from Hole M0077A, alkali feldspar is remarkably unfractured (Figure 4c), possessing only widely spaced nonplanar fractures.
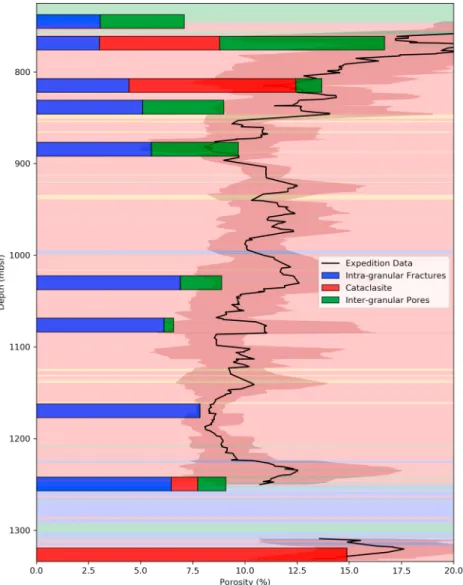
Figure 5. Porosities determined by scanning electron microscope image analysis, subdivided by the type of porosity:
intragranular fractures, intergranular pores, and cataclasites. Processed expedition data of porosity are shown for comparison. The black line is the moving average of the discrete sample measurements within a 12-m window; the gray envelope shows±1𝜎of the data within the window.
Additional porosity in the granitic rocks is produced by cataclasites. These regions of the thin sections have extremely high porosities. Across the four thin sections that contain cataclasites, the average porosity in the cataclasite regions is 15.8%. Nevertheless, the cataclasites are only a small area of the total rock mass (20.0% of the total imaged area) and thus contribute only a small fraction of the total porosity of the thin sections. The SEM images show examples of cross-cutting relationships between the cataclasites and grains with intragranular fractures (Figure 4f) that show the cataclasites formed after pervasive fracturing of the target rocks, also described by Riller et al. (2018) . Additionally, Riller et al. (2018) have shown that the cataclasites are truncated by later deformation events associated with crater formation.
The large intergranular pores observed in the samples are almost certainly not representative of the in situ porosity of the granitic target rocks. Their extreme sizes within the pore size distributions (see supporting information Figures S4–S13) of each sample indicate that they are mostly nonnatural pores, that is, pro-duced during sample preparation. Nevertheless, the possibility remains that thin sections are too small to encompass the full pore size distribution of these rocks. Regardless of their origin, the total contribution of these large intergranular pores to the total porosity is equal to the average contribution from cataclasites and significantly less than the contribution from intragranular fractures. These pores can only be found in 4 of the 10 thin sections, all deriving from near to the top of the hole.
Journal of Geophysical Research: Planets
10.1029/2019JE005929
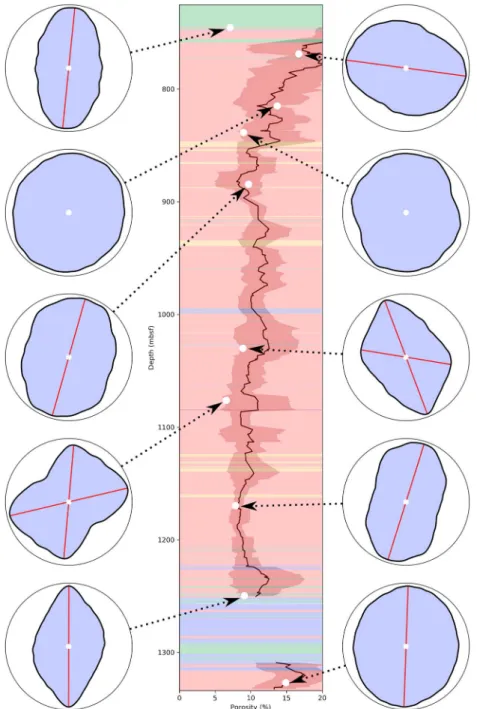
Figure 6. Pore orientation-frequency distributions for each of the analyzed thin sections. Orientations are measured as
apparent dip, where upwards indicates a vertical apparent dip (i.e., 90◦), while across indicates a horizontal apparent dip (i.e., 0◦). Red lines indicate the mode(s) of the distributions. The central column shows the lithology, processed porosity measurements from Expedition 364, and, as white points, the porosities measured by scanning electron microscope image analysis.
Total porosity measurements obtained from SEM image analysis, subdivided by the source of porosity, are shown in Figure 5. In general, the estimations from SEM image analysis are consistent with the measure-ments made by He-pycnometry. All results from SEM analysis, excluding the uppermost thin section, fall within the 1𝜎 envelope of the He-pycnometry porosity measurements. However, most of the SEM-derived porosities are offset to lower values compared to the mean measurement from He-pycnometry, and this would be exaggerated by excluding the large intergranular pores, many of which are due to sample prepa-ration. Potential errors associated with calculating porosity from SEM images include: lack of resolution to quantify pores smaller than ∼1.5 μm, large pores distributed on a scale larger than a thin section (2–3 cm), porosity anisotropy, and sample preparation artifacts.
Table 1
Pore Orientation Distribution Descriptions by Sample
Sample name Depth (mbsf) Distribution shape Apparent dip(s) (◦) Relative peak height
364-77-A-095-R-3-27-29 745.16 Unimodal 84.2 Strong
364-77-A-104-R-1-24-26 768.59 Unimodal 7.7 Moderate
364-77-A-121-R-1-75-77 814.85 Nonmodal — —
364-77-A-132-R-1-22-24 838.45 Nonmodal — —
364-77-A-150-R-1-53-55 884.43 Unimodal 74.3 Weak
364-77-A-204-R-1-07-09 1,030.00 Bimodal 69.4 and 9.26 Strong and moderate
364-77-A-219-R-1-22-24 1,076.15 Bimodal 13.3 and 85.0 Strong and strong
364-77-A-250-R-1-41-43 1,169.71 Unimodal 72.7 Strong
364-77-A-276-R-1-17-19 1,249.52 Unimodal 89.9 Strong
364-77-A-301-R-1-30-32 1,326.89 Unimodal 88.0 Very weak
Note.Most thin sections have unimodal or bimodal distributions. A qualitative indication of the relative peak height(s) is indicated in notes. The dominant overall orientation of pores in these samples is at apparent dips>69.4◦, with a subordinate orientation at apparent dips<3.3◦. mbsf = meters below sea floor.
Quartz develops a number of unique deformation features over a range of shock wave pressures (French & Koeberl, 2010). One of these features is PFs, which can occur in one or multiple orientations. The large abundance of PF sets in quartz from Hole M0077A, together with the interconnectedness of the intragran-ular fractures, suggests that most of the intragranintragran-ular fracturing is related to deformation during shock (Figures 4a, 4c, and 4e). The partial disaggregation of some grains of quartz and plagioclase feldspar along intragranular fractures into cataclasites and the matrix of monomict granitic breccias indicates that the formation of cataclasites and brecciation occurred after the formation of intragranular fractures (Figure 4f). The orientation of pores within the thin sections is generally anisotropic (Figure 6). Six thin sections have unimodal pore orientation-frequency distributions, while two more thin sections have a bimodal distribu-tion (Table 1). Comparing these distribudistribu-tions to the images they derive from (Figure S14) indicates that the cause of the high frequency orientations is the orientation of PFs in quartz.
Figure 7. (a) Porosity distribution at the end of the Chicxulub simulation. (b) The modeled gravity anomaly (blue),
based on setting the assigned reference density in the gravity calculation to the values in Table 2, compared to the observed gravity signal (black) of the Chicxulub structure (Figure 1b). (c) The modeled porosity of Hole M0077A (blue) compared with porosity measurements (black) made during International Ocean Discovery Program and International Continental scientific Drilling Program Expedition 364 (Figure 2).
Journal of Geophysical Research: Planets
10.1029/2019JE005929
Table 2
Range of Target Material Densities Used in Gravity Calculation
Material Selected reference density (kg/m3) Reported density (kg/m3) Reference
Preimpact sedimentary rock 2,650±50 2,477–2,938 Elbra and Pesonen (2011)
Crystalline basement 2,628±39 2,628±39 This study and Christeson et al. (2018)
Mantle 3,320 3,320 Benz et al. (1989)
Postimpact sedimentary rocka 2,200±50 1,960–2,470 Christeson et al. (2018)
Bouguer density 2,670 2,670 Tanner et al. (1988)
aThe thickness of postimpact sedimentary rocks above the peak ring was maintained at 650 m.
3.3. Numerical Simulations
Our numerical simulations of the Chicxulub impact event follow a model of the formation of peak rings, sometimes called the Dynamic Collapse Model, that has been developed over a number of decades (Collins et al., 2002; Grieve et al., 1981; Kring et al., 2016; Morgan et al., 2016). Within this model, and our simulation, the formation of a peak ring results from the overheightening of a central uplift, and its subsequent lateral emplacement over the collapsed transient cavity rim (Figure S15). The simulation presented here, from Rae et al. (2019), allows predictions of the distribution and timing of porosity to be made. Porosity generation in rocks during complex crater collapse would be expected throughout the crater due to shear failure. The final distribution of modeled porosity caused by this dilatancy is shown in Figure 7a.
From the final simulated distribution of porosity in the structure, it is possible to produce a vertical profile of porosity in the peak ring that can be compared to observational results (Figure 7c). Using𝛽max= 0.045,
these results predict that the porosity of the peak ring material should be approximately 7 ± 2%. Uncertainty in the exact comparative location between the model and the drilled core results in the ±2% error. Overall, the modeled porosity closely matches the baseline values of porosity in the recovered core, with notable excursions within the top 200 m, from 300–350 m, and at 700 m within the peak ring. These excursions from the model may be caused by postimpact hydrothermal dissolution, and/or localization of strain that is not captured by the model.
In addition to the simulated porosity in the peak ring, a set of simulated Bouguer gravity profiles of the crater were calculated from the iSALE simulation and are compared to the observed local Bouguer gravity anomaly (Figure 7b). The range in the displayed profiles results from propagating the uncertainties in the assigned reference densities for the materials in the model (Table 2).
One important problem with the calculation of the overall gravity profile comes from the filling of the basin with postimpact sedimentary rocks. In the model, the top of the peak ring is at 1,050-m depth, while in the real crater, the top of the peak ring is at 618 mbsf. The cause of this discrepancy could be due to postimpact relaxation, or inaccuracies of the mechanism of transient weakening. To ensure that the mass deficit from the postimpact sedimentary rocks is consistent with observations, one of two changes could be made: (1) The thickness of the sediments in the model could be maintained, but the reference density of the sedimen-tary infill increased such that the mass deficit remains constant, or (2) the reference density of postimpact sediments could be maintained at reasonable values but the thickness of the sedimentary infill reduced such that only 600 m of sedimentary rock overlie the peak ring. Here, we adopt the latter approach because it is more useful for predicting the gravity structure around the crater center. This approach will result in the model predicting a smaller magnitude anomaly in the terrace zone compared to the observational data due to the lack of low-density sedimentary rock at those radial distances.
The modeled gravity signal possesses a mass deficit in the range of 5.81–9.25 × 10¹⁵kg, considering the
uncertainties presented in Table 2. This range includes the value of the mass deficit associated with the median gravity signal, 9.15 × 10¹⁵kg, and is fully within the upper and lower quartile gravity signals. The
maximum modeled anomaly at the crater center is −9 to −28 mGal, consistent with the observed value of ∼ −15 mGal. Additionally, the maximum anomaly in the modeled profile occurs between 28- and 40-km radial distance and has a value of −22 to −34 mGal, consistent with the observed −26 mGal minimum at 35-km radial distance. Beyond the peak ring, within the annular trough and the terrace zone of the crater, the fit between the modeled and observed gravity profiles is poorer. This misfit can be explained primarily by the oversimplifications associated with modeling the postimpact sedimentary fill as a constant density
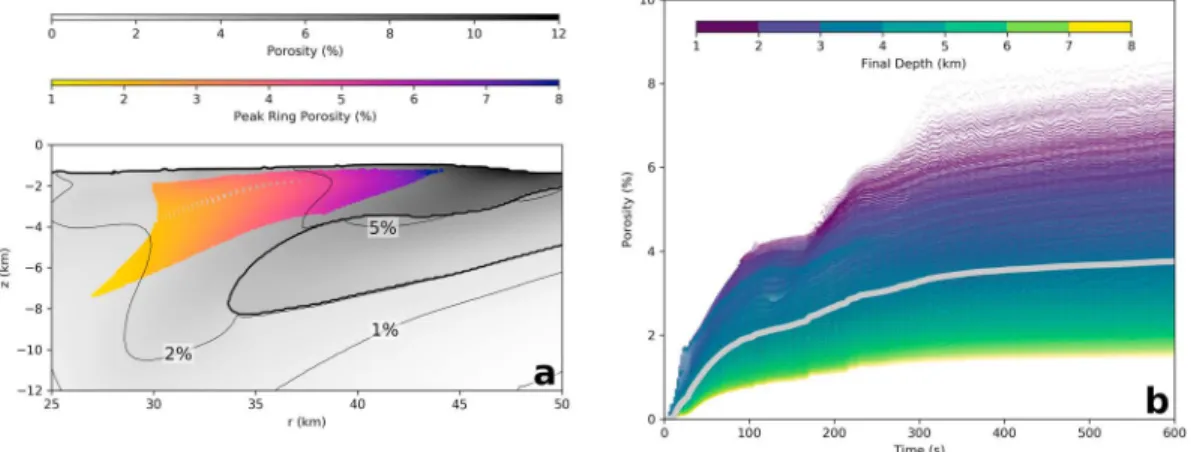
Figure 8. The distribution of porosity within the Chicxulub peak ring, and the timing of its generation. (a) Porosity
distribution at the final time step, focused upon the peak ring. Slumped sedimentary rocks beneath the peak ring are distinguished from crystalline rocks by a thick black line, while thin black lines show contours of porosity. Peak ring material is highlighted by the colored points. (b) Porosity of peak ring material through time, colored by the material's final depth. The gray line is a mass-weighted average of porosity in the peak ring through time.
material. The gravity anomaly is likely to be underestimated between 45- and 55-km radial distance, since deep sedimentary rocks in the annular trough adjacent to the peak ring are likely to have higher densities, as suggested by their increase in velocity with depth (Morgan et al., 2011). The overestimation of the observed profile from 55- to 75-km radial distance occurs, as previously stated, due to the lack of sedimentary infill at these radial distances. Additional causes of discrepancy between the model and observation may include: postimpact compaction, hydrothermal precipitation and/or dissolution, or a lack of initial porosity in the modeled preimpact sedimentary rocks.
4. Discussion
The rocks of the Chicxulub peak ring, with porosities of 11.5 ± 4.7%, have low densities compared to typical crystalline basement rocks, which usually possess negligible porosity. Seismic velocities in the basement rocks of the region (Christeson et al., 2001) indicate that the preimpact porosity of the crystalline target rocks was small,≪1%. Thus, compared to shocked target rocks in other craters (Pilkington & Grieve, 1992), the target rocks of the Chicxulub peak ring have among the highest impact-generated porosities of any impact structure (Table S4), that is, almost all of the measured porosity in the crystalline rocks of the Chicxulub peak ring was produced by impact processes or postimpact alteration. We attribute the remarkably high porosity to the relative size and age of the Chicxulub impact, sampling depth within the structure, and the complex deformation path that peak ring materials follow during dynamic collapse (Rae et al., 2019). The main contributor to the porosity of target rocks in the Chicxulub impact structure is shock-induced microfracturing. Additional porosity is contributed from cataclasites, which are extremely porous but volu-metrically small, and, possibly, large intergranular pores. The origin of large intergranular pores is almost certainly due to preparation-induced damage. Nevertheless, large intergranular pores are systematically prevalent near the top of the granitic rock section, coinciding with the largest deviation between the modeled porosity and observed porosity.
Most peak ring material never experiences tensile stress regimes during cratering (Rae et al., 2019). Conse-quently, the shear-induced dilatancy model used here should simulate the production of all styles of primary microporosity observed within the peak ring rocks. Secondary porosity may be generated by processes such as hydrothermal dissolution. The observational evidence shows that the porosity of the peak ring rocks is pri-marily hosted in intragranular fractures formed by shock metamorphism. In contrast, the dilatancy model predicts that very minimal amounts of porosity are produced during the passage of the shock wave and rarefaction. Instead, it predicts that, for the shallowest rocks in the peak ring, porosity is generated in two distinct phases of shear deformation, the first during transient cavity formation and rim collapse (0–100 s) and the second during central peak formation and collapse (175–350 s; Figure 8b). Deeper material within the peak ring structure experiences only one distinct phase of shear-induced dilatancy, which occurs more gradually through transient cavity formation and collapse. One explanation for the discrepancy between the
Journal of Geophysical Research: Planets
10.1029/2019JE005929
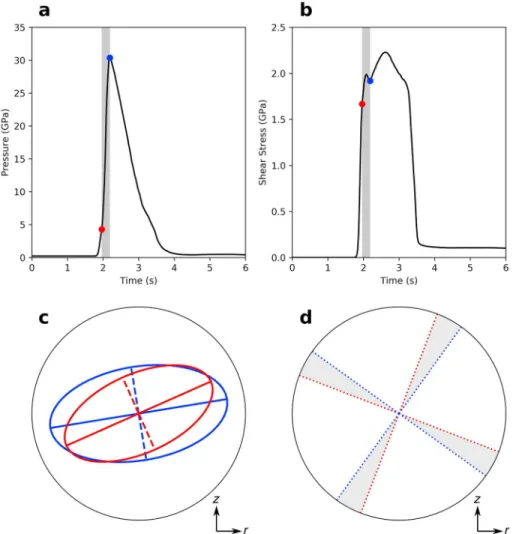
Figure 9. Fracture formation during shock. (a and b) Pressure and maximum resolvable shear stress, respectively,
during shock. PF formation is expected to occur between the time at which the Hugoniot Elastic Limit is exceeded (red), and the time of maximum pressure (blue). (c) Cross sections of the Lamé deviatoric stress ellipsoid are shown at the times corresponding to the time points. Solid lines within the ellipses indicate the orientation and relative magnitude of the maximum deviatoric principle stress; dashed lines within the ellipses indicate the orientation and relative magnitude of the minimum deviatoric principle stress. (d) PF formation is expected at 45◦to the orientation of 𝜎1; therefore, PFs are expected to form at orientations within the gray areas. (Note that the highlighted gray areas take
into account the rotation of the tracer particle by roughly 1◦anticlockwise during shock.) PF = planar fracture.
observation of shock-induced microfractures dominating porosity and the model prediction of later poros-ity generation by shear is that fractures form early, during high-pressure shock, without any porosporos-ity. Those fractures must then open during later shear-dominated phases of crater deformation. However, it is also pos-sible that the shear-induced dilatancy model used here is an oversimplification of the process that generates porosity in para-autochthonous impactites. A process that may involve two distinct stages of porosity gener-ation; first, a dynamic effect of fracturing during shock and the second due to true shear-induced dilatancy of a predamaged material. If this is the case, the GSI parameters used here for shear-induced dilatancy are too large.
The ability to accurately predict the porosity distribution of complex craters is important for understand-ing the gravity signal of large impact structures. Here, we have obtained a reasonable fit to the observed gravity signature of the Chicxulub structure, a large complex impact crater, using a numerical model that accounts for porosity generation/density reduction by dilatancy alone. Discrepancies between the modeled and observed gravity signals may be due to pore space compaction or displacement of preexisting crustal density variations not captured by the model. Additionally, changes to acoustic fluidization parameters may change the location of down-faulted sedimentary rocks in the collapsed transient cavity rim that under-lies the peak ring and therefore affect the modeled gravity signature. Despite this, the overall consistency
between the gravity profiles and porosities between observation and model reinforces the significance of dilatancy on subcrater structure and deformation. Additionally, our results support the recommendation by Collins (2014) that low GSI dilatancy parameters should be used for impact cratering simulations.
4.1. Orientation of Microfractures
In addition to the consistency between porosity and gravity measurements with the results of numerical impact simulations, it is also possible to predict the orientation of shock-induced microfractures in numer-ical impact simulations (Rae et al., 2019). Predicting the orientation of microfractures during cratering requires the assumption of two well-accepted concepts of shock physics and rock mechanics. First, the ori-entation of fractures during rock failure is predicted by the canonical model of Mohr-Coulomb rock failure (Anderson, 1905). In low-pressure regimes, rock failure is typically expected at 30◦to the orientation of𝜎1,
depending on the coefficient of internal friction. However, in a high-pressure regime, greater than the Hugo-niot Elastic Limit, the coefficient of internal friction approaches 0, and consequently, the angle of failure approaches 45◦to𝜎1. Second, the formation of PFs during shock occurs during shock loading, that is, once the Hugoniot Elastic Limit is exceeded but before peak pressure conditions are reached (French & Koeberl, 2010; Poelchau & Kenkmann, 2011). Support for this assertion derives from the observation that PFs com-monly separate domains within grains that Planar Deformation Features, which are sensitive to the peak pressure of the shock wave, do not cross. Using these concepts, and by obtaining the orientations and magni-tudes of deviatoric principal stresses, following the methodology described by Rae et al. (2019), it is possible to predict shock fracture orientations within target material during shock (Figure 9).
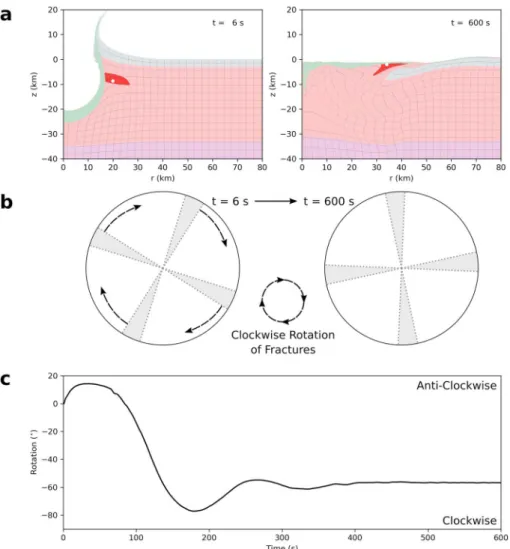
During crater excavation and modification, and to a much lesser extent, during shock, material is expected to rotate from its initial orientation. The orientation of material in numerical simulations can be tracked by calculation of infinitesimal strain tensors (see Rae et al., 2019). Here, the Dynamic Collapse Model has been used, and a single tracer selected to represent the recovered core material. This particle rotates by approximately 60◦clockwise during cratering (Figure 10c). Selecting tracers from deeper or at increasing radial distances within the peak ring material causes a systematic increase in the total clockwise rotation during cratering by up to an additional 30◦. Consequently, the final orientation of shock-related fractures, as predicted by the model, is at concentric strikes, dipping at 88◦inward—78◦outward, and the conjugate set at 12◦inward—2◦outward (Figure 10b). The observed orientations of microfractures within the shocked granitic rock samples can be subdivided into one set of steep apparent dips (69.4–89.9◦) and a second set with shallow apparent dips (7.7–13.3◦). Despite the observations only being capable of determining apparent dip, without any strike information, the modeled orientations are remarkably consistent with the observed micro-fracture orientations.
This result indicates several important points. First, that the orientation at which shock microfractures, that is, PFs, forms may be primarily controlled by the orientation of principal stresses during shock. The granitic rocks from Hole M0077A have minimal to no grain preferred orientation (Morgan et al., 2017; Riller et al., 2018); consequently, the preferred orientation of shock microfractures across a whole thin section of randomly oriented grains indicates that crystallographic orientation may not have primary control of the orientation of fractures. PFs are known to form on rational crystallographic planes (French & Koeberl, 2010); however, it is likely that the specific orientation of the plane that is activated during shock may be controlled by stress conditions.
Second, it is clear that a large rotation of the peak ring material is required between shock and the final emplacement of the peak ring. Regardless of the physical mechanism by which crater collapse occurs, the orientation of fractures due to shock will always be at moderate dip angles (approximately 45◦) immediately after shock. Achieving conjugate sets of planar fractures in subvertical and subhorizontal respective orienta-tions requires either a clockwise rotation of material by approximately 60–70◦or an anticlockwise rotation of 20–30◦. The Dynamic Collapse Model of peak ring formation precisely predicts the large clockwise rotation required.
Finally, stress-induced fractures significantly affect the permeability anisotropy of rocks. Canonically, the maximum permeability direction of a fault rock is along the intersection of minor faults, that is, parallel to the orientation of the𝜎2direction that produced the fractures (Sibson, 2000). Combining this with the fact
that shock microfracturing produces the dominant pore fabric in these peak ring rocks leads to possibil-ity that numerical impact simulations may be able to predict the permeabilpossibil-ity distribution and anisotropy within impact craters, a critical parameter of hydrothermal models of impact structures.
Journal of Geophysical Research: Planets
10.1029/2019JE005929
Figure 10. Rotation of microfractures during modification. (a) Arrangement of the crater after shock passage and
crater modification. Peak ring material is highlighted by the red material while the individual tracer being tracked is highlighted by the white point. (b) Orientation of shock microfractures at the time steps indicated. (c) Cumulative orientation of the selected tracer particle throughout all time steps of the simulation.
5. Conclusions
Here, we have shown that the unusually high porosities of the Chicxulub peak ring reported by Morgan et al. (2016, 2017) and Christeson et al. (2018) are caused by pervasive, shock-induced microfracturing. The present-day orientation of the shock microfractures are consistent with predictions of the Dynamic Collapse Model of peak ring formation regarding the orientation of principal stresses during shock and the subse-quent deformation of material during crater collapse. An important implication of this work is that PFs in quartz could be sensitive to the orientation of principal stresses during shock. In turn, this suggests that porosity and permeability is likely to be anisotropic throughout craters. Finally, the results presented in this contribution demonstrate that the dilatancy model of Collins (2014) produces predictions of the porosities of peak ring rocks and the gravity anomaly across the entire structure that are remarkably consistent with petrophysical and remote geophysical observations. This provides a simple gravity model of the Chicxulub structure that accounts for all of the important processes that generate mass deficits within craters.
Appendix A: Expedition 364 Scientists
S. P. S. Gulick1,2, J. V. Morgan3, E. Chenot4, G. L. Christeson2, P. Claeys5, C. S. Cockell6, M. J. L. Coolen7,
L. Ferrière8, C. Gebhardt9, K. Goto10, S. Green11, H. Jones12, D. A. Kring13, J. Lofi4, C. M. Lowery2, R.
Rebolledo-Vieyra20, U. Riller21, H. Sato22, J. Smit23, S. M. Tikoo24, N. Tomioka25, J. Urrutia-Fucugauchi15,
M. T. Whalen26, A. Wittmann27, L. Xiao28, K. E. Yamaguchi29,30.
1Department of Geological Sciences, Jackson School of Geosciences, University of Texas at Austin,
Austin, TX, USA.2Institute for Geophysics, Jackson School of Geosciences, University of Texas at Austin,
Austin, TX, USA.3Department of Earth Science and Engineering, Imperial College London, London, UK. 4Géosciences Montpellier, Université de Montpellier, Montpellier, France.5Analytical, Environmental and
Geo-Chemistry, Vrije Universiteit Brussel, Brussels, Belgium.6Centre for Astrobiology, School of Physics
and Astronomy, University of Edinburgh, Edinburgh, UK.7Western Australia Organic and Isotope
Geo-chemistry Centre (WA-OIGC), School of Earth and Planetary Sciences, Curtin University, Bentley, WA 6102, Australia.8Natural History Museum, Vienna, Austria.9Alfred Wegener Institute Helmholtz Centre of Polar
and Marine Research, Bremerhaven, Germany.10Department of Earth and Planetary Science, University of
Tokyo, Tokyo, Japan.11British Geological Survey, Edinburgh, UK.12Department of Geosciences,
Pennsylva-nia State University, University Park, PA, USA.13Lunar and Planetary Institute, Houston, TX, USA.14Groupe
de Physico-Chimie de l'Atmosphère, L'Institut de Chimie et Procédés pour l'Énergie, l'Environnement et la Santé (ICPEES), Université de Strasbourg, Strasbourg, France.15Instituto de Geofísica, Universidad
Nacional Autónoma De México, Ciudad De México, Mexico. 16School of Geographical and Earth
Sci-ences, University of Glasgow, Glasgow, UK.17Argon Isotope Facility, Scottish Universities Environmental
Research Centre, East Kilbride, UK.18Department of Geology, University of Freiburg, Freiburg, Germany. 19Department of Geology and Geophysics, University of Utah, Salt Lake City, UT, USA.20Independent
con-sultant, Cancun, Mexico.21Institut für Geologie, Universität Hamburg, Hamburg, Germany.22Japan Agency
for Marine-Earth Science and Technology, Kanagawa, Japan.23Faculty of Earth and Life Sciences (FALW),
Vrije Universiteit Amsterdam, Amsterdam, Netherlands.24Earth and Planetary Sciences, Rutgers
Univer-sity, New Brunswick, NJ, USA.25Kochi Institute for Core Sample Research, Japan Agency for Marine-Earth
Science and Technology, Kochi, Japan.26Department of Geosciences, University of Alaska Fairbanks,
Fair-banks, AK, USA.27Eyring Materials Center, Arizona State University, Tempe, AZ, USA.28School of Earth
Sciences, Planetary Science Institute, China University of Geosciences, Wuhan, China.29Department of
Chemistry, Toho University, Chiba, Japan.30NASA Astrobiology Institute.
Appendix B: Author Contributions
The work in this contribution was carried out during the PhD research of A. S. P. R. The PhD project was planned and supervised by J. V. M., G. S. C., R. A. F. G., and G. R. O. SEM images were acquired by A. S. P. R. and T. S. J. Le carried out some of the image processing and analysis as part of a Masters project supervised by A. S. P. R. and J. V. M. A. S. P. R., G. C., C. G., and J. Lo contributed to the acquisition of petrophysi-cal data during IODP-ICDP Expedition 364. A. S. P. R. carried out the iSALE numeripetrophysi-cal simulations and postprocessing of the results. A. S. P. R. wrote the first draft, and all authors contributed to subsequent drafts.
Appendix C: Data Availability
Data from IODP-ICDP Expedition 364 is available upon request from http://iodp.pangaea.de/ website. Grav-ity data, courtesy of Alan Hildebrand and Mark Pilkington, are available as supporting information data file, along with the gravity profile determined in this study. iSALE is not a publicly available code; however, depending on usage terms, access is available upon request of the lead developers. Details of iSALE access are available at www.isale-code.de.
References
Abramov, O., & Kring, D. (2007). Numerical modeling of impact-induced hydrothermal activity at the Chicxulub crater. Meteoritics &
Planetary Science, 42(1), 93–112. https://doi.org/10.1111/j.1945-5100.2007.tb00220.x
Amsden, A. A., Ruppel, H. M., & Hirt, C. W. (1980). SALE: A simplified ALE computer program for fluid flow at all speeds (LA-8095). New Mexico: Los Alamos National Laboratories.
Anderson, E. M. (1905). The dynamics of faulting. Transactions of the Edinburgh Geological Society, 8(3), 387–402 en. https://doi.org/10. 1144/transed.8.3.387
Benz, W., Cameron, A., & Melosh, H. (1989). The origin of the Moon and the single-impact hypothesis III. Icarus, 81(1), 113–131. https://doi.org/10.1016/0019-1035(89)90129-2
Campos-Enriquez, J., MoralesRodríguez, H., DomínguezMendez, F., & Birch, F. (1998). Gausss theorem, mass deficiency at Chicxulub crater (Yucatan, Mexico), and the extinction of the dinosaurs. Geophysics, 63(5), 1585–1594. https://doi.org/10.1190/1.1444455
Acknowledgments
We gratefully acknowledge the developers of iSALE, including Kai Wünnemann, Dirk Elbeshausen, Boris Ivanov, and Jay Melosh. Some plots in this work were created with the pySALEPlot tool written by Tom Davison. We gratefully acknowledge two anonymous reviewers and the Associate Editor, Zibi Turtle, for their constructive criticism. The Chicxulub drilling expedition was funded by the IODP
as Expedition 364 with cofunding from the ICDP. Expedition 364 was implemented by ECORD, with contributions and logistical support from the Yucatán state government and UNAM. The work presented here was funded by STFC (ST/N000803/1) and NERC (NE/P011195/1), additional support was received from NSF-OCE-1737351. This is UTIG Contribution 3461.
Journal of Geophysical Research: Planets
10.1029/2019JE005929
Christeson, G. L., Collins, G. S., Morgan, J. V., Gulick, S. P. S., Barton, P. J., & Warner, M. R. (2009). Mantle deformation beneath the Chicxulub impact crater. Earth and Planetary Science Letters, 284(12), 249–257. https://doi.org/10.1016/j.epsl.2009.04.033
Christeson, G. L., Gulick, S. P. S., Morgan, J. V., Gebhardt, C., Le Ber, E., Lofi, J., et al. (2018). Extraordinary Rocks of the Chicxulub Crater Peak-ring: Physical Property Measurements from IODP/ICDP Expedition 364. Earth and Planetary Science Letters, 495, 1–11. Christeson, G. L., Nakamura, Y., Buffler, R. T., Morgan, J., & Warner, M. (2001). Deep crustal structure of the Chicxulub impact crater.
Journal of Geophysical Research, 106(B10), 21751–21769.
Cockell, C. S. (2006). The origin and emergence of life under impact bombardment. Philosophical Transactions of the Royal Society of London
B: Biological Sciences, 361(1474), 1845–1856 en. https://doi.org/10.1098/rstb.2006.1908
Collins, G. S. (2014). Numerical simulations of impact crater formation with dilatancy. Journal of Geophysical Research: Planets, 119, 2600–2619. https://doi.org/10.1002/2014JE004708
Collins, G. S., Melosh, H. J., Morgan, J. V., & Warner, M. R. (2002). Hydrocode simulations of Chicxulub crater collapse and peak-ring formation. Icarus, 157(1), 24–33. https://doi.org/10.1006/icar.2002.6822
Collins, G. S., Morgan, J. V., Barton, P., Christeson, G. L., Gulick, S. P. S., Urrutia, J., et al. (2008). Dynamic modeling suggests terrace zone asymmetry in the Chicxulub crater is caused by target heterogeneity. Earth and Planetary Science Letters, 270(34), 221–230. https://doi. org/10.1016/j.epsl.2008.03.032
Elbra, T., & Pesonen, L. (2011). Physical properties of the Yaxcopoil-1 deep drill core, Chicxulub impact structure, Mexico. Meteoritics &
Planetary Science, 46(11), 1640–1652. https://doi.org/10.1111/j.1945-5100.2011.01253.x
Espindola, J. M., Mena, M., de La Fuente, M., & Campos-Enriquez, J. O. (1995). A model of the Chicxulub impact structure (Yucatan, Mexico) based on its gravity and magnetic signatures. Physics of the Earth and Planetary Interiors, 92(3), 271–278. https://doi.org/10. 1016/0031-9201(95)03022-6
French, B. M., & Koeberl, C. (2010). The convincing identification of terrestrial meteorite impact structures: What works, what doesn't, and why. Earth-Science Reviews, 98(12), 123–170. https://doi.org/10.1016/j.earscirev.2009.10.009
Grieve, R. A. F. (2005). Economic natural resource deposits at terrestrial impact structures. Geological Society, London, Special Publications,
248(1), 1–29 en. https://doi.org/10.1144/GSL.SP.2005.248.01.01
Grieve, R. A. F., Robertson, P. B., & Dence, M. R. (1981). Constraints on the formation of ring impact structures, based on terrestrial data,
Multi-ring basins: Formation and evolutionpp. 37–57). New York and Oxford: Pergamon Press.
Gulick, S. P. S., Barton, P. J., Christeson, G. L., Morgan, J. V., McDonald, M., Mendoza-Cervantes, K., et al. (2008). Importance of pre-impact crustal structure for the asymmetry of the Chicxulub impact crater. Nature Geoscience, 1(2), 131–135. https://doi.org/10.1038/ngeo103 Gulick, S. P. S., Christeson, G. L., Barton, P. J., Grieve, R. A. F., Morgan, J. V., & Urrutia-Fucugauchi, J. (2013). Geophysical characterization
of the Chicxulub impact crater. Reviews of Geophysics, 51, 31–52. https://doi.org/10.1002/rog.20007
Hildebrand, A. R., Penfield, G. T., Kring, D. A., Pilkington, M., Camargo, A., Jacobsen, S. B., & Boynton, W. V. (1991). Chicxulub Crater: A possible Cretaceous/Tertiary boundary impact crater on the Yucatán Peninsula, Mexico. Geology, 19(9), 867–871. https://doi.org/10. 1130/0091-7613(1991)019h0867:CCAPCTi2.3.CO;2
Hildebrand, A. R., Pilkington, M., Connors, M., Ortiz-Aleman, C., & Chavez, R. E. (1995). Size and structure of the Chicxulub crater revealed by horizontal gravity gradients and cenotes. Nature, 376(6539), 415. https://doi.org/10.1038/376415a0
Ivanov, B. A. (2005). Numerical modeling of the largest terrestrial meteorite craters. Solar System Research, 39(5), 381–409. https://doi.org/ 10.1007/s11208-005-0051-0
Ivanov, B. A., Deniem, D., & Neukum, G. (1997). Implementation of dynamic strength models into 2D hydrocodes: Applications for atmospheric breakup and impact cratering. International Journal of Impact Engineering, 17(15), 375–386. https://doi.org/10.1016/ S0734-743X(97)87511-2
Kring, D. A., Kramer, G. Y., Collins, G. S., Potter, R. W. K., & Chandnani, M. (2016). Peak-ring structure and kinematics from a multi-disciplinary study of the Schrödinger impact basin. Nature Communications, 7, 13161.
Melosh, H. J. (1989). Impact cratering: A geologic process. New York: Oxford University Press.
Melosh, H. J., Ryan, E. V., & Asphaug, E. (1992). Dynamic fragmentation in impacts: Hydrocode simulation of laboratory impacts. Journal
of Geophysical Research, 97(E9), 14,735–14,759. https://doi.org/10.1029/92JE01632
Morgan, J., Gulick, S., Bralower, T., Chenot, E., Christeson, G., Claeys, P., et al. (2016). The formation of peak rings in large impact craters.
Science, 354(6314), 878–882. https://doi.org/10.1126/science.aah6561
Morgan, J. V., Gulick, S., Mellet, C. L., Green, S. L., & Expedition 364 Scientists (2017). Chicxulub: Drilling the K-Pg impact crater,
Proceedings of the International Ocean Discovery Program(Vol. 364),. College Station, TX: International Ocean Discovery Program. https://doi.org/10.14379/iodp.proc.364.2017
Morgan, J. V., Warner, M. R., Collins, G. S., Grieve, R. A. F., Christeson, G. L., Gulick, S. P. S., & Barton, P. J. (2011). Full waveform tomographic images of the peak ring at the Chicxulub impact crater. Journal of Geophysical Research, 116, B06303. https://doi.org/10. 1029/2010JB008015
Morgan, J. V., Warner, M. R., Collins, G. S., Melosh, H. J., & Christeson, G. L. (2000). Peak-ring formation in large impact craters: Geophysical constraints from Chicxulub. Earth and Planetary Science Letters, 183(34), 347–354. https://doi.org/10.1016/ S0012-821X(00)00307-1
Morgan, J. V., Warner, M., the Chicxulub Working Group, Brittan, J., Buffler, R., Camargo, A., Christeson, G., et al. (1997). Size and morphology of the Chicxulub impact crater. Nature, 390(6659), 472–476. https://doi.org/10.1038/37291
Penfield, G. T., & Camargo, Z. A. (1981). Definition of a major igneous zone in the central Yucatan platform with aeromagnetics and gravity. Technical program, abstracts and biographies (Society of Exploration Geophysicists 51st annual international meeting): Los Angeles, Society of Exploration Geophysicists, 37.
Pilkington, M., & Grieve, R. A. F. (1992). The geophysical signature of terrestrial impact craters. Reviews of Geophysics, 30(2), 161–181. https://doi.org/10.1029/92RG00192
Pilkington, M., Hildebrand, A., & Ortiz-Aleman, C. (1994). Gravity and magnetic field modeling and structure of the Chicxulub Crater, Mexico. Journal of Geophysical Research, 99(E6), 13,147–13,162. https://doi.org/10.1029/94JE01089
Poelchau, M. H., & Kenkmann, T. (2011). Feather features: A low-shock-pressure indicator in quartz. Journal of Geophysical Research, 116, B02201. https://doi.org/10.1029/2010JB007803
Rae, A. S. P., Collins, G. S., Poelchau, M., Riller, U., Davison, T., Grieve, R. A. F., et al. IODP-ICDP Expedition 364 Scientists (2019). Stress-strain evolution during peak-ring formation: A case study of the Chicxulub impact structure. Journal of Geophysical Research:
Planets, 124, 396–417. https://doi.org/10.1029/2018JE005821
Riller, U., Poelchau, M. H., Rae, A. S. P., Schulte, F. M., Collins, G. S., Melosh, H. J., et al. IODP-ICDP Expedition 364 Science Party (2018). Rock fluidization during peak-ring crater formation. Nature, 562(7728), 511. https://doi.org/10.1038/s41586-018-0607-z
Schindelin, J., Arganda-Carreras, I., Frise, E., Kaynig, V., Longair, M., Pietzsch, T., et al. (2012). Fiji: An open-source platform for biological-image analysis. Nature Methods, 9(7), 676–682. https://doi.org/10.1038/nmeth.2019
Sharpton, V. L., Burke, K., Camargo-Zanoguera, A., Hall, S. A., Lee, D. S., Marin, L. E., et al. (1993). Chicxulub multiring impact basin: Size and other characteristics derived from gravity analysis. Science, 261(5128), 1564–1567. https://doi.org/10.1126/science.261.5128.1564 Sharpton, V. L., Marin, L. E., Carney, J. L., Lee, S., Ryder, G., Schuraytz, B. C., et al. (1996). A model of the Chicxulub impact basin based on
evaluation of geophysical data, well logs, and drill core samples. In G. Ryder, D. Fastovsky, & S. Gartner (Eds.), The Cretaceous-Tertiary
event and other catastrophes in Earth history, Spec. Pap. 307(pp. 55–74). Boulder, CO: Geological Society of America.
Sibson, R. H. (2000). Fluid involvement in normal faulting. Journal of Geodynamics, 29(3), 469–499. https://doi.org/10.1016/ S0264-3707(99)00042-3
Tanner, J., Aiken, C., Dehlinger, P., Dewhurst, W., de la Fuente, M., Godley, V., et al. (1988). Gravity anomaly map of North America.
The Leading Edge, 7(11), 15–18. https://doi.org/10.1190/1.1439456
Vermeesch, P. M., Morgan, J. V., Christeson, G. L., Barton, P. J., & Surendra, A. (2009). Three-dimensional joint inversion of traveltime and gravity data across the Chicxulub impact crater. Journal of Geophysical Research, 114, B02105. https://doi.org/10.1029/2008JB005776 Winkler, R., Luther, R., Poelchau, M. H., Wünnemann, K., & Kenkmann, T. (2018). Subsurface deformation of experimental hypervelocity
impacts in quartzite and marble targets. Meteoritics & Planetary Science, 53(8), 1733–1755. https://doi.org/10.1111/maps.13080 Wünnemann, K., Collins, G. S., & Melosh, H. J. (2006). A strain-based porosity model for use in hydrocode simulations of impacts and
implications for transient crater growth in porous targets. Icarus, 180(2), 514–527.
Zuber, M. T., Smith, D. E., Watkins, M. M., Asmar, S. W., Konopliv, A. S., Lemoine, F. G., et al. (2013). Gravity field of the Moon from the Gravity Recovery and Interior Laboratory (GRAIL) mission. Science, 339(6120), 668–671. https://doi.org/10.1126/science.1231507