HAL Id: hal-00304053
https://hal.archives-ouvertes.fr/hal-00304053
Submitted on 25 Mar 2008HAL is a multi-disciplinary open access
archive for the deposit and dissemination of sci-entific research documents, whether they are pub-lished or not. The documents may come from teaching and research institutions in France or abroad, or from public or private research centers.
L’archive ouverte pluridisciplinaire HAL, est destinée au dépôt et à la diffusion de documents scientifiques de niveau recherche, publiés ou non, émanant des établissements d’enseignement et de recherche français ou étrangers, des laboratoires publics ou privés.
Airborne dust distributions over the Tibetan Plateau
and surrounding areas derived from the first year of
CALIPSO lidar observations
Zhaoyan Liu, Dong Liu, Jianping Huang, M. Vaughan, Itsushi Uno, Nobuo
Sugimoto, Chieko Kittaka, C. Trepte, Zhien Wang, C. Hostetler, et al.
To cite this version:
Zhaoyan Liu, Dong Liu, Jianping Huang, M. Vaughan, Itsushi Uno, et al.. Airborne dust distribu-tions over the Tibetan Plateau and surrounding areas derived from the first year of CALIPSO lidar observations. Atmospheric Chemistry and Physics Discussions, European Geosciences Union, 2008, 8 (2), pp.5957-5977. �hal-00304053�
ACPD
8, 5957–5977, 2008
Dust over the Tibetan Plateau measured by
CALIPSO
Zhaoyan Liu et al.
Title Page Abstract Introduction Conclusions References Tables Figures ◭ ◮ ◭ ◮ Back Close
Full Screen / Esc
Printer-friendly Version Interactive Discussion Atmos. Chem. Phys. Discuss., 8, 5957–5977, 2008
www.atmos-chem-phys-discuss.net/8/5957/2008/ © Author(s) 2008. This work is distributed under the Creative Commons Attribution 3.0 License.
Atmospheric Chemistry and Physics Discussions
Airborne dust distributions over the
Tibetan Plateau and surrounding areas
derived from the first year of CALIPSO
lidar observations
Zhaoyan Liu1, Dong Liu2, Jianping Huang3, M. Vaughan4, Itsushi Uno5, Nobuo Sugimoto6, Chieko Kittaka7, C. Trepte4, Zhien Wang2, C. Hostetler4, and D. Winker4
1
National Institute of Aerospace, Hampton, VA 23666, USA
2
University of Wyoming, Laramie, WY 82071, USA
3
Lanzhou University, Lanzhou, Gansu, China
4
NASA Langley Research Center, Hampton, VA 23681, USA
5
Kyushu University, Kasuga, Fukuoka, Japan
6
National Institute for Environmental Studies, Tsukuba, Ibaraki, Japan
7
Science Systems and Applications, Inc, Hampton, USA
Received: 12 February 2008 – Accepted: 18 February 2008 – Published: 25 March 2008 Correspondence to: Zhaoyan Liu ([email protected])
ACPD
8, 5957–5977, 2008
Dust over the Tibetan Plateau measured by
CALIPSO
Zhaoyan Liu et al.
Title Page Abstract Introduction Conclusions References Tables Figures ◭ ◮ ◭ ◮ Back Close
Full Screen / Esc
Printer-friendly Version Interactive Discussion
Abstract
Airborne dust is a major environmental hazard in Asia. Using an analysis of the first full year of CALIPSO lidar measurements, this paper derives unprecedented, altitude-resolved seasonal distributions of desert dust transported over the Tibetan Plateau (TP) and the surrounding areas. The CALIPSO lidar observations include numerous
5
large dust plumes over the northern slope and eastern part of the TP, with the largest number of dust events occurring in the spring of 2007, and some layers being lofted to altitudes of 10 km and higher. Generation of the Tibetan airborne dusts appears to be largely associated with source regions to the north and on the eastern part of the plateau. Examination of the CALIPSO time history reveals an “airborne dust corridor”
10
due to the eastward transport of dusts originating primarily in these source areas. This corridor extends from west to east and shows a seasonality largely modulated by the TP through its dynamical and thermal forcing on the atmospheric flows. On the south-ern side, desert dust particles originate predominately in North India and Pakistan. The dust transport occurs primarily in dry seasons around the TP western and
south-15
ern slopes and dust particles become mixed with local polluted aerosols. No significant amount of dust appears to be transported over the Himalayas. Extensive forward tra-jectory simulations are also conducted to confirm the dust transport pattern from the nearby sources observed by the CALIPSO lidar.
1 Introduction
20
The Tibetan Plateau (TP) is the highest and most extensive plateau in the world. It has an average elevation over 4500 m and covers most of the Tibet Autonomous Region and Qinghai Province in China. The plateau is surrounded by the Earth’s highest moun-tains, including the Himalayas and the Pamir and Kunlun ranges, with the Taklimakan Desert to the north, the Gobi Desert to the northeast, and the deserts in Southwest
25
ACPD
8, 5957–5977, 2008
Dust over the Tibetan Plateau measured by
CALIPSO
Zhaoyan Liu et al.
Title Page Abstract Introduction Conclusions References Tables Figures ◭ ◮ ◭ ◮ Back Close
Full Screen / Esc
Printer-friendly Version Interactive Discussion (Liu and Chen, 2000) and ice core analyses (Thompson et al., 2003) show that the
TP has been experiencing accelerated warming, especially in winter, during the past several decades. This warming trend is thought to be the major cause for the ablation of mountain glaciers on the TP (Thompson et al., 2003), which feed major Asian rivers such as the Yangtze, the Indus and the Ganges. If the glaciers in the TP continue to
5
retreat, there will be major impacts on the hydrologic cycle and water availability to the populations of India and China (Ramanathan et al., 2007; Barnett et al., 2005)
Dust is a major component of the aerosol burden over the plateau and the north-ern side of the surrounding area. If the dust has significant absorption, the observed warming trend could be due in part to the presence of large amounts of dusts over the
10
TP and in the surrounding areas. Dust particles arising from the numerous surround-ing sources can be transported to and stacked over the TP. On the southern side, dust transported from the Arabian Peninsula or generated on the Indian Subcontinent is often mixed with large concentrations of locally generated pollution aerosols. The local pollution alone can enhance the solar heating of the low atmosphere by ∼50%
15
(Ramanathan et al., 2007). Due to its particular orography and location, the TP can significantly influence the Asian climate through the dynamical and thermal forcing (Wu et al., 2006). Model studies by Lau et al. (2006) show that the highly elevated surface air over the plateau may act as an “elevated heat pump” and alter the regional climate significantly through the absorption of solar radiation by dust coupled with black carbon
20
emission from industrial areas in northern India. As a result, a tropospheric tempera-ture anomaly may be induced in late spring and early summer over parts of northern India and Tibet, leading to an earlier onset and intensification of the Indian monsoon. However, the effects of the Tibetan aerosol on the regional climate variability remain largely unknown, due partly to an insufficient number of observations over the plateau.
25
Most existing ground weather stations are located on the eastern part and the slopes of the western part of the TP (Huang et al., 2007). Additional observations of height-resolved aerosol distributions over a larger geographic region are required to obtain a more complete understanding of the climatological impact of the aerosol loading over
ACPD
8, 5957–5977, 2008
Dust over the Tibetan Plateau measured by
CALIPSO
Zhaoyan Liu et al.
Title Page Abstract Introduction Conclusions References Tables Figures ◭ ◮ ◭ ◮ Back Close
Full Screen / Esc
Printer-friendly Version Interactive Discussion the TP.
The Aerosol Lidar with Orthogonal Polarization (CALIOP) onboard the Cloud-Aerosol Lidar and Infrared Pathfinder Satellite Observations (CALIPSO) satellite was launched in April 2006 (Winker et al., 2007). CALIOP’s high resolution vertical profiling ability and accurate depolarization measurements make it a superb platform for the
5
study of dust aerosols (D. Liu et al., 20081; Z. Liu et al., 2008). An initial analysis of dust observed by CALIOP in summer 2006 has shown that the occurrence frequency over the TP northern slope is significantly larger than that found by ground stations (Huang et al., 2007). In this paper we use the first year of CALIOP measurements (June 2006 through May 2007) to derive altitude-resolved, seasonally dependent distributions of
10
dust over the TP and the nearby vicinity, and to illustrate patterns of dust transport up to and across the plateau. We also conduct a full season HYSPLIT simulation to study the contributions from the various nearby dust sources.
2 CALIOP data and dust aerosol identification
CALIOP Version 1 data products are used in this study. The primary products of
15
CALIOP level 1B data are three calibrated and geolocated lidar profiles – 532 nm and 1064 nm total attenuated backscatter and 532 nm perpendicular polarization compo-nent (Hostetler et al., 2006). Depolarization ratio is computed directly from the ratio of the two polarization components of the attenuated backscatter at 532 nm. For this study, the CALIOP level 1B data is averaged to a 5 km horizontal resolution (15 laser
20
pulses) and only the nighttime portion of the data is used. Due to the presence of strong solar radiation, the daytime data is noisier than the nighttime data, and thus needs substantially more averaging to achieve the same signal-to-noise ratio (SNR) as the nighttime data. Only cloud-free profiles are used to derive the dust
distribu-1
Liu, D., Wang, Z., Liu, Z., Winker, D., and Trepte, C.: A height resolved global view of dust aerosols from the first year CALIPSO lidar measurements, J. Geophys. Res., in review, 2008.
ACPD
8, 5957–5977, 2008
Dust over the Tibetan Plateau measured by
CALIPSO
Zhaoyan Liu et al.
Title Page Abstract Introduction Conclusions References Tables Figures ◭ ◮ ◭ ◮ Back Close
Full Screen / Esc
Printer-friendly Version Interactive Discussion tions. These profiles are identified using the 5 km cloud layer products produced by
the CALIOP level 2 analyses (Vaughan et al., 2004). In this process, the discrimination between clouds and aerosol layers is accomplished using altitude-dependent, multiple-dimensional probability density functions (PDFs) of layer-averaged 532 nm attenuated backscatter coefficients and the 1064 nm/532 nm attenuated backscatter ratio (Liu et
5
al., 2004). For layers initially classified as aerosols, an additional test is conducted using the layer volume depolarization ratio (VDR, defined as the ratio of perpendicular and parallel components of the lidar backscatter signals at 532 nm). This secondary test significantly reduces misclassifications of faint clouds as aerosols.
The presence of dust at a given altitude range of each 5 km profile is detected using
10
the VDR. The depolarization ratio of dust is high due to the nonsphericity of the dust particles (Murayama et al., 2001), whereas this ratio is low (close to zero) for other aerosol types. We identify dust by defining a VDR threshold value such that dust sig-nals are detected as often as possible while simultaneously minimizing false positives due to other aerosol species. A threshold of 0.06 was selected based on previously
15
compiled distributions of VDR for several different aerosol types derived from CALIOP measurements acquired over geographic regions where each type is generally domi-nant (D. Liu et al., 20081). At an altitude of 1 km, this threshold value corresponds to a horizontal visibility distance in excess of 60 km (refer to Appendix A). Thus, all normally defined dust events, including dust storms (visibility<1 km), blowing dust (1–10 km),
20
and floating dust (<10 km) (e.g., Qian, et al., 2002), as well as some soil dusts, fly ashes, etc., should be captured.
3 Results and discussions
3.1 Dust transport examples
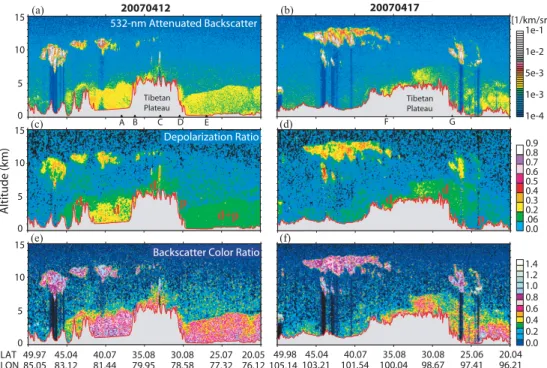
Figure 1 presents two cases of dust transport up to and across the TP measured
25
ACPD
8, 5957–5977, 2008
Dust over the Tibetan Plateau measured by
CALIPSO
Zhaoyan Liu et al.
Title Page Abstract Introduction Conclusions References Tables Figures ◭ ◮ ◭ ◮ Back Close
Full Screen / Esc
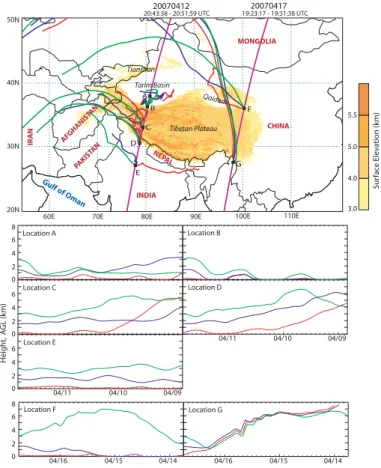
Printer-friendly Version Interactive Discussion the two cases, along with three-day back trajectories (red, blue, and green lines) at
selected locations (A–G) along the track are presented in Fig. 2. The 12-04-2007 track passes over the western part of the TP (depicted by the color filled contour) and the 17-04-2007 track crosses the eastern part. The three-day back trajectories were computed using the NOAA HYSPLIT model (Draxler and Hess, 2004), and initialized
5
at three altitudes of 0.2 km (red), 1.5 km (blue) and 3.0 km (green) at 20:00 UTC for 12-04-2007 and 19:00 UTC for 17-04-2007.
Attenuated backscatter coefficients measured at 532 nm by CALIOP are shown in Fig. 1a and b. Clouds typically have larger backscatter coefficients than aerosols (e.g., Hess et al., 1998; Liu et al., 2004). The red-gray-white colored features in (a) and
10
(b) are clouds, and green-yellow-orange colored features are aerosols. VDR mea-surements are presented in Fig. 1c and d, and the attenuated backscatter color ratio (defined as the ratio of 1064 nm attenuated backscatter to 532 nm attenuated backscat-ter) is shown in Fig. 1e and f. As mentioned earlier, the dust aerosols have a large VDR value due to nonsphericity, while they also have a large color ratio due to the relatively
15
large particle size. On the other hand, the other type aerosols have small VDR values. Because dust particles are relatively large when compared to other aerosol species, and because the spectral dependence of their extinction coefficients is relatively small at the CALIOP wavelengths, dusts are typically characterized by moderately large, ver-tically uniform profiles of attenuated backscatter color ratio (ACR). Aerosols consisting
20
of smaller particles will have smaller ACR values. Furthermore, if the extinction at 532 nm is significantly larger than at 1064 nm, as is the case for smokes and pollution aerosols containing sizeable amounts of black carbon, the ACR will not be vertically uniform, but instead will be an increasing function of penetration into layer. Based on this combination of information contained in the three CALIOP measurements (the
at-25
tenuated backscatter, depolarization ratio, and backscatter color ratio), we have man-ually identified regions containing dust aerosols (d ), polluted aerosols (p) and their mixture (d +p) (see Fig. 1c and d).
ACPD
8, 5957–5977, 2008
Dust over the Tibetan Plateau measured by
CALIPSO
Zhaoyan Liu et al.
Title Page Abstract Introduction Conclusions References Tables Figures ◭ ◮ ◭ ◮ Back Close
Full Screen / Esc
Printer-friendly Version Interactive Discussion TP. For the 12-04-2007 case, dust was observed along the track from the Tianshan
Mountains in the north, through the Tarim Basin area, and southward over the TP and into India. The densest plume appears over the Tarim Basin, with its top reaching ∼5 km. The vertical structure is consistent with the previous simulation (Uno et al., 2005). The back trajectories indicate that the airborne dusts over the Tarim area
(lo-5
cation A) and on the northern slope (location B) of the TP are associated with dust activities in the Tarim Basin where ground stations recorded dust events. The me-teorological analysis based on the Weather Research and Forecasting (WRF) model simulation shows that dust storms can be generated in the Tarim Basin during this time period, and the plumes remain trapped largely in the basin, consistent with the CALIOP
10
measurement. On the Indian side (location E), the dust appears to be transported from one of many major dust sources in northern India, Pakistan and/or Afghanistan (Mid-dleton, 1986). However, these dust particles appear to be mixed with locally generated pollution aerosols, soil dusts, fly ashes, etc. The 0.2 km back trajectory indicates that the air mass in the lower part of the aerosol plume is likely transported from
northeast-15
ern India. The northern India is one of high pollution areas in the world. A very dense aerosol plume is seen lofted over the TP southwestern slope (location D). Its VDR value is low, suggesting that the plume is dominated by polluted aerosol, though the back trajectories show a possibility of air parcel transport from Iran and/or Afghanistan, which may account for the relatively high ACR. Pollution aerosols, generally mixed with
20
dust, are frequently observed by CALIOP over northern India and the southern and western slopes of the TP (Ramanathan et al., 2007). Over the plateau, the scattering intensity of the dust is relatively weak (Fig. 1a), but the dust particles appear to be lofted to an altitude of ∼10 km (Fig. 1c). Note that there are small scale clouds embedded in the dust being transported over the TP. The back trajectories (Fig. 2) indicate that the
25
dust over the TP for the location C may originate from sources west of the TP and/or generated on the plateau itself. Airborne dusts on the TP can be generated both locally and remotely (Zhang et al., 2001).
ACPD
8, 5957–5977, 2008
Dust over the Tibetan Plateau measured by
CALIPSO
Zhaoyan Liu et al.
Title Page Abstract Introduction Conclusions References Tables Figures ◭ ◮ ◭ ◮ Back Close
Full Screen / Esc
Printer-friendly Version Interactive Discussion across the plateau and into Southeast Asia. As seen in Fig. 1d, there is a large dust
plume covering much of the plateau along the lidar track, extending from ∼46◦N into
Myanmar to the south, where the plume becomes optically thinner and appears to become mixed with local polluted aerosols. Back trajectories (Fig. 2) suggest that this plume originated in the Qaidam Basin, on the northeastern TP, where dust storms
5
were recorded on 16 April 2007 by ground stations situated over the basin and the area around the location F. Based on the ground station records recorded every three hours, this dust event was initially observed at 06:00 UTC, and lasted to 15:00 UTC. The ground wind speed over the area was between 7–12 m/s, which exceeds the wind speed threshold for dust emission over the area (Kurosaki and Mikami, 2007). The
10
back trajectories for locations F and G along the CALIPSO track confirm the origin of the dust plume in the Qaidam Basin area. At location G, the dust plume extends to ∼5 km a.g.l. The back trajectories originated at three heights (0.2, 1.5 and 3.0 km, a.g.l.) all pass over the eastern Qaidam. At location F, the densest part of the dust plume extends to ∼1.5 km above the ground.
15
3.2 Dust distributions
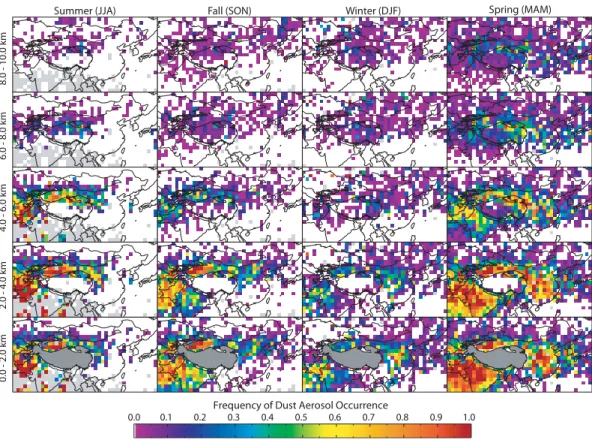
Frequency distributions of airborne dusts over the TP and surrounding vicinity for five altitude ranges (0.0–2.0, 2.0–4.0, 4.0–6.0, 6.0–8.0 and 8.0–10.0 km, a.m.s.l.), derived from the first year CALIOP measurement (June 2006 through May 2007), are presented in Fig. 3. The frequency of dust aerosol occurrence for a 2×2 degree pixel in a given
20
altitude range is defined as the ratio of the number of dusty profiles (VDR>6% and cloud free) and the total number of cloud free profiles within the pixel (D. Liu et al., 20081).
Surrounding the TP there are several major dust sources, with the Taklimakan to the north, the Gobi deserts to the northeast, and deserts in Southwest Asia to the
25
west and southwest. The Taklimakan and Gobi deserts in China (Qian et al., 2002) and the deserts on the Indian Subcontinent (Middleton, 1986) are very prolific dust sources, subordinate only to North Africa and Arabian Peninsula (Prospero et al., 2002;
ACPD
8, 5957–5977, 2008
Dust over the Tibetan Plateau measured by
CALIPSO
Zhaoyan Liu et al.
Title Page Abstract Introduction Conclusions References Tables Figures ◭ ◮ ◭ ◮ Back Close
Full Screen / Esc
Printer-friendly Version Interactive Discussion D. Liu et al., 20081). These dust occurrences appear to have a similar seasonality,
be-ing most frequent in sprbe-ing and least frequent in winter. The spatial extent of airborne dusts in spring is also the largest: vertically, a significant amount of dust is lifted up to 10 km or higher; horizontally, dust particles are carried for long distances into the Pacific Ocean or Arabian Sea. The transport of dusts is largely driven by atmospheric
5
circulations. Due to the particular orography, the TP can modulate circulation genera-tion and patterns over the area both dynamically and thermally (Wu et al., 2007; Liu et al., 2007), which in turn influences the dust transport and distribution. The TP eleva-tion is generally higher in the west than in the east. The mid-latitude westerly jet flow is thus split by the TP into two spiral branches, with the northern branch stronger than
10
southern branch (Wu et al., 2007; Liu et al., 2007).
Dusts over the TP appear to be largely associated with meteorological activities on the northern side, being transported by the northern branch of the westerly flow from the Taklimakan and Gobi deserts, and from the Qaidam Basin on the plateau where the dust particles are mobilized normally by cold air outbreaks into free troposphere
15
(Sun et al., 2001). The westerly flow tends to cause ascent on the upslope and de-scent on the downslope over the northern side of the TP (Liu et al., 2007). An “airborne dust corridor” is observed from west to east in China covering the northern slope and eastern part of the TP. This airborne dust corridor shows a seasonality driven largely by the prevailing atmospheric circulations: it extends southeastward, reaching
south-20
eastern China in spring, and northeastward in fall. In spring, very deep dust layers (over 1 km, and up to 4 km over some locations) are seen over southeastern China. During this season, modulated by the TP, the northern branch of the westerly jet blows southeastward into eastern China, which can carry a large amount of dust particles from sources on the northern side of the TP and also possibly from the Loess Plateau
25
into southeastern China. Meanwhile, the southern branch of the westerly jet blows northward over eastern China, resulting in spiral airflows when meeting the northern branch. The transported dust particles can be trapped by these spiral airflows within southeastern China for long time. However, the optical depths of the airborne dust over
ACPD
8, 5957–5977, 2008
Dust over the Tibetan Plateau measured by
CALIPSO
Zhaoyan Liu et al.
Title Page Abstract Introduction Conclusions References Tables Figures ◭ ◮ ◭ ◮ Back Close
Full Screen / Esc
Printer-friendly Version Interactive Discussion southeastern China are normally smaller than those in the source regions. In summer
and winter, the corridor lies nearly eastward. The airborne dust is largely confined to western and central North China in summer, and can be transported for long distances into the Pacific Ocean in spring and also in winter. The long range transport of Asian dust is a well known phenomenon in spring (e.g., Sun et al., 2001; Chun, et al., 2001;
5
Uno et al., 2001; Murayama et al., 2001; Husar et al., 2001; Liu et al., 2002; Sassen, 2002). The occurrence of dust over the TP is the largest in spring over the northern slope and the eastern part (covering ∼1/3 area in 4–6 km altitudes, ∼half in 6–8 km altitudes). Dust particles can also be lifted into high atmosphere (10 km or higher) in this season.
10
On the Indian Subcontinent, airborne desert dusts are mainly generated by sources in North India and Pakistan (Middleton, 1986) and can be transported for great dis-tances by the southern branch of the westerly flow. As seen in Fig. 3, dusts are trans-ported across the entire subcontinent during springtime, with the dust occurrence fre-quency (surface–4 km) being greater than 80% on average for the whole area and close
15
to 100% for some locations in the source regions. Significant amounts of dust (occur-rence frequency>0.3) are seen up to 8 km over the source regions. In the summer during the Indian monsoon season, very high frequencies (>90%) are seen from the surface up to 6 km over the source regions in Pakistan and Afghanistan. Unfortunately, using our current method, reliable dust occurrence statistics for central and southern
20
India cannot be computed for the rainy season, as during this time the persistent cloud cover prohibits the acquisition of a sufficient quantity of cloud-free measurements. In wintertime the dust occurrence frequency reaches its minimum, and the dust occur-rence is confined largely in lower altitudes and in the source regions in North India and Pakistan. However, dusts from the Indian Subcontinent do not appear to be
trans-25
ported significantly to the TP, as they are blocked by the Himalayas. The dust transport is forced southeastward around the orography of the southwestern slope of the Hi-malayas. This appears to be consistent with the simulated air flow pattern over this area (Wu et al., 2007; Liu et al., 2007), and is confirmed by the season long HYSPLIT
ACPD
8, 5957–5977, 2008
Dust over the Tibetan Plateau measured by
CALIPSO
Zhaoyan Liu et al.
Title Page Abstract Introduction Conclusions References Tables Figures ◭ ◮ ◭ ◮ Back Close
Full Screen / Esc
Printer-friendly Version Interactive Discussion forward trajectory simulation presented in the next section.
4 Seasonal HYSPLIT simulation
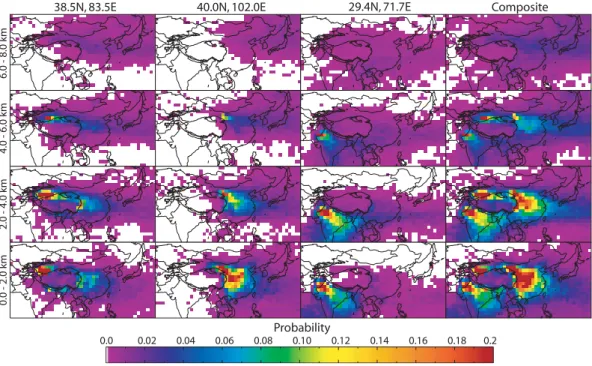
To study the most likely transport routes of dusts emanating from the surrounding source regions and flowing into and across the TP, we conducted 20-day forward simu-lations using HYSPLIT. These simusimu-lations were conducted for the spring season,
dur-5
ing which, as demonstrated in the previous section, the dust activity and transport is most significant. Three locations were selected: 38.5◦N, 83.5◦E in Taklimakan in west
China, 40.4◦N, 102.0◦E in Gobi in central North China, and 29.4◦N, 71.7◦E in
Gan-ganagar in North India. The simulation was initiated at a height of 500 m (a.g.l) for each location, and repeated for every 6 h from 1 March through 31 May 2007. The
10
results are presented in Fig. 4. The probability distribution for each air parcel is com-puted as the ratio of the number of trajectories passing through a given grid cell to the total number of 6-h runs. As is clearly shown in Fig. 4, dusts generated in both Takli-makan and Gobi can be transported to the TP and contribute to the observed “airborne dust corridor” in China. However, their contributions appear to be different. Significant
15
amounts of dust can be carried to southeastern China in spring. Dust transport into and across the Pacific is also possible. On the other hand, the dusts mobilized on the Indian Subcontinent are transported mainly southeastward around the TP south-western slope. After entering the tropical region, the transport at higher altitudes is changed to a southwestward direction by the tropical easterlies. However, at lower
alti-20
tudes (0–2 km a.g.l), almost no dust is seen to be transported onto the western part of the TP, although some possibility of dust transport to the TP and the Pacific is shown at higher altitudes. In all three locations, the distribution patterns derived from the simula-tion study are strikingly similar to the observed dust distribusimula-tions measured by CALIOP during the spring season of 2007 (i.e., as shown in Fig. 3).
25
We also conducted HYSPLIT simulations originating at a height of 1500 m (a.g.l). These results show a very similar transport pattern, although they are not presented in
ACPD
8, 5957–5977, 2008
Dust over the Tibetan Plateau measured by
CALIPSO
Zhaoyan Liu et al.
Title Page Abstract Introduction Conclusions References Tables Figures ◭ ◮ ◭ ◮ Back Close
Full Screen / Esc
Printer-friendly Version Interactive Discussion this paper.
We note that the simulation was conducted only for three selected “points” in the desert dust source regions. Some differences are expected between the CALIOP measurements and the HYSPLIT simulations. For example, high dust occurrence quencies are seen over the entire India in the CALIOP measurements, while high
fre-5
quencies are only seen over the region around the TP in the HYSPLIT simulations. In addition to the dust source in the Ganganagar Desert selected for the HYSPLIT simu-lations, dust sources in Southwest Asia and Arabian Peninsula as well as some local dust sources may also contribute to the airborne dusts over India that are observed by CALIOP in the springtime.
10
5 Summary
In this paper, we use the first year of CALIPSO lidar measurements to derive an un-precedented set of altitude-resolved, seasonally-dependent dust distributions over the Tibetan Plateau and the surrounding areas. The TP is surrounded by a number of prolific dust sources. Each year, large amounts of dust particles are mobilized from
15
these sources and can be transported to and over the TP. This dust transport is pri-marily driven by atmospheric circulation. Due to its particular orography and location, the TP exerts significant influence on circulation generation and patterns, both dynami-cally and thermally, which in turn modulates the dust transport and distribution over the surrounding area. On the southern side, where circulation patterns are guided by the
20
orography of the Himalayas (the highest mountain range in the world) located on the southwestern edge, the dusts generated in North India, Pakistan and/or Afghanistan are typically transported southeastward during the dry seasons. During springtime, large occurrence frequencies (close to 1 in many regions) are seen all over the In-dian Subcontinent in the lower altitudes, from the surface to ∼4 km. Airborne dusts
25
are largely confined to Pakistan and Afghanistan during the summer monsoon season. However, the dusts are rarely, if ever, transported over the Himalayas to the TP.
ACPD
8, 5957–5977, 2008
Dust over the Tibetan Plateau measured by
CALIPSO
Zhaoyan Liu et al.
Title Page Abstract Introduction Conclusions References Tables Figures ◭ ◮ ◭ ◮ Back Close
Full Screen / Esc
Printer-friendly Version Interactive Discussion On the northern side, large amounts of dust can be mobilized from the Tarim Basin
and Gobi Desert areas by cold fronts and/or strong cyclone systems each year. Dusts can also be generated on the plateau (e.g., Qaidam Basin). An “airborne dust corridor” has been observed to regularly transport dust eastward, extending from the west to the east in China, covering the source regions, the northern slope and eastern part
5
of the TP, Hexi Corridor, Loess Plateau and eastern China. This “airborne dust corri-dor” appears to be associated with dust activities in the source regions the north and east of the TP. A clear seasonality is seen, and is considered to be largely driven by the atmospheric circulations. In spring, both the occurrence frequency and coverage of the airborne dust reach a maximum. During this time of year, the dust particles
10
can be lofted to high altitudes reaching 10 km or higher. This “airborne dust corridor” extends southeastward to southeastern China in spring and northeastward reaching Northeastern Plain in fall. However, the airborne dust is confined largely to the source regions and on the northern slope and eastern part of the TP in summer. Comparing the two major sources in China, the Tarim Basin area appears to be more prolific and
15
persistent than the Gobi area.
The HYSPLIT model was used to conduct a season long transport simulation for spring of 2006. Results of this simulation replicate the findings by CALIOP of the dust transport from the nearby sources. In addition to the ubiquitous airborne dust, pollution aerosols and mixtures of pollution and dust were also commonly observed by CALIOP
20
over the southern slope of the TP and a large area to the south. The goal realized by this study is to provide a first step toward a better understanding of the Tibetan aerosols and their possible interaction with the climate. This study has also demonstrated that ground stations tend to miss some dust events (most especially lofted dust layers), and highlighted the utility of CALIOP measurements of airborne dust.
ACPD
8, 5957–5977, 2008
Dust over the Tibetan Plateau measured by
CALIPSO
Zhaoyan Liu et al.
Title Page Abstract Introduction Conclusions References Tables Figures ◭ ◮ ◭ ◮ Back Close
Full Screen / Esc
Printer-friendly Version Interactive Discussion
Appendix A
The visibility distanceV can be estimated from the atmospheric extinction coefficient σ Cohen, 1975] using
5
V = 3.912/σ. (A1)
Where
σ = σp+ σm = (R − 1) Spσm/Sm+ σm, (A2)
σp and σm are the extinction coefficients, and Sp and Sm (≈8π/3) are the lidar ratios,
respectively, for particles and molecules.R is the scattering ratio defined as the ratio of
10
the total backscatter from both particles and molecules to the molecular-only backscat-ter.R can be estimated from the volume depolarization ratio (VDR), δV, the particulate depolarization ratio (PDR),δP, and the molecular depolarization ratio (δm, ∼0.0036 for CALIOP)
R = (1+ δV) (δP − δm) (δP − δV) (1+ δm)
. (A3)
15
At 532 nm wavelength,σm≈0.011 km−1at 1 km altitude, and the lidar ratio and PDR for dusts range from 30–80 sr and 20–40 respectively, therefore, a threshold of 0.06 of the VDP corresponds to a horizontal visibility distance of 63–195 km.
References
Barnett, T., Adam, J., and Lettenmaier, D.: Potential impacts of a warming climate on water
20
availability in snow-dominated regions, Nature, 438, 303–309, 2005.
Cohen, A.:“Horizontal visibility and the measurement of atmospheric optical depth of lidar”, Appl. Opt., 14, 2878–2882, 1975.
ACPD
8, 5957–5977, 2008
Dust over the Tibetan Plateau measured by
CALIPSO
Zhaoyan Liu et al.
Title Page Abstract Introduction Conclusions References Tables Figures ◭ ◮ ◭ ◮ Back Close
Full Screen / Esc
Printer-friendly Version Interactive Discussion
Chun, Y. S., Boo, K. O., Kim, J., Park, S., and Lee, M.: Synopsis transport and physical char-acteristics of Asian dust in Korea, J. Geophys. Res., 106, 18 461–18 469, 2001.
Draxler, R. R. and Hess, G. D.: Description of the HYSPLIT 4 Modeling System, NOAA Tech-nical Memorandum ERL ARL-224, 2004.
Hess, M., Koepke, P., and Schult I.: Optical properties of aerosols and clouds: The software
5
package OPAC, B. Am. Meteorol. Soc., 79, 831–844, 1998.
Hostetler, C., Liu, Z., Reagan, J., Vaughan, M., Winker, D., Osborn, M., Hunt, W., Powell, K., and Trepte, C.: CALIOP Algorithm Theoretical Basis Document - Part 1: Calibration and Level 1 Data Products, PC-SCI-201, Release 1.0, NASA Langley Research Center, Hamp-ton, VA., available at: http://www-calipso.larc.nasa.gov/resources/project documentation.
10
php, 2006.
Huang, J., Minnis, P., Yi, Y., Tang, Q., Wang, X., Hu, Y., Liu, Z., Ayers, K., Trepte, C., and Winker, D.: Summer dust aerosols detected from CALIPSO over the Tibetan Plateau, Geophys. Res. Lett., 34, L18805, doi:10.1029/2007GL029938, 2007.
Husar, R. B., Tratt, D. M., Schichtel, B. A., Falke, S. R., Li, F., Jaffe, D., Gasso, S., Gill, T.,
15
Laulainen, N. S., Lu, F., Reheis, M. C., Chun, Y., Westphal, D., Holben, B. N., Gueymard., C., McKendry, I., Kuring, N., Feldman, G. C., McClain, C., Frouin, R. J., Merrill, J., DuBois, D., Vignola, F., Murayama, T., Nickovic, S., Wilson, W. E., Sassen, K., Sugimoto, N., and Malm, W. C.: Asian dust events of April 1998, J. Geophys. Res., 106, 18 317–18 330, 2001. Kurosaki, Y. and Mikami, M.: Threshold wind speed for dust emission in east Asia and its
20
seasonal variations, J. Geophys. Res., 112, D17202, doi:10.1029/2006JD007988, 2007. Lau, K., Kim, M., and Kim, K.: Asian summer monsoon anomalies induced by aerosol
di-rect forcing: the role of the Tibetan Plateau, Clim. Dynam., doi:10.1007/s00382-006-0114-z, 2006.
Liu, X. and Chen, B.: Climatic warming in the Tibetan Plateau during recent decades, Int. J.
25
Climatol., 20, 1729–1742, 2000.
Liu, Y., Hoskins, B., and Blackburn, M.: Impact of Tibetan orography and heating on the summer flow over Asia, J. Meteor. Soc. Jpn., 85B, 1–19, 2007.
Liu, Z., Omar, A., Vaughan, M., Hair, J., Kittaka, C., Hu, Y., Powell, K., Trepte, C., Winker, D., Hostetler, C., Ferrare, R., and Pierce, B.: CALIPSO lidar observations of optical properties
30
of Saharan dust: A case study of long range transport, J. Geophys. Res., in press, 2008. Liu, Z., Vaughan, M., Winker, D., Hostetler, C., Poole, L., Hlavka, D., Hart, W., and McGill, M.:
ACPD
8, 5957–5977, 2008
Dust over the Tibetan Plateau measured by
CALIPSO
Zhaoyan Liu et al.
Title Page Abstract Introduction Conclusions References Tables Figures ◭ ◮ ◭ ◮ Back Close
Full Screen / Esc
Printer-friendly Version Interactive Discussion
backscatter data, J. Geophys. Res., 109, D15202, doi:10.1029/2004JD004732, 2004. Liu, Z., Sugimoto, N., and Murayama, T.: Extinction-to-backscatter ratio of Asian dust observed
by high-spectral-resolution lidar and Raman lidar, Appl. Opt., 41, 2760–2767, 2002.
Middleton, N.: A geography of dust storms in south-west Asia, J. Climatol., 6, 183–196, 1986. Murayama, T., Sugimoto, N., Uno, I., Kinoshita, K., Aoki, K., Hagiwara, N., Liu, Z., Matsui, I.,
5
Sakai, T., Shibata, T., Arao, K., Shon, B-J., Won, J-G., Yoon, S-C., Li, T., Zhou, J., Hu, H., Abo, M., Iokibe, K., Koga, R., and Iwasaka, Y.: Ground-based network observation of Asian dust events of April 1998 in east Asia, J. Geophys. Res., 106(D16), 18 345–18 360, 2001. Prospero, J. M., Ginoux, P., Torres, O., Nicholson, S. E., and Gill, T. E.: Environmental
char-acterization of global sources of atmospheric soil dust identified with the NIMBUS 7 Total
10
Ozone Mapping Spectrometer (TOMS) absorbing aerosol product, Rev. Geophys., 40(1), 1002, doi:10.1029/2000RG000095, 2002.
Qian, W., Quan, L., and Shi, S.: Variations of the dust storm in China and its climatic control, J. Climate, 15, 1216–1229, 2002.
Ramanathan, V., Ramana, M., Roberts, G., Kim, D., Corrigan, C., Chung, C., and Winker, D.:
15
Warming trends in Asia amplified by brown cloud solar absorption, Nature, 448, 575–578, 2007.
Sassen, K.: Indirect climate forcing over the western US from Asian dust storms, Geophys. Res. Lett., 29(10), 1465, doi:10.1029/2001GL014051, 2002.
Sun J., Zhang, M., and Liu, T: Spatial and temporal characteristics of dust storms in China and
20
its surrounding regions, 1960–1999: Relations to source area and climate, J. Geophys. Res., 106(D10), 10 325–10 333, 2001.
Thompson, L., Mosley-Thompson, E., Davis, M., Lin, P., Henderson, K., and Mashiotta, T.: Tropical glacier and ice core evidence of climate change on annual to millennial time scales, Climatic Change, 59, 137–155, 2003.
25
Uno, I., Amano, H., Emori, S., Kinoshita, K., Matsui, I., and Sugimoto, N.: Trans-Pacific yellow sand transport observed in April 1998: A numerical simulation, J. Geophys. Res., 106(D16), 18 331–18 344, 10.1029/2000JD900748, 2001.
Uno, I., Harada, K., Satake, S., Hara, Y., and Wang, Z.: Meteorological characteristics and dust distribution of the Tarim Basin simulated by the nesting RAMS/CFORS dust model, J.
30
Meteor. Soc. Jpn., 83A, 219–239, 2005.
Vaughan, M., Young, S., Winker, D., Powell, K., Omar, A., Liu, Z., Hu, Y., and Hostetler, C.: Fully automated analysis of space-based lidar data: an overview of the CALIPSO retrieval
ACPD
8, 5957–5977, 2008
Dust over the Tibetan Plateau measured by
CALIPSO
Zhaoyan Liu et al.
Title Page Abstract Introduction Conclusions References Tables Figures ◭ ◮ ◭ ◮ Back Close
Full Screen / Esc
Printer-friendly Version Interactive Discussion
algorithms and data products, in Laser Radar Techniques for Atmospheric Sensing, edited by: Singh, Proc. SPIE, 5575, 16–30, 2004.
Winker, D., Hunt, W., and McGill, M.: Initial performance assessment of CALIOP, Geophys. Res. Lett., 34, L19803, doi:10.1029/2007GL030135, 2007.
Wu, G., Liu, Y., Wang, T., Wan, R., Liu, X., Li, W., Wang, Z., Zhang, Q., Duan, A., and Liang,
5
X.: Influence of dynamical and thermal forcing by the Tibetan Plateau on Asian climate, J. Hydrometeorol., 8, 770–789, 2007.
Zhang, X. Y., Arimoto, R., Cao, J. J., An, Z. S., and Wang, D.: Atmospheric dust aerosol over the Tibetan Plateau, J. Geophys. Res., 106(D16), 18 471–18 476, 2001.
ACPD
8, 5957–5977, 2008
Dust over the Tibetan Plateau measured by
CALIPSO
Zhaoyan Liu et al.
Title Page Abstract Introduction Conclusions References Tables Figures ◭ ◮ ◭ ◮ Back Close
Full Screen / Esc
Printer-friendly Version Interactive Discussion 105.14 49.98 103.21 45.04 101.54 40.07 100.04 35.08 98.67 30.08 97.41 25.06 96.21 20.04 1e-4 1e-3 5e-3 1e-2 1e-1 [1/km/sr] 0.0 .06 0.2 0.3 0.4 0.5 0.6 0.7 0.8 0.9 0.0 0.2 0.4 0.6 0.8 1.0 1.2 1.4 LON 85.05 LAT 49.97 83.12 45.04 81.44 40.07 79.95 35.08 78.58 30.08 77.32 25.07 76.12 20.05 0 5 10 15 Altitude (km) 0 5 10 15 0 5 10 15 20070412 20070417 A B C D E F G Tibetan Plateau Tibetan Plateau 532-nm Attenuated Backscatter
Backscatter Color Ratio
(a) (c) (e) (b) (d) (f) d d d p d+p Depolarization Ratio d d p
Fig. 1. Examples of dust transport to and across the Tibetan Plateau measured by CALIOP on
12 and 17 April 2007; (a) and (b) show 532-nm attenuated backscatter; (c) and (d) show volume depolarization ratios; and (e) and (f) present the 1064-nm/532-nm attenuated backscatter color ratio. In (a) and (b), the red-gray-white colored high features are clouds and the green-yellow-orange colored features are aerosols. The red line in indicates the surface. Red charactersd , p and d +p in (c) and (d) represent “dust”, “polluted”, and “dust + polluted” dominated aerosols,
ACPD
8, 5957–5977, 2008
Dust over the Tibetan Plateau measured by
CALIPSO
Zhaoyan Liu et al.
Title Page Abstract Introduction Conclusions References Tables Figures ◭ ◮ ◭ ◮ Back Close
Full Screen / Esc
Printer-friendly Version Interactive Discussion 20N 30N 40N 50N 110E
60E 70E 80E 90E 100E
20070412 20070417 D E CHINA INDIA IR AN PAKIST AN Gulf of Oman 3.0 4.0 5.0 5.5 Sur fac e Elev ation (k m) 20:43:38 - 20:51:59 UTC 19:23:17 - 19:31:38 UTC Tarim Basin Qaidam Tibetan Plateau NEP AL AFGHANIST AN C B A F G Tianshan MONGOLIA Height , A GL (k m) 0 2 4 6 8 0 2 4 6 8 0 2 4 6 0 2 4 6 04/16 04/15 04/14 04/16 04/15 04/14 04/11 04/10 04/09 04/11 04/10 04/09 Location A Location B Location C Location D Location G Location F Location E
Fig. 2. Ground tracks of the CALIPSO orbits for the two examples shown in Fig. 1, and
three-day back trajectories from HYSPLIT. The back trajectories originated at heights above the ground level of 0.2 km (red), 1.5 km (blue) and 3.0 km (green) at 20:00 UTC for 12-04-2007 and 19:00 UTC for 17-04-2007. Filled color contours in depict the plateau where the surface elevation is greater than 3, 4, and 5 and 5.5 km.
ACPD
8, 5957–5977, 2008
Dust over the Tibetan Plateau measured by
CALIPSO
Zhaoyan Liu et al.
Title Page Abstract Introduction Conclusions References Tables Figures ◭ ◮ ◭ ◮ Back Close
Full Screen / Esc
Printer-friendly Version Interactive Discussion 0.0 - 2.0 km 2.0 - 4.0 km 4.0 - 6.0 km 6.0 - 8.0 km 8.0 - 10.0 km 0.0 0.1 0.2 0.3 0.4 0.5 0.6 0.7 0.8 0.9 1.0
Frequency of Dust Aerosol Occurrence
Summer (JJA) Fall (SON) Winter (DJF) Spring (MAM)
Fig. 3. Occurrence distributions of airborne dusts over the Tibetan Plateau and the surrounding
areas for five altitude ranges (0.0–2.0, 2.0–4.0, 4.0–6.0, 6.0–8.0 and 8.0–10.0 km, a.m.s.l.) derived from the first year CALIOP measurement. The dark gray regions in the 0.0–2.0 km panels and black contours in the other panels indicate the plateau, where the surface elevation is higher than 3 km. Light gray pixels represent data points where no cloud free profiles were found. Altitudes are registered with respect to mean sea level.
ACPD
8, 5957–5977, 2008
Dust over the Tibetan Plateau measured by
CALIPSO
Zhaoyan Liu et al.
Title Page Abstract Introduction Conclusions References Tables Figures ◭ ◮ ◭ ◮ Back Close
Full Screen / Esc
Printer-friendly Version Interactive Discussion 0.0 - 2.0 km 2.0 - 4.0 km 4.0 - 6.0 km 6.0 - 8.0 km 0.0 0.02 0.04 0.06 0.08 0.10 0.12 0.14 0.16 0.18 0.2
38.5N, 83.5E 40.0N, 102.0E 29.4N, 71.7E Composite
Probability
Fig. 4. Simulated dust distributions derived using the NOAA HYSPLIT model for the springtime
months (March, April and May) of 2007, for three selected locations in the desert source regions (38.5◦N, 83.5◦E in Taklimakan in west China, 40.4◦N, 102.0◦E in Gobi in central north China,
and 29.4◦N, 71.7◦E in Ganganagar in north India), and four altitude ranges (a.g.l.). The bold
contour depicts the plateau where the elevation is larger than 3 km. The pixel size is 2×2 degrees.
![[PDF] Apprendre la programmation Android avec base de données - Free PDF Download](data:image/gif;base64,R0lGODlhAQABAIAAAP///wAAACH5BAEAAAAALAAAAAABAAEAAAICRAEAOw==)