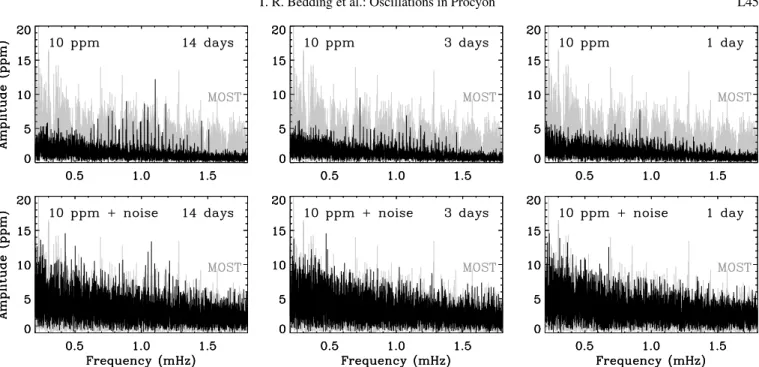
The non-detection of oscillations in Procyon by MOST: Is it really a surprise?
Texte intégral
Figure
Documents relatifs
TABLE IV: Variation of the NCI volume between CCSD (pseudo-densities of monomers are used as reference) and the promolecular approach for test molecules at the 6-311G level:
sophie for asteroseismology, and shows that the high signal-to- noise ratio provided by this new instrument makes it possible to answer the questions raised by previous works that
A second approach to visualize the data in an accessible way is to look at the EEG data in the original time domain, as an event-related potential (ERP) time locked (but prior
In this short note we give a complete characteriza- tion of a certain class of compact corank one Poisson manifolds, those equipped with a closed one-form defining the symplectic
On a une relation lin´ eaire entre le taux de consommation du pr´ edateur et la densit´ e de la proie, autrement dit la pr´ edation est proportionnelle ` a l’abondance de la
L’un des principaux enjeux de ma th`ese ´etait de r´ealiser des simulations nu- m´eriques de galaxies en gravitation modifi´ee. Par le caract`ere non-lin´eaire de cette gravit´e,
Finally, the effects of temperature change are monetized based on one or more functions that translate the physical impacts associated with temperature increase into economic
The group's pedagogy is to engage faculty and students in research focused on the relationship between design computing and the physical output of information
