HAL Id: hal-02457288
https://hal.univ-lorraine.fr/hal-02457288
Submitted on 27 Jan 2020
HAL is a multi-disciplinary open access
archive for the deposit and dissemination of
sci-entific research documents, whether they are
pub-lished or not. The documents may come from
teaching and research institutions in France or
abroad, or from public or private research centers.
L’archive ouverte pluridisciplinaire HAL, est
destinée au dépôt et à la diffusion de documents
scientifiques de niveau recherche, publiés ou non,
émanant des établissements d’enseignement et de
recherche français ou étrangers, des laboratoires
publics ou privés.
Granite microporosity changes due to fracturing and
alteration: secondary mineral phases as proxies for
porosity and permeability estimation
Martin Staněk, Yves Géraud
To cite this version:
Martin Staněk, Yves Géraud. Granite microporosity changes due to fracturing and alteration:
sec-ondary mineral phases as proxies for porosity and permeability estimation. Solid Earth, European
Geosciences Union, 2019, 10 (1), pp.251-274. �10.5194/se-10-251-2019�. �hal-02457288�
https://doi.org/10.5194/se-10-251-2019
© Author(s) 2019. This work is distributed under the Creative Commons Attribution 4.0 License.
Granite microporosity changes due to fracturing and alteration:
secondary mineral phases as proxies for porosity
and permeability estimation
Martin Stanˇek1and Yves Géraud2
1Institute of Geophysics, Czech Academy of Sciences, Prague, 14131, Czech Republic 2GeoRessources Laboratory, University of Lorraine, Nancy, 54500, France
Correspondence: Martin Stanˇek ([email protected])
Received: 4 October 2018 – Discussion started: 30 October 2018
Revised: 18 December 2018 – Accepted: 10 January 2019 – Published: 4 February 2019
Abstract. Several alteration facies of fractured Lipnice gran-ite are studied in detail on borehole samples by means of mer-cury intrusion porosimetry, polarized and fluorescent light microscopy, and microprobe chemical analyses. The goal is to describe the granite void space geometry in the vicinity of fractures with alteration halos and to link specific geometries with simply detectable parameters to facilitate quick estima-tion of porosity and permeability based on, for example, drill cuttings. The core of the study is the results of porosity and throat size distribution analyses on 21 specimens represent-ing unique combinations of fracture-related structures within six different alteration facies basically differing in secondary phyllosilicate chemistry and porosity structure. Based on a simple model to calculate permeability from the measured porosities and throat size distributions, the difference in per-meability between the fresh granite and the most fractured and altered granite is 5 orders of magnitude. Our observa-tions suggest that the porosity, the size of connecobserva-tions and the proportion of crack porosity increase with fracture den-sity, while precipitation of iron-rich infills as well as of fine-grained secondary phyllosilicates acts in the opposite way. Different styles and intensities of such end-member agents shape the final void space geometry and imply various com-binations of storage, transport and retardation capacity for specific structures. This study also shows the possibility to use standard mercury intrusion porosimetry with advanced experimental settings and data treatment to distinguish im-portant differences in void space geometry within a span of a few percent of porosity.
1 Introduction
The void space in granitic rocks is localized in faults, frac-tures and adjacent damage zones characterized by elevated microfracture density (Kranz, 1983; Scholz et al., 1993; Ver-milye and Scholz, 1999; Zang et al., 2000; Bertrand et al., 2018) or in volumes altered by metamorphic, hydrother-mal and weathering processes (Jamtveit et al., 2008, 2009, 2011; Wyns et al., 2015; Walter et al., 2018). Both frac-turing and alteration modify the granite void space geome-try and thus affect its physical properties including poros-ity, permeabilporos-ity, thermal conductivity and retardation capac-ity (Benson et al., 2006; Brace et al., 1968; Géraud, 1994; Rosener and Géraud, 2007; Schild et al., 2001; Yoshida et al., 2009; Zoback and Byerlee, 1975). Understanding the im-pact of these processes on granite is important for safe and sustainable management of geothermal projects (Géraud et al., 2010; Moeck, 2014), drinking water resources (Banfield and Eggleton, 1990; Lachassagne et al., 2011) and hydrocar-bon reservoirs (Gutmanis, 2009; Trice, 2014) as well as of disposal of hazardous waste (Hooper, 2010; Rempe, 2007). Microstructural evolution during the different kinds of strain affecting the granite is linked to porosity modifications and permeability variations. The objectives of this paper are in the first step to define these links and in the second step to de-velop a chart linking the different chemical compositions of the phyllosilicate phases and the reservoir properties (poros-ity and permeabil(poros-ity).
Brittle fracturing is associated with formation of low as-pect voids (fractures sensu lato) enhancing permeability even at low porosities mainly dependent on the degree of
intercon-252 M. Stanˇek and Y. Géraud: Granite microporosity changes due to fracturing and alteration
nection within the fracture network (Long and Witherspoon, 1985). On the contrary, further mechanical disintegration by fault wear processes produces fine-grained gouge and there-fore low threshold size and connectivity impeding permeabil-ity (Géraud et al., 1995, 2006; Bense et al., 2013). Fracturing may be accompanied or succeeded by fracture wall dissolu-tion or precipitadissolu-tion due to chemically active fluids within the fracture network (Boyce et al., 2003; Ferry, 1979; Mazurier et al., 2016; Nishimoto and Yoshida, 2010), which may ei-ther increase or decrease the porosity and threshold size (Géraud et al., 2010; Katsube and Kamineni, 1983; Yoshida et al., 2009). Also, volumetric expansion related to alteration of primary sheeted silicates such as biotite may induce lo-cal stress variations producing fractures (Lachassagne et al., 2011). Conceptual models of porosity and permeability dis-tribution in complex fracture or fault zones have been drawn to account for a variety of conductive and sealing structures (Bense et al., 2013; Caine et al., 1996; Evans et al., 1997; Faulkner et al., 2010, 2011; Mitchell and Faulkner, 2009; Wilson et al., 2003). Porosity–permeability relations of these structures are not straightforward since permeability depends on the pore–throat arrangement and scales linearly with the porosity and by power law with the characteristic thresh-old size (Bernabé et al., 2003; David et al., 1994; Katz and Thompson, 1987; Wardlaw et al., 1987).
In order to better understand the impact of the abovemen-tioned processes on the void space geometry of a low poros-ity granitic rock, we investigated the structure, composition and porosity parameters of drill core samples representing various fracture and alteration settings of the late Variscan Lipnice granite (Bohemian Massif, central Europe). We have (1) characterized the optical and chemical properties of prin-cipal alteration phases by polarized light and electron analyt-ical microscopy, (2) imaged representative void space struc-tures by fluorescent light microscopy of epoxy-saturated thin sections and (3) quantified in detail the related variations in connected total and free porosity and pore throat size distri-bution by mercury injection tests.
2 Tested granite
2.1 Geological setting of the Lipnice granite
We collected samples of a 150 m deep drill core (4.5 cm in diameter) of the MEL-5 borehole (located at lat 49.620716, long 15.410324) previously drilled in the Lipnice granite within the Melechov pluton (MP), Czech Republic, that has been chosen by the Czech Radioactive Waste Repository Au-thority (RAWRA) as a research training site. The MP rep-resents the northernmost outcropping part of the NE seg-ment of the Moldanubian batholith, which belongs to the deeply eroded high grade orogenic root of the eastern part of the European Variscan orogen, the Moldanubian Zone, within the Bohemian Massif (Fig. 1a). This segment of the
Moldanubian batholith is chiefly made up of late-orogenic “Eisgarn” granites emplaced at 330–300 Ma (Bankwitz et al., 2004; Breiter and Sulovský, 2005; Gerdes et al., 2003; Schul-mann et al., 2008; Verner et al., 2014; Žák et al., 2011, 2014) and is hosted by cordierite-bearing migmatites and migma-tized paragneisses recording peak metamorphic conditions 670–750◦C and 0.5 GPa at the contact with the MP (Schul-mann et al., 1998). The MP has an elliptical map outline of 10 km × 14 km, reaches to a depth of 6–15 km (Šrámek et al., 1996; Trubaˇc et al., 2014) and outcrops as four pera-luminous two-mica granites disposed in a concentric man-ner (Fig. 1b). The granites have similar chemical and modal compositions with higher SiO2content, lower modal
propor-tion of biotite and higher grain size towards the pluton cen-ter (Harlov et al., 2008; Matˇejka and Janoušek, 1998). The sampled Lipnice granite is the external, southeasterly off-center unit intimately associated with the host rock by grad-ual granite–migmatite contacts, frequent paragneiss enclaves or strongly anisotropic structure marked by biotite schlieren in the granite (Stanˇek et al., 2013) and frequent melt pock-ets or granite dikes in the host rock. The average grain size of the Lipnice granite is 0.7 mm and its modal content is 33 %–35 % quartz, 29 %–33 % plagioclase, 17 %–22 % K-feldspar, 6 %–9 % muscovite and 5 %–9 % biotite (Procházka and Matˇejka, 2004; Stanˇek et al., 2013). Accessory miner-als include ilmenite, zircon, monazite, sillimanite and fluor-apatite (Harlov et al., 2008; Procházka and Matˇejka, 2004).
The fracture system of the MP consists of 5 fracture sets (Lexa and Schulmann, 2006; Stanˇek, 2013) also recognized within the borehole (Fig. 1c and d). The most regularly de-veloped fractures at the scale of the pluton belong to two steep and mutually orthogonal sets (sets 1 and 2) of joints re-lated to postmagmatic cooling-induced shrinkage. Fractures of set 1 strike WNW–ESE, their size ranges from meters to tens of meters and their spacing is on the order of meters. Fractures of set 2 strike NNE–SSW, terminate on fractures of set 1 and their size and spacing are approximately 1 order of magnitude lower than for set 1. In quarries and on out-crops within a kilometer from the studied borehole the set 2 fractures appear in clusters spaced by one to several tens of meters, with each cluster containing fractures with spacing on the order of centimeters to decimeters. Commonly for set 2 and set 4 fractures, a detailed analysis of the fracture dis-tribution within the MEL-5 borehole (Lexa and Schulmann, 2006) shows a bimodal distribution of spacing with one peak on the order of millimeters to centimeters and the other on the order of meters to tens of meters. The set 3 fractures are the least abundant in terrain and are represented by moder-ately to gently dipping conjugated fractures of approximmoder-ately NW–SE strike, and size and spacing on the order of meters. The set 4 fractures terminate on fractures of sets 1 and 2 and are represented by steep, NNW–SSE to N–S striking faulted joints or faults with size, spacing and clustering similar to set 2. The set 5 fractures are represented by subhorizontal to gently dipping sheeting joints with a size on the order of
me-Figure 1. Maps showing the location of the sampled borehole. (a) Simplified geological map of the Bohemian Massif (modified after Franke 2000) 1: Saxothuringian and Lugian, 2: Teplá–Barrandian, 3: Variscan granitoids, 4: Moldanubian batholith, 5: Gföhl assemblage, 6: Drosendorf and Ostrong assemblage, 7: Brunovistulian, and 8: Cretaceous sedimentary cover; (b) geological map of the Melechov pluton (modified after Machek, 2011) with gr. representing granite and u. representing unit; (c) stereoplot (Schmidt projection) of the fracture sets recognized within the Melechov pluton based on Lexa and Schulmann (2006) and Stanˇek (2013); (d) interpretative schematic sketch of the fracture sets and their structural relationship with respect to the alteration facies distribution within the borehole.
ters and spacing progressively increasing with depth by 1 or 2 orders of magnitude over several tens of meters as observed on the deepest exposed quarry walls.
2.2 Fracture and alteration setting of core samples The fracture density in the borehole was measured based on acoustic and optical borehole data and direct observation of the core (Lexa and Schulmann, 2006). At the scale of the borehole, the fracture density (FD) distribution varies be-tween 0.2 and 12 m−1 and there is a complex zonation of the fracture-related alteration (Fig. 2). The majority of frac-tures is concentrated within the first 60 m below land surface (b.l.s.) corresponding to the vertical extent of densely spaced sheeting joints (Lexa and Schulmann, 2006). In this segment the FD is dominantly higher than 1 m−1, there are four frac-ture corridors with FD between 3 and 12 m−1and most of the fractures are associated with pale pink to red alteration halos extending several centimeters to the fracture walls and with dark red to brown fracture infills dominantly less than 3 mm thick. In addition, three major fracture corridors (FD>5 m−1) feature distinct colors of the granite matrix and fracture in-fills: pale brown matrix and dark brown infills (0–5 m b.l.s.), pale yellow matrix and green infills (21–23 m b.l.s.), and pale
green matrix and green infills (42–57 m b.l.s.). In contrast, the lower segment of the borehole (60–150 m b.l.s.) is character-ized by FD dominantly lower than 1 m−1and by two fracture corridors with FD between 3 and 4 m−1. Also, the alteration character is remarkably different: the granite near fractures has a gray color similar to the granite far from fractures and the fractures are dominantly barren.
We collected core pieces from 4 to 40 cm long represen-tative of the macroscopically different fracture and alteration settings as follows (cf. Fig. 2). The gray granite with no frac-tures, hereafter referred to as “fresh granite”, represented by sample 11 corresponds to the least fractured and altered gran-ite within the sample collection. According to the acoustic and optical borehole images (Lexa and Schulmann, 2006) and direct observation of the core, the closest fracture was at a distance of 2 m from the sample. The gray granite dis-tant several centimeters from fractures, hereafter referred to as “fractured granite”, is represented by the fresh parts (be-yond the pink alteration halos of fractures) of samples 3 and 5. The gray granite adjacent to barren fractures, hereafter re-ferred to as “weakly altered granite”, is represented by sam-ple 10. The pink granite occurring in the alteration halos of the majority of fractures in the upper part of the borehole (hereafter referred to as “pink granite”) is represented by the
254 M. Stanˇek and Y. Géraud: Granite microporosity changes due to fracturing and alteration
Figure 2. Fracture and alteration setting of samples. (a) Borehole log showing fracture density distribution (modified after Lexa and Schul-mann, 2006), macroscopic alteration zones and position of samples. The pole diagrams (Schmidt projection) show orientation of fractures in the vicinity of samples with the depth range defined by the rectangles at the right side of the log (based on the acoustic borehole image, not available for the uppermost 22.5 m); (b) photographs of the samples.
altered volume of samples 3, 4 and 5. In terms of fracture-related structures, the latter samples represent a single frac-ture wall, a fracfrac-ture corridor and a highly porous fracfrac-ture in-fill, respectively. The pale green granite associated with the fracture corridor at 50 m b.l.s., hereafter referred to as “green granite”, is represented by sample 9. The pale yellow granite associated with the fracture corridor at 22 m b.l.s., hereafter referred to as “yellow granite”, is represented by samples 7 and 6. The latter samples represent a fracture corridor and a fault gouge, respectively. The pale brown granite occurring in the uppermost part of the borehole (hereafter referred to
as “brown granite”) is represented by samples 1 and 2 col-lected near a single fracture and within a fracture corridor, respectively.
3 Methodology
3.1 Thin sections for optical and electron microscope analyses
For light and electron microscopy, we prepared thin sec-tions 2.5 cm × 3.5 cm in size from slab specimens
vacuum-impregnated with epoxy resin containing fluorescent dye. For fracture-related samples, the sections were oriented perpen-dicular to the master fracture plane and immediately adjacent to or comprising the fracture surface(s).
Photographs of thin sections documenting the optical min-eral properties and the connected microporosity distribution were acquired under polarized light (PL), cross-polarized light (XPL) and green fluorescent light (FL) using a petro-graphic microscope equipped with digital camera. To im-prove the contrast of the acquired FL images, only the green channel was used and converted to gray scale.
Point chemical composition analyses and elemental maps were acquired from the thin sections by an electron micro-probe (Cameca SX100, GeoRessources laboratory, Nancy, France) using a focused electron beam of 1 µm diameter with an accelerating voltage of 15 kV and a beam current of 12 nA. The standards used for calibration of elements Si, Al, Ti, Cr, Fe, Mn, Mg, Ca, Na and K were albite (Si, Na), corundum (Al), hematite (Fe), forsterite (Mg), pyrophanite (Ti, Mn), andradite (Ca), orthoclase (K) and Cr2O3(Cr).
3.2 Specimens for porosimetry
From the core samples, we prepared ∼ 40 specimens for mer-cury injection porosimetry (MIP) in order to account for spe-cific fracturing and alteration features in different portions of the samples and we selected 21 of them for this paper in order to depict both the general trends and the variabil-ity of each facies (Fig. 3). One specimen represents the fresh granite (11) and one the non-altered fractured granite (3_1). Two specimens represent the weakly altered granite with one comprising the barren fracture surface (10_1), while from the other (10_2) a superficial layer (ca. 1 mm thick) of the frac-ture surface was ground off prior to the analysis. Three spec-imens represent the green granite: 9_7 represents the matrix with only a thin and dominantly sealed fracture contained within the specimen, 9_4 a clay-rich fracture surface and 9_1 a cohesive partially open fracture. Three specimens represent the yellow granite in a fracture corridor: 7_3 represents the matrix, 7_1 a clay-rich fracture surface and 7_10 a cohesive partially open fracture. One specimen represents the yellow granite fault gouge (specimen 6). Three specimens represent the pink granite near a single fracture: 3_2 represents the ma-trix, 5_3 a macroscopically porous fracture surface and 5_5 a cohesive partially open fracture. Two specimens were pre-pared from the pink granite in a fracture corridor with one comprising macroscopically nonporous iron-oxide-rich frac-ture surface (4_1), while from the other (4_2) the iron-oxide-rich material (less than 1 mm thick) was ground off prior to the analysis. Two specimens represent the brown granite near a single fracture: 1_2 represents the matrix and 1_1 a frac-ture surface with iron-oxide-rich material. Three specimens represent the brown granite in the fracture corridor: 2_2 rep-resents the matrix with little macroscopic porosity, 2_3 the matrix with frequent macroscopic cavities and 2_1 a
com-bination of a cohesive partially open fracture and a fracture surface with iron-oxide-rich material.
3.3 Mercury injection porosimetry (MIP)
MIP was used to measure the connected total and free poros-ity, the throat size distribution and the bulk density. The term “throat” reflects a simplified scheme of the rock pore space made up of large spaces referred to as pores, which are connected by smaller spaces or constrictions referred to as throats (Wardlaw et al., 1987). Since the MIP re-sults represent the core of our study, it is appropriate to de-scribe the fundaments and some detailed aspects of the ex-perimental protocol. The MIP takes advantage of the fact that mercury is an electrically conductive nonwetting liquid with respect to many solids including common rocks. Dur-ing the experiment, mercury is forced into the voids of air-evacuated specimen by stepwise application of external pres-sure. At each pressure increment the increment of mercury volume intruded into the specimen is calculated from mea-sured changes in electrical capacitance of the metal-coated stem of a penetrometer (specimen holder) due to the re-placement of mercury by electrically nonconductive air or oil (Fig. 4a). The relation between the size of the access to the voids and the pressure applied on mercury is based on the Young–Laplace Eq. (1):
D =−4γ cos θ
p , (1)
where D (m) is the diameter of a pipe pore or the half-size of the smaller dimension of a crack pore (Lenormand et al., 1983; Washburn, 1921), γ is the mercury surface ten-sion (485 dyn cm−1), θ is the contact angle between mercury and solid (130◦) and p is the pressure (Pa). Taking into ac-count the minimum and maximum pressure enabled by the porosimeter (Micromeritics AutoPore IV), the resulting vol-ume vs. throat-size curves cover a throat-size range from 300 µm (which corresponds to the vacuum at the start of the experiment) down to 5 nm at the highest pressure. For easier visual interspecimen comparison of the throat size distribu-tions we plotted the results by means of incremental curves calculated from the initial cumulative values.
It has been demonstrated that if large pores are accessible by small throats, the mercury forced into the pore remains in it after the mercury pressure is decreased to atmospheric pressure (Wardlaw and McKellar, 1981; Yu and Wardlaw, 1986a, b). To take advantage of this phenomenon called trap-ping, the MIP was executed in three phases (Fig. 4b): (I) in-trusion – the pressure increases from vacuum to the maxi-mum, (II) extrusion – the pressure decreases down to atmo-spheric and (III) reintrusion – it increases again to the maxi-mum value. The volume of intruded mercury after the intru-sion corresponds to the total connected porosity (stage C in Fig. 4c). The volume that remains in the specimen at ambi-ent pressure at the end of the extrusion corresponds to the
256 M. Stanˇek and Y. Géraud: Granite microporosity changes due to fracturing and alteration
Figure 3. (a) Photographs and parametric description of specimens tested by mercury porosimetry grouped by alteration facies. The dashed lines delimit subgroups of specimens from lower (minus symbol) and higher (plus symbol) fracture density zones; (b) schematic sketch of rock cores and sampled materials showing in a simplified way the position of the specimens within the core samples. Specimens indexed with “R” were selected as representative of the matrix of the facies. Alt.: alteration, fr.: fracture.
trapped porosity represented by pore–throat arrangements with low throat-to-pore size ratio. Analogously, voids with high throat-to-pore size ratio, including cracks, are free of mercury at this stage since they do not entrap mercury (stage D in Fig. 4c). Finally, when the pressure is increased again, the mercury can intrude only voids where trapping has not occurred and thus intrudes the free porosity only. Since the mercury reintrusion is technically available during the high pressure analysis only, the free porosity values represent only the microporosity of the specimens. Consequently, to exam-ine the relation between the amount of free porosity and per-meability calculated using the model of Katz and Thomp-son (1986, 1987), porosity and median throat-size values cal-culated from the microporosity throat-size range were used as input for the permeability model.
3.4 Permeability measurements
To show the consistency of the calculated permeabilities with experimentally obtained values we present summarized re-sults of permeability measurements. A nitrogen gas perme-ameter was used working with 1 MPa confining pressure. Samples were plugs 17 mm in diameter and 16–20 mm in length. At least three measurements per sample at different
constant head pressures <1 MPa were used for Klinkenberg correction to obtain the real permeability value. See Stanˇek (2013) for theoretical and experimental details.
4 Results
4.1 Microstructural and mineral optical properties The fresh granite features magmatic microstructures with grain size and shape parameters corresponding to the anal-ysis of Stanˇek et al. (2013). Quartz features an undulatory extinction. K-feldspar features Carlsbad twins and perthite and myrmekite exsolutions. Muscovite is remarked by higher than average grain size. Plagioclase features albite twins. Bi-otite is euhedral and features strong pleochroism from dark reddish-brown to yellowish-brown colors, interference colors of the third order, straight and fine or absent cleavage planes, and encloses euhedral grains of ilmenite, zircon and mon-azite (Fig. 5a). The magmatic assemblage features very weak alteration represented by partial or rarely complete chloriti-zation of the minority of biotite grains and by illite in plagio-clase grains. The chloritization is demonstrated by an irregu-lar alternation of biotite and chlorite lamellae within the for-mer biotite outline with the lamellae typically having a width
Figure 4. Mercury porosimetry; (a) schematic drawing of a penetrometer (specimen holder); (b) plot of an idealized cumulative porosimetric curve to explain the measurement of connected total, trapped and free porosity by mercury reintrusion, A–D relate to (c); (c) schematic drawings of void spaces in a rock specimen to explain the phenomenon of mercury entrapment with respect to different arrangements of throats in relation to pores. DT: throat diameter, DP: pore diameter.
(perpendicular to the basal planes) of 1/2 to 1/5 of the to-tal width of the outline. The shape of the partially chloritized grains is as a consequence modified due to the spiky tips of the chlorite lamellae. This chlorite (hereafter referred to as “chlorite 0”) lamellae are characterized by curvilinear cleav-age planes, by moderate pleochroism from pale green to pale brown and by the first order lavender blue interference color and are associated with infrequent fine-grained secondary K-feldspar, rutile and epidote (Fig. 5b). The illite dominantly occurs in the central part of plagioclase grains as isolated fine grains aligned with the plagioclase cleavage planes and fea-tures interference colors from the beginning of the first order to the beginning of the second order (Fig. 6e).
The fractured granite shows similar microstructural and mineral optical properties as the fresh granite and differs from the latter by higher crack density (see the next section for details).
The weakly altered granite is characterized by complete chloritization of the former biotite grains at a distance of less than 2 cm from the fracture surface. This chlorite (hereafter referred to as “chlorite 1”) has similar optical properties as chlorite 0 except that the interference colors also comprise the first order light yellow in addition to the lavender blue colors (Fig. 5c). The chlorite 1 grains often feature lenticu-lar lamellae and within the former biotite outline there are numerous fine grains of secondary K-feldspar and rutile.
The green granite is characterized by complete chloritiza-tion of biotite, by minor illitizachloritiza-tion of the chlorite, by
ma-jor illitization of plagioclase and by illite infills of fractures. Minor parts of some of the chlorite grains have similar opti-cal properties as chlorite 1, whereas the chlorite in the green granite (hereafter referred to as “chlorite 2”) dominantly fea-tures very weak to no pleochroism associated with a very pale brownish color and a first order light yellow interfer-ence color (Fig. 5d). In addition, both in PL and XPL, the appearance of the chlorite 2 grains seems to be biased to-wards darker colors due to homogeneously distributed dark red particles less than 1 µm in size. The minority of chlorite 2 grains microstructurally unrelated to a fracture feature par-tial recrystallization to fine-grained illite (Fig. 6a). At places where illite-filled fracture cuts a chlorite grain, a part of it near (100 µm) the fracture is illitized (Fig. 6b). The illite in plagioclase occurs in fan-shaped aggregates distributed along the plagioclase cleavage planes (Fig. 6f). The illite grains filling fractures do not feature a shape-preferred orientation (Fig. 6c). Whereas some of the fractures or some parts of them are filled with illite only, other fractures or other parts of the fractures feature illite at the granite walls and dark red, probably amorphous, material in their central parts. Some of the largest parts of the fractures filled with the dark red ma-terial feature circular to elongated cavities in the center.
The brown granite is characterized by complete chloritiza-tion of biotite and by moderate illitizachloritiza-tion of plagioclase. The chlorite in the brown granite (hereafter referred to as “chlo-rite 3”) features strong pleochroism from a dark green to pale brown color and the third order interference colors (Fig. 5e).
258 M. Stanˇek and Y. Géraud: Granite microporosity changes due to fracturing and alteration
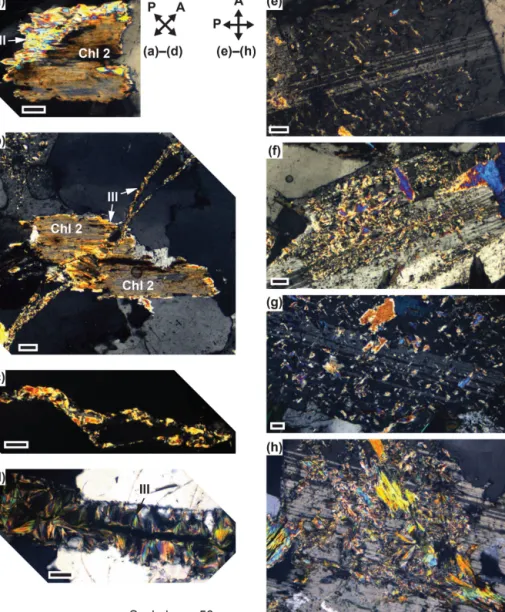
Figure 5. Polarized light photomicrographs showing optical properties of biotite and its alteration products. The double-headed arrows show polarization direction of polarizer (P) and analyzer (A) for each column; (a) biotite and (b) biotite partially replaced by chlorite (Chl 0) in fresh granite; (c) chlorite (Chl 1) in weakly altered granite; (d) chlorite (Chl 1 and Chl 2) in green granite; (e) chlorite (Chl 3) in brown granite; (f, g) chlorite (Chl 4) and illite in yellow granite. Bt: biotite, Kf: K-feldspar, Ep: epidote, Rut: rutile and Ill: illite.
The chlorite 3 grains feature open cleavage planes with large (50–100 µm) grains of secondary rutile and fine (10–50 µm) grains of secondary K-feldspar. The minority of the chlorite 3 grains feature illitized lamella tips. The illitization of the plagioclase in the brown granite is characterized by a homo-geneous distribution of isolated fine grains of illite aligned with the plagioclase cleavage planes (Fig. 6g).
The yellow granite is characterized by complete chloriti-zation of biotite, by minor to major illitichloriti-zation of the chlorite, by major illitization of plagioclase and by illite infills of frac-tures. The pseudomorphs after biotite in the yellow granite are composed of chlorite (hereafter referred to as “chlorite
4”) and illite with the illite occupying from approximately 10 % to 90 % of the area within the former biotite outline. The chlorite 4 lamellae feature moderate pleochroism from olive green to pale brown and third order interference col-ors, whereas the illite lamellae are colorless in PL and feature second order interference colors (Fig. 5f). The pseudomorphs with the lowest illite proportion are characterized by irregu-lar alternation of chlorite and illite lamellae typically having a width of 1/10 to 1/20 of the total width of the pseudo-morph and feature illitized tips of the chlorite 4 lamellae. In pseudomorphs with the highest proportion of illite, irregular lamellae-like regions with a similar green color to chlorite 4
Figure 6. Polarized light photomicrographs showing microstructural position of illite. The double-headed arrows show polarization direction of polarizer (P) and analyzer (A). Partial chlorite (Chl 2) illitization unrelated (a) and related (b) to illite-filled crack (c) in green granite; (d) illite-filled crack in yellow granite; (e) isolated grains of illite in the core of plagioclase in fresh granite; (f) connected fan-shaped aggregates of illite aligned with plagioclase cleavage in green granite; (g) isolated grains of illite homogeneously distributed in plagioclase in brown granite; (h) aggregates of illite in plagioclase in yellow granite. Ill: illite.
occur, though with no pleochroism and partially dimmed in XPL independent of the orientation with respect to the po-lars (Fig. 5g). The pseudomorphs also feature secondary ru-tile and infrequent K-feldspar. The illite grains in fractures occur with their basal planes perpendicular to the fracture walls or in fan-shaped aggregates radiating from the frac-ture walls (Fig. 6d). The illite in plagioclase occurs in irreg-ular and interconnected aggregates containing grains of vari-ous sizes from undistinguishable under a light microscope to about 100 µm (Fig. 6h).
The pink granite is characterized by orange-red infills of cracks cutting an otherwise unaltered microstructure charac-teristic of the fresh granite.
4.2 Connected porosity structure
As observed in thin sections using FL microscopy, the con-nected porosity of the studied granite is mainly made of cracks (low aspect ratio), pores (high aspect ratio) and dis-tributed porosity within fine-grained phyllosilicate-rich ag-gregates. We distinguish the following types of cracks. A “Granular crack” terminates within or on the grain bound-aries. “Cleavage crack” is a granular crack parallel to mineral cleavage. “Grain boundary crack” follows grain boundaries and its length typically does not exceed 2 times the average grain size. “Intergranular crack” is a continuous compound of the other types of cracks.
260 M. Stanˇek and Y. Géraud: Granite microporosity changes due to fracturing and alteration
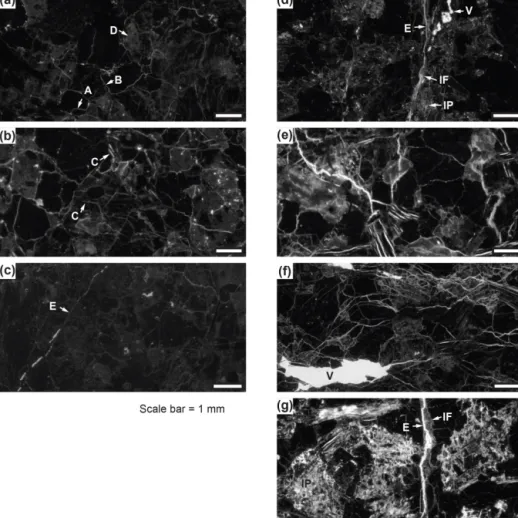
Figure 7. UV-fluorescent light photomicrographs showing microstructural position of connected porosity. Representative situations for fresh granite and pink granite near a single fracture (a), for fractured and weakly altered granite (b), for pink granite in a fracture corridor (c), for green granite (d), for brown granite near a single fracture (e), for brown granite in a fracture corridor (f) and for yellow granite in a fracture corridor (g). D: distributed porosity in plagioclase, B: grain boundary crack, A: intragranular crack, C: cleavage crack, E: intergranular crack, V: cavity, IF: illite infills in fracture and IP: illite aggregate in plagioclase.
In the fresh granite, the connected porosity is restricted to isolated grain boundary and granular cracks and scarce phyl-losilicate aggregates in plagioclase grains (Fig. 7a). Com-pared to the latter, the fractured and the weakly altered gran-ite show more frequent cracks of all types associated with intergranular cracks made of short segments of various ori-entations (Fig. 7b). Within the pink granite, the connected porosity in the single fracture-related samples occurs in the same structural positions as in the fresh granite, while in the fracture-corridor-related sample the porosity also occurs in infrequent intergranular cracks (Fig. 7c). In the green granite, the connected porosity dominantly occurs in intergranular cracks, in the illite aggregates in plagioclase, in the illite in-fills of fractures and in the cavities associated with the largest fractures (Fig. 7d). The connected porosity in the single fracture-related brown granite occurs in the same structural positions as in the fractured granite and in frequent intergran-ular cracks (Fig. 7e). The connected porosity in the
fracture-corridor-related brown granite also occurs in elongated cavi-ties of tens to hundreds of microns in size, which dominantly occur at a distance of less than 1 cm from the master frac-ture surface to which they are subparallel (Fig. 7f). Within the yellow granite, the connected porosity occurs in frequent cracks of all types and also in the illite infills of fractures and in the illite aggregates in plagioclase (Fig. 7g).
4.3 Chemical composition of minerals
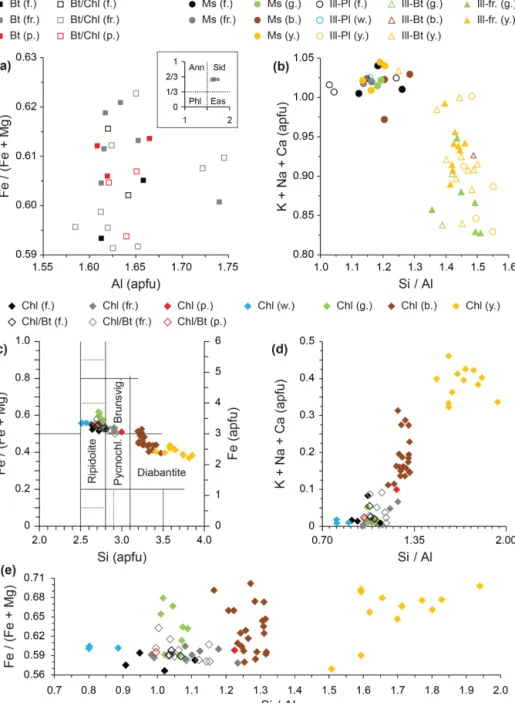
Selected aspects of the chemical analyses are plotted on graphs in Fig. 8 and averaged representative analyses includ-ing structural formulae of the principal alteration phases are shown in Table 1.
For all facies with biotite (fresh, fractured and pink gran-ite), the compositions of unaltered biotite grains as well as of biotite lamellae in partially chloritized grains fall in the field of siderophyllite of the biotite classification graph (Fig. 8a).
T able 1. A v eraged representati v e analyses and structural formulae of the principal alteration phases. n: number of analyses, F ac.: facies, Min.: minera l phase, P inter : sum of interlayer cations (Ca + Na + K), Fe#: Fe number (Fe / [Fe + Mg ]), frac.: fractured, g.: green, b .: bro wn, y.: yello w , w .: weakly altered, p.: pink, Ms: musco vite, Ill-Pl: illite in plagioclase, Ill-Bt: illite in biotite, Bt: biotite, Bt / Chl: biotite lamella in biotite-chlorite, Chl: chlorite and Chl / Bt: chlorite lamella in biotite-chlorite. n F ac. Min. SiO 2 Al 2 O3 T iO 2 MnO FeO MgO CaO Na 2 O K2 O T otal Si Al VI T i Mn Fe Mg Ca Na K Si / Al P inter Fe# 3 fresh Ms 46.4 33.1 0.4 0.0 1.8 1.2 0.0 0.3 11.4 94.6 3.13 1.77 0.02 0.00 0.10 0.12 0.00 0.04 0.98 1.19 1.02 0.45 2 frac. Ms 45.8 33.8 1.1 0.1 1.5 1.1 0.0 0.6 11.0 95.0 3.08 1.76 0.06 0.00 0.08 0.11 0.00 0.07 0.94 1.15 1.02 0.43 2 g. Ms 45.8 32.7 1.0 0.0 1.4 1.2 0.0 0.5 11.0 93.5 3.12 1.75 0.05 0.00 0.08 0.12 0.00 0.06 0.96 1.19 1.02 0.41 4 b . Ms 46.5 32.6 1.6 0.0 1.6 1.4 0.0 0.4 11.2 95.2 3.12 1.70 0.08 0.00 0.09 0.14 0.00 0.05 0.96 1.21 1.01 0.39 4 y. Ms 45.9 33.2 0.8 0.0 1.4 1.1 0.0 0.5 11.2 94.0 3.11 1.77 0.04 0.00 0.08 0.11 0.00 0.06 0.97 1.17 1.03 0.41 3 fresh Ill-Pl 46.4 35.9 0.1 0.0 1.4 0.6 0.0 0.2 11.7 96.3 3.07 1.87 0.01 0.00 0.08 0.06 0.00 0.03 0.98 1.11 1.02 0.53 1 w . Ill-Pl 46.4 34.0 0.1 0.0 1.3 1.2 0.0 0.5 11.2 94.7 3.12 1.81 0.01 0.00 0.08 0.12 0.00 0.06 0.96 1.16 1.03 0.39 5 y. Ill-Pl 49.8 28.0 0.1 0.0 2.1 2.1 0.1 0.2 9.9 92.3 3.41 1.67 0.00 0.00 0.12 0.21 0.01 0.02 0.86 1.51 0.90 0.36 2 g. Ill-Bt 49.5 29.9 0.1 0.0 2.0 2.0 0.0 0.0 10.0 93.5 3.34 1.72 0.00 0.00 0.11 0.20 0.00 0.01 0.86 1.40 0.87 0.35 1 b . Ill-Bt 50.5 28.8 0.2 0.0 2.6 2.2 0.1 0.0 10.8 95.3 3.37 1.64 0.01 0.00 0.15 0.22 0.01 0.00 0.92 1.49 0.93 0.40 11 y. Ill-Bt 49.2 29.2 0.5 0.0 2.2 2.1 0.2 0.1 10.5 93.8 3.33 1.65 0.02 0.00 0.12 0.21 0.01 0.01 0.91 1.43 0.93 0.37 6 g. Ill 49.6 28.9 0.0 0.0 1.9 2.0 0.2 0.0 9.8 92.4 3.38 1.70 0.00 0.00 0.11 0.20 0.01 0.01 0.85 1.46 0.87 0.34 9 y. Ill 49.3 29.3 0.1 0.0 1.8 2.0 0.1 0.1 10.6 93.4 3.35 1.69 0.00 0.00 0.10 0.20 0.01 0.01 0.92 1.43 0.94 0.34 2 fresh Bt 35.3 18.1 3.0 0.2 21.0 7.9 0.0 0.1 10.2 95.8 2.71 0.35 0.18 0.01 1.35 0.90 0.00 0.01 1.00 1.66 1.01 0.60 2 fresh Bt / Chl 35.1 18.1 2.9 0.3 21.9 7.9 0.0 0.1 10.2 96.5 2.69 0.32 0.17 0.02 1.41 0.90 0.00 0.01 1.00 1.65 1.01 0.61 6 frac. Bt 34.7 18.1 2.8 0.2 21.9 7.8 0.0 0.1 10.3 96.0 2.68 0.33 0.16 0.02 1.42 0.90 0.00 0.01 1.01 1.63 1.03 0.61 9 frac. Bt / Chl 34.9 18.1 2.6 0.3 21.6 8.0 0.0 0.1 10.1 95.7 2.69 0.34 0.15 0.02 1.39 0.92 0.00 0.01 1.00 1.63 1.01 0.60 3 p. Bt 35.0 17.9 2.8 0.2 21.7 7.8 0.0 0.1 10.1 95.7 2.70 0.33 0.17 0.01 1.40 0.89 0.00 0.01 1.00 1.66 1.01 0.61 3 p. Bt / Chl 34.9 17.9 2.8 0.2 21.3 7.9 0.0 0.1 10.3 95.3 2.70 0.34 0.16 0.01 1.38 0.91 0.00 0.01 1.01 1.65 1.03 0.60 4 fresh Chl 0 25.5 21.8 0.1 0.3 29.0 11.8 0.0 0.1 0.1 88.6 2.70 1.43 0.01 0.02 2.58 1.87 0.00 0.02 0.01 1.00 0.03 0.58 3 fresh Chl 0 / Bt 25.4 20.6 0.2 0.4 29.8 11.5 0.1 0.0 0.1 88.1 2.74 1.35 0.01 0.03 2.69 1.85 0.01 0.01 0.01 1.05 0.03 0.59 9 frac. Chl 0 25.6 20.0 0.1 0.3 30.1 11.6 0.1 0.0 0.1 88.0 2.77 1.31 0.01 0.03 2.72 1.87 0.01 0.00 0.01 1.09 0.02 0.59 11 frac. Chl 0 / Bt 25.9 20.5 0.1 0.3 29.8 11.3 0.1 0.0 0.1 88.2 2.78 1.37 0.01 0.02 2.68 1.81 0.01 0.01 0.02 1.08 0.04 0.60 1 p. Chl 0 28.4 19.7 0.2 0.3 28.5 10.8 0.3 0.0 0.5 88.5 3.00 1.44 0.01 0.02 2.52 1.69 0.03 0.01 0.06 1.23 0.10 0.60 1 p. Chl 0 / Bt 25.2 21.5 0.1 0.3 30.3 11.5 0.0 0.1 0.1 89.2 2.69 1.38 0.01 0.03 2.69 1.83 0.00 0.01 0.01 1.00 0.02 0.60 3 w . Chl 1 24.8 25.4 0.1 0.3 30.3 11.2 0.0 0.0 0.0 92.1 2.53 1.59 0.00 0.02 2.59 1.71 0.00 0.01 0.00 0.83 0.01 0.60 8 g. Chl 2 25.1 20.3 0.1 0.2 31.6 10.3 0.1 0.0 0.1 87.6 2.74 1.35 0.01 0.02 2.88 1.68 0.01 0.01 0.01 1.05 0.02 0.63 21 b . Chl 3 31.8 21.3 0.1 0.2 24.7 8.1 0.6 0.0 0.8 87.7 3.29 1.87 0.01 0.02 2.14 1.25 0.06 0.01 0.11 1.27 0.19 0.63 12 y. Chl 4 35.0 17.6 0.1 0.2 24.3 7.1 0.6 0.1 2.3 87.4 3.64 1.80 0.01 0.02 2.11 1.10 0.07 0.02 0.30 1.69 0.39 0.66
262 M. Stanˇek and Y. Géraud: Granite microporosity changes due to fracturing and alteration
Figure 8. Chemical composition of analyzed minerals. (a) Biotite (Bt) and biotite lamella in chloritized biotite (Bt/Chl); (b) muscovite (Ms), illite in plagioclase (Ill-Pl), in pseudomorph after biotite (Ill-Bt) and in fracture (Ill-fr.); (c, d, e) chlorite (Chl) and chlorite lamellae in chloritized biotite (Chl/Bt), (c) classification diagram after Hey (1954). Atoms per formula unit (apfu) calculated based on 11 oxygens (a, b) and 14 oxygens (c, d, e). Facies – f.: fresh, fr.: fractured, p.: pink, g.: green, b.: brown, y.: yellow, w.: weakly altered. Ann: annite, Sid: siderophyllite, Phl: phlogopite, Eas: eastonite, Brunsvig.: brunsvigite and Pycnochl.: pycnochlorite.
For all facies, the grains of muscovite have a similar com-position (Fig. 8b). In terms of atoms per formula unit (apfu) of interlayer cations (K, Na, Ca) the grains of illite in pla-gioclase in the fresh and in the weakly altered granite have a composition similar to the muscovite. In the green, yellow and brown granite the illite grains contain fewer interlayer apfu and have higher Si/Al ratio as compared to muscovite. The illite in the yellow granite has more interlayer apfu than
that in the green granite and the two groups show a similar Si/Al ratio.
In the chlorite classification graph (Hey, 1954) the chlo-rite compositions dominantly fall in the fields of ripidolite, brunsvigite and diabantite (Fig. 8c). In the brown and the yellow granite the chlorite analyses show, respectively, up to 0.029 and 0.043 K+Na+Ca cation molar fractions corre-sponding to 0.31 and 0.46 apfu when recalculated based on 14 oxygens (Fig. 8d). The chlorites from the latter two facies
also feature a higher Si/Al ratio. In terms of Fe/(Fe + Mg), the chlorites and chlorite lamellae in the fresh, fractured and weakly altered granite feature a narrow span and the values of the former two are equal to or lower than those of the cor-responding biotites and biotite lamellae (Fig. 8e and a). In the green, brown and yellow granite the chlorites feature a larger span of Fe/(Fe + Mg) values that are mostly higher than for the fresh, fractured and weakly altered granite.
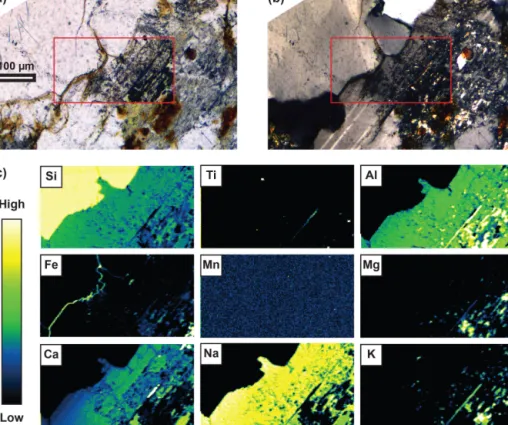
The red infill of fractures in the pink granite is rich in iron with no significant amount of other elements (Fig. 9). 4.4 Porosimetry
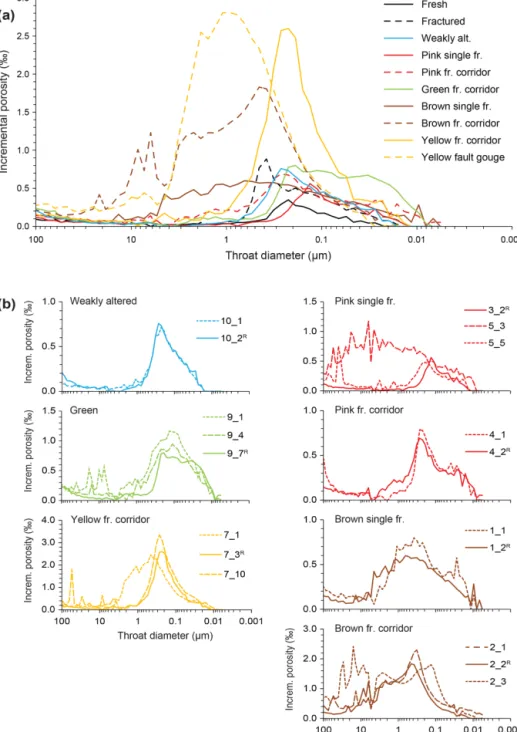
The measured throat size distributions (TSD) are plotted in Fig. 10 and the bulk specimen values of total porosity, free porosity, volumetric median throat size (MTS), bulk density and calculated permeability are plotted in Fig. 11.
The fresh granite features the narrowest TSD with signif-icant incremental porosity between approximately 0.02 and 0.4 µm (Fig. 10a), the lowest total porosity of 0.3 % and MTS of 0.23 µm (Fig. 11a).
Compared to the latter, the fractured and the weakly altered granite feature higher incremental porosities and broader TSDs with additional porosity accessible through throats of 0.2 to 0.8 µm in size (Fig. 10a). These two facies feature similar total porosities around 0.8 % and the MTS of the weakly altered granite of 0.21 µm is close to that of the fresh granite, while the fractured granite features a higher value of 0.27 µm. The two tested specimens of the weakly altered granite differing by the presence (10_1) or absence (10_2) of the superficial layer on the fracture surface do not differ significantly in terms of the TSD shape or the values of total porosity and of MTS (Fig. 10b).
Compared to the fractured granite, the matrix of the pink granite near a single fracture features a shift of the TSD to-wards smaller sizes with approximately 2 times lower MTS of 0.12 µm and lower total porosity of 0.5 %. However, the TSD of the pink granite near a single fracture may be very different when a porous fracture surface (5_3) or a par-tially open fracture (5_5) is included in the specimen and the macroporosity is taken into account (Figs. 10b and 11a). As compared to the matrix of the pink granite near a single fracture, the matrix of the pink granite in a fracture corridor features a shift of the TSD towards the larger sizes and ad-ditional porosity accessible through throats of up to 2 µm in size and has about 2 times higher porosity and MTS. Com-paring the two specimens from within the pink granite in a fracture corridor, the one with the natural fracture surface rich in iron oxides (4_1) features lower incremental porosi-ties for throats larger than 0.4 µm and also lower total poros-ity and lower MTS (Fig. 11a).
The green granite is remarked by high incremental porosi-ties at the low end of the measured throat-size spectrum; more precisely, it features the highest values for throats smaller than 0.05 µm. This fact is reflected in the porosity vs. MTS plot showing that for a given porosity the green gran-ite features the lowest MTS. Comparison of the green grangran-ite specimens shows that both the clay-rich fracture surface and the partially open fracture are associated with higher incre-mental porosities in the submicron range and that the open fracture is associated with important macroporosity. The to-tal porosities and MTSs range, respectively, from 1.4 % and 0.1 µm for the matrix-representative specimen (9_7) to 2.8 % and 0.26 µm for the specimen with partially open fracture (9_1).
The matrix of the yellow granite in the fracture corridor features the highest incremental porosities in the throat-size range 0.04 to 0.4 µm, total porosity of 2.5 % and MTS of 0.24 µm. The specimen with the clay-rich fracture surface (7_1) features higher incremental porosities in the range 0.4 to 4 µm associated with a total porosity of 3.8 % and MTS of 0.56 µm. The fracture-bearing specimen (7_10) features the highest total porosity of 4.3 % and several important peaks in the throat-size range between 1 and 100 µm. The yellow granite fault gouge specimen globally features the highest in-cremental porosities in the throat-size range from 0.4 to 4 µm and important porosity accessible by larger throats. With the exception of the brown granite and of the porous fracture sur-face of the pink granite (specimen 5_3), the yellow granite fault gouge features the highest MTS of 0.94 µm.
The brown granite is characterized by a broad TSD tak-ing into account either of its subfacies. For the brown granite near a single fracture the broad TSD is associated with rather low total porosities from 1.5 % to 1.6 %, whereas the fracture corridor specimens feature total porosities from 2.9 % up to the globally highest value of 6.5 % associated with one of the highest values of MTS of 2.9 µm. The specimen designed to represent the zone with the cavity-related macroporosity (2_3) features the highest incremental porosities at the high end of the measured spectrum and with its broad distribu-tion and the very high median throat-size value (3–4 µm) it resembles the pink granite specimen 5_3 carrying the porous iron-rich fracture infill although the brown granite specimen features 2 times higher total porosity (Fig. 11a).
Concerning the entire MIP specimen collection, the plot of throat diameter vs. total porosity (Fig. 11a) reveals two distinct trends. The matrix-representative specimens of fa-cies without intensive illitization (fresh, fractured, weakly altered, pink) feature low porosities (up to approximately 1 %) and for a given porosity they show high MTS. On the other hand, the facies with intensive illitization (green, yel-low) feature matrix porosities between approximately 1.5 % and 4.5 % while they have relatively low MTS for a given porosity. These trends highlight one of the effects of the illi-tization described above: formation of void space structures with important porosity and with small throats.
264 M. Stanˇek and Y. Géraud: Granite microporosity changes due to fracturing and alteration
Figure 9. Microphotographs and elemental maps showing the Fe-rich material filling fractures in the pink granite. (a) polarized light, (b) cross-polarized light, (c) elemental maps for the region delimited by the red rectangle in (a) and (b).
The values of bulk density are plotted for each specimen as a function of total porosity in Fig. 11b. Based on extrapo-lation of the dataset towards zero porosity, the density of the tested granite in a virtual nonporous state is 2.637 g cm−3. 4.5 Calculated permeability
The permeability values calculated based on the microporos-ity range using the model of Katz and Thompson (1986, 1987) are plotted as a function of free microporosity for each specimen in Fig. 11c. Among a large set of models using MIP data to calculate the permeability value (Buiting and Clerke, 2013; Nooruddin et al., 2014), this one is the simplest and the most accurate for crack network in gran-ite (Gao and Hu, 2013; Katz and Thompson, 1986, 1987). Note that the two quantities are independent: the permeabil-ity was calculated from the measured total microporospermeabil-ity and the associated MTS whereas the free microporosity was mea-sured by mercury reintrusion and represents only the void spaces with high throat to pore size ratio such as cracks. It can be seen that low free porosity (below 0.4 %) is associ-ated with low permeability (ca. from 10−19to 10−18m2) and high free porosity (above 0.7 %) with high permeability (ca. from 10−17 to 10−16m2; cf. Fig. 11c). Few exceptions from this trend are represented by specimens with relatively high porosity and at the same time with an important proportion of void space with low throat to pore size ratio. These
cal-culated values are confirmed by a set of measured values on samples of different facies. The ranges of the measured val-ues are coherent with the calculated ones and highlight the validity of the used model and of the pore network.
In greater detail, two groups of specimens can be distin-guished based on the proportionality between the two quanti-ties. One group is represented by low porosity specimens and comprises fresh, fractured, weakly altered, pink and green granite with the exception of the highly porous fracture in-fill from the pink granite facies (specimen 5_3). This group features a steep increase in permeability with increase in free porosity and can be divided into two subgroups: specimens from the green granite and the other specimens. For the green granite the permeability is lower at a given free porosity as compared to the other specimens. For example, the fractured granite and the pink granite in the fracture corridor (speci-mens 3_2 and 4_2) yield a permeability of 2×10⁻¹⁸m2at ca. 0.2 % free porosity, whereas such permeability corresponds to ca. 2 times higher free porosity in the green granite (spec-imen 9_1). The other group is represented by high porosity specimens comprising the brown and the yellow granite. The high porosity group features a less-steep increase in perme-ability with free porosity and the specimen of brown gran-ite with macroscopic cavities (2_3) indicates that the perme-ability may increase only slightly or not at all with a further increase in free porosity. For example, permeability of ca.
Figure 10. Incremental porosimetric curves showing throat size distributions of the connected porosity of (a) different facies and of (b) specific fracture-related features within the altered facies. From the latter, specimens indexed with “R” were selected as representative of the facies matrix and plotted in (a), compare with Fig. 3. Fr.: fracture, alt.: altered.
3 × 10⁻¹⁷m2corresponds to free porosity of 1.0 % (2_1) but a similar permeability value corresponds to the highest free porosity of 1.4 % (2_3). The permeability of the latter speci-men, which is relatively low with respect to its free porosity, can also be due to the fact that the permeability is less depen-dent on cavities (large pores with high aspect ratio) than on cracks, which are the most remarked porosity feature of most of the other specimens.
5 Discussion and synthesis
The aim of this paper is to better describe the porosity net-work developed at the top of a granite batholith and espe-cially the one developed at the bottom of a sedimentary basin. Another aim is to propose a proxy for the porosity estimation using the quality of biotite alteration, which may be helpful
266 M. Stanˇek and Y. Géraud: Granite microporosity changes due to fracturing and alteration
Figure 11. Plots of measured throat diameter, porosity, density and calculated permeability. (a) Volumetric median throat diameter versus total porosity. For all specimens the values were calculated for the throat diameter interval 0.005–5 µm and for specimens with macroscopic voids also for the interval 0.005–300 µm (denoted by an asterisk to the right of the symbols); (b) bulk density versus total porosity. Total porosity calculated for the throat diameter intervals 0.005–5 and 0.005–300 µm for specimens without and with macroscopic voids, respec-tively; (c) point symbols: permeability calculated after Katz and Thompson (1986, 1987) from the total porosity and median throat diameter (calculated for throat diameter interval 0.005–5 µm) versus free porosity measured by mercury reintrusion (failed for specimen 7_3), bars: intervals of permeability measured by gas permeametry on plugs.
to recognize fault zones and weathered layers during drilling operations without coring.
5.1 Organization of the facies and structures
The Melechov pluton of an S-granitic composition emplaced at shallow crust level at ca. 330–320 Ma (Žák et al., 2011, 2014) was affected by a large set of brittle deformations with fault and fracture corridors, alteration processes with hy-drothermal fluid flows mainly in brittle structures and weath-ering with meteoritic fluids in the upper part of the profile. The studied core of the drilling project crosscuts these differ-ent facies.
Below 65 m b.l.s. the fracture corridors are mainly com-posed of fractures with dip higher than 30◦and dominantly
feature gray granite (Fig. 2).
From the top to 65 m b.l.s., there is a complex associa-tion of structures and facies including those induced by fault activity and hydrothermal processes and those induced by weathering processes. In the first group there are two high fracture density zones with steeply dipping fractures. One is between 20 and 25 m b.l.s. associated with the yellow
fa-cies developed under weathering conditions and affecting hy-drothermal alteration facies in a fault zone. The fracture ori-entation data from the acoustic borehole image (Lexa and Schulmann, 2006) available down from 22.5 m b.l.s. suggest that samples 6 and 7 (yellow granite) are associated with the fractures of set 3 (Fig. 2). The other fracture zone, between 42 and 57 m b.l.s., is larger and is composed of the green hy-drothermal facies more or less preserved from the weather-ing. This fracture zone corresponds to set 4, the fractures of which are frequently faults with infills carrying kinematics indicators (Lexa and Schulmann, 2006). The weathering al-teration affected the highly weathered facies at the top of the profile (brown facies) and the moderately weathered facies below (pink facies). Out of the high fracture density zones, this upper part of the profile is characterized by several corri-dors with low density of fractures with both gentle and steep dip (cf. Fig. 2). The large set of flat or gently dipping frac-tures formed during the weathering as exfoliation joints. The steeply dipping fractures belong to sets 1 and 2 with mainly subvertical joints induced by the pluton shrinkage due to cooling (Lexa and Schulmann, 2006; Stanˇek, 2013).
The fracture zone at 70 m depth, consisting mainly of gen-tly dipping fractures, is currengen-tly described at the bottom of the weathering profile corresponding to the upper fissured zone (Wyns et al., 2004). The weathering profile is described in several places to result from downward propagation of the structural and petrographic transformations along structural pre-discontinuities (Jamtveit et al., 2011; Lachassagne et al., 2011; Walter et al., 2018).
5.2 Constrains on timing of fracturing and alteration events
The oldest brittle fractures are manifested by moderately dip-ping pegmatite and aplite dikes some of which were later reactivated (Lexa and Schulmann, 2006; Stanˇek, 2013) and the subvertical joints induced by the pluton shrinkage due to cooling (sets 1 and 2). The formation of the latter two sets overlaps with the pluton uplift as interpreted from associated fractographic features (Lexa and Schulmann, 2006; Stanˇek, 2013).
In the field, the majority of fractures of sets 1 and 2 do not contain the late-magmatic products. This corresponds to the case of the weakly altered granite characterized by chlo-ritized fracture wall and by barren fracture surface sampled near a steep fracture with dip direction 110◦ according to the acoustic borehole image and thus probably belonging to fractures of set 2 (Fig. 2). The fracture wall alteration and the absence of fracture surface mineralization suggest only dis-solution of the fracture wall, while the precipitation from the fluid took place somewhere else, possibly being at the origin of the pegmatite and aplite dikes in structurally higher levels of the pluton or of its country rock. In this sense, the weakly altered granite represents the oldest alteration event affecting the studied samples.
A younger fracturing event affecting the studied rock sam-ples is represented by fractures of set 4. Given the associa-tion of the high fracture density and the fault character of the steep fractures, the development of the green facies was pre-ceded by formation of faults belonging to the fracture set 4. Taking into account the superposition of weathering on the hydrothermal alteration and the pervasive character of both the brittle deformation and the alteration for the yellow gran-ite, the latter was conditioned by formation of the faults of set 3. This suggests the faults of set 3 are younger than the faults of set 4.
High fracture density, presence of steep fractures and per-vasive alteration are also characteristics of the brown granite in the fracture corridor. From this point of view, even the brown granite can be associated with set 4 faults. However, gently dipping fractures are also present and the dip direc-tions of the fractures at the level of the brown granite are unknown since the borehole images do not capture the up-permost 22 m.
The youngest fracturing event is represented by the exfoli-ation joints. The age of their formexfoli-ation caused by unloading
due to erosion of the overburden can be approximately con-strained to late Carboniferous. This is suggested by the onset of deposition of exhumed and eroded crustal material includ-ing high grade rocks of the Variscan orogen in the Bohemian Massif (Hartley and Otava, 2001). The extent of the exfoli-ation joints in the borehole overlaps with the occurrence of the red iron-rich infills characteristic of the pink alteration. Within this extent, the pink alteration is the only one to also appear on its own as demonstrated by the iron-rich material along cracks and grain boundaries in otherwise unaltered pri-mary mineralogy of the fresh granite (Fig. 2). The red infills, however, occur also in the green, the yellow and the brown granite. In the green granite, some of the gently dipping frac-tures exclusively contain the red infills, while the steeply dip-ping fractures are filled by the green clay-rich material or by a combination of both materials. These observations suggest that the pink alteration postdates the exfoliation joints and that it is the latest alteration event affecting the studied sam-ples.
5.3 The void space structure modifications due to fracturing and alteration
The fracturing and hydrothermal or weathering alteration in-duced changes in the porosity organization and in mineralog-ical contents especially for secondary mineral phases.
Two of the studied facies illustrate the porosity network of unaltered granite: the fresh facies corresponds to the ini-tial state of the granite and the fractured facies represents the fracture vicinity without fluid–rock interactions. The low void space in the fresh granite is dominantly distributed in two structures: the illite aggregates in plagioclase grains and the poorly interconnected cracks. Together, they represent the total connected porosity of 0.3 % with the TSD volumet-rically centered on 0.2 µm. Taking into account the sizes of the connected voids as observed under the microscope, we suggest that the smaller throats of the TSD (0.02–0.2 µm) represent connections with intergranular spaces inside the illite aggregates, that the larger throats (0.2–0.4 µm) corspond to the cracks and that the volumetric proportions re-lated to either of the structures are similar. The link between the throat-size ranges and the structures is also supported by the trends described below for the fractured and the yellow facies characterized by high crack density, on the one hand, and the green facies with sealed cracks and frequent illite ag-gregates on the other hand.
The effect of cracking unbiased by any alteration emerges from the comparison of the void space of the fresh granite and of the fractured granite, which both feature the primary mineralogy. Our results show that compared to the fresh granite, the fractured granite has a higher porosity with larger throats, higher density, greater thickness and more intercon-nection of cracks. The stress-induced origin of this poros-ity corresponds to the observations comparing the unstressed and stressed Westerly granite (Sprunt and Brace, 1974;
Tap-268 M. Stanˇek and Y. Géraud: Granite microporosity changes due to fracturing and alteration
ponnier and Brace, 1976). This means that the fracturing pro-cess increases the volume of void space by increasing the crack density as well as their thickness, the latter evolving from 0.2–0.4 to 0.2–0.7 µm. This thickness increase may cor-respond to the evolution from cracked grain boundaries to cracks (Brace et al., 1972; Kranz, 1979a, b). The presence of an interconnected network of cracks is also supported by the increase in free porosity and is the main cause for higher permeability (Fig. 11c).
Fluid flow alteration processes superpose on the fractured granite and form several facies depending on the volume of fluid and the pressure and temperature conditions.
The weakly altered granite differs from the fractured gran-ite by chlorgran-ite replacing biotgran-ite but otherwise the void space geometry of both facies is similar. This means that even at ob-vious alteration of the rock microstructure (biotite–chlorite) the impact on the void space geometry can be negligible. Also, the fracture surface of the weakly altered granite has no specific porosity property as compared to the fracture wall few millimeters from that surface. This is important since for the other altered facies, all the specimens including fracture surface yielded different MIP results as compared to analo-gous specimens without it.
Chronologically, the green facies developed next within a N–S striking subvertical fault zone during relatively hot fluid circulation prior to the weathering phase. In terms of void space geometry, the green granite highlights the impact of pervasive illitization on granite in the high-density fracture zone. Under FL the illite aggregates filling fractures and re-placing plagioclase grains feature submicroscopic voids and the MIP yields important porosity for throat sizes on the or-der of 10−2µm. This suggests that the majority of the ma-trix porosity resides in the illite aggregates and it explains the striking contrast between the high fracture density and the low matrix porosity around 1.5 %. In association with the lowest MTS of 0.1 µm, the permeability calculated for the green granite matrix is lower than for the fresh granite. The sealing function of the illite aggregates may not be the dominant factor when open cracks or fractures are present in the rock. As can be seen macroscopically (specimen 9_1, Fig. 3a) and microscopically (Fig. 7d), the fractures or cracks can be filled with the illite aggregates incompletely or can be cutting the illite infills. According to our MIP results this may superpose an additional 0.5 %–1.5 % of porosity with throat sizes ranging from those typical for the cracks of the frac-tured granite (0.2–1 µm) to those of the thick cracks (100– 101µm; cf. Figs. 10b and 11a). As a consequence, the per-meability can be on the same order of magnitude as for the fractured granite (Fig. 11c) though with a much more com-plicated porosity structure. During the weathering phase, the pink alteration affected the deeper part of the upper 65 m pro-file, while the brown facies concerns the top of the weather-ing sequence; the intensity of the weatherweather-ing is higher in the upper part than in the lower one.
The pink alteration materialized by iron-rich precipitates frequently seals the cracks. This is reflected in the MIP re-sults by the lowest incremental porosities in the character-istic range of the cracks (>0.2 µm, also compare the curves “fractured” and “pink single fracture” in Fig. 10) and on the bulk values by lower total porosity, lower MTS and lower free porosity as compared to the fractured granite (Fig. 11a, c). The difference between more and less densely fractured pink granite is similar to the difference between the fractured and the fresh granite, respectively: increase in total porosity, higher incremental porosities dominant for larger throats and increase in the maximum throat size.
The effects of fracturing and of the pink alteration are concurrent: while fracturing increases the total porosity, creases the proportion of cracks on the total porosity and in-creases the threshold size of the connections, the pink alter-ation acts in the opposite way on all three parameters. While this holds for the rock matrix, the fracture infills induce vari-ation of this principle. The simplest case is the reduction of size of the connections to the void space of the matrix without simultaneous reduction of the void space volume as observed by comparison of the MIP results (Figs. 10b and 11a) of the specimens with and without the most common form of the fracture infill (4_1 and 4_2, respectively, cf. Fig. 3).
The void space of the matrix of the brown granite near a single fracture is characterized by moderate porosity around 1.5 % made of structures with throat sizes distributed over 4 orders of magnitude (Fig. 10). Under FL, this corresponds to the visibility of patchy areas in plagioclase grains partially replaced by porous illite aggregates and to the cracks of vari-able thickness including remarkably thick cleavage cracks in chlorite and thick intergranular cracks (Fig. 7e). Analogously to the observation on the pink granite, the presence of the iron-rich fracture infill in the brown granite results in reduced maximum throat size and a shift of the distribution towards smaller sizes at otherwise similar total porosity (Figs. 10b and 11a). The matrix of the brown granite in the fracture cor-ridor differs by a higher density of the cracks and also by the presence of large lens-shaped or oval cavities including those with millimetric dimensions (Fig. 7f) that are visible even macroscopically within a centimeter from the master fracture plane (Fig. 2). This situation is reflected in the MIP curves as single or multiple peaks for throat sizes on the or-ders of 100–101µm.
The yellow granite can be regarded as the result of su-perposition of both hydrothermal and weathering alteration. First it suffered the tectonic and hydrothermal strain and later it was affected by weathering in a fluid flow zone, which was efficient proportionally to the fault zone thickness. As a con-sequence, it is the most fractured and the most altered granite and the associated fault gouge has the highest total poros-ity among the matrix-representative specimens (Fig. 11a). Its unique void space structures related to alteration are the illite aggregates in pseudomorphs after biotite. The replacement is frequently complete and results in a microstructure
charac-terized by a network of porous areas in thin sections having outlines and residual traces of cleavage of the replaced min-erals (Fig. 5g). While this microstructure corresponds to the matrix porosity of 2.5 %, the specimen containing the frac-ture infill yielded a total porosity of 3.8 % suggesting the in-fill contains approximately one-third of the rock total poros-ity. Moreover, the high incremental porosities for throat sizes around 1 µm (Fig. 10b) and the high value of free porosity (0.9 %, Fig. 11c) suggest an important contribution of cracks to the infill porosity. The porosity difference between the fault gouge and the fracture corridor rocks shows a simi-lar effect of fracturing as described above for the less and more fractured samples of the unaltered and the pink facies: increase in total porosity, higher incremental porosities for larger throats and increase in the maximum throat size. Re-markably, the fault gouge features less porosity accessible by the smallest measured throats (10−2–10−1µm), which can be due to the fracturing or wear process disrupting the illite ag-gregates.
5.4 Coupling between the microstructural, chemical, optical, porosity and permeability properties Microstructural evolution during the different kinds of strain affecting the granite involves porosity modifications and in-duces permeability variations. The objective of this paper is to define these links and to develop a chart linking these properties. Drilling of borehole is rarely realized with coring and only cuttings are available to give information about the rock characteristics. In such a situation, measurements of the transfer properties are difficult. That is why links between rock facies, using simple descriptive chemical and optical properties, and petrophysical properties, mainly porosity and permeability, are constrained in this paper; refer to Figs. 2, 5, 11 and 12 throughout this section.
We suggest that the different alteration facies can be de-fined based on the biotite alteration, which is easily discern-able by the optical properties and by the chemical composi-tion differences expressed by a combinacomposi-tion of the Si/Al ra-tio and the sum of the interlayer cara-tions. The only excepra-tion is the pink facies where the primary mineralogy is not modi-fied, however, macroscopic and microscopic differences with respect to the other facies are obvious due to saturation by the red iron-rich infills (also cf. Fig. 9).
The fresh granite void space consists of infrequent grain boundary cracks implying very low porosity and permeabil-ity. Such a material can be identified by the low Si/Al ratio and standard optical properties of biotite.
The weakly altered fractured granite can be expected near barren fractures and identified by replacement of biotite by chlorite 1 with a slightly higher Si/Al ratio and distinct op-tical properties. Porosity can be expected to be several times higher and permeability up to 1 order of magnitude higher as compared to the fresh granite.
The green granite is characterized by chlorite 2 with sim-ilar Si/Al ratio and sum of interlayer cations as the chlorite 1 in the weakly altered granite. However, under the micro-scope, the pervasive illitization helps to distinguish it from the latter. Low to moderate porosity can be expected, but due to the very low pore throat size, the permeability may be sim-ilar or lower as compared to the fresh granite.
The pink granite remarked macroscopically and micro-scopically by the iron-rich infills is among the least perme-able facies owing to the low porosity and very low throat size. However, special attention should be paid to the char-acter of the fracture infills, which can substantially increase both porosity and the throat size and consequently may be associated with high permeability (cf. Fig. 3).
The brown granite representing intensive weathering alter-ation can be identified by chlorite 3 with Si/Al ratio around 1.3 and sum of the interlayer cations around 0.2. Due to the moderate porosity of the matrix, which includes voids with large throats, the permeability can be expected to be at least two orders of magnitude higher than for the fresh granite. In the most fractured and altered form, very high porosity between 6 % and 7 % with large throats can induce perme-ability on the order of 10−15m2.
The yellow granite representing the superposition of per-vasive cracking and both hydrothermal and weathering alter-ation can be identified by chlorite 4 with the highest Si/Al ratio of 1.7 and the sum of the interlayer cations around 0.4. The fault gouge in the yellow granite facies features high porosity of 4.5 % and a characteristic throat size of 1 µm, which correspond to high permeability of up to 10−16m2.
Indeed, the chemical signature (Fig. 6) could be used to es-timate the porosity and the permeability (Fig. 11) from anal-yses of chlorite sampled in cuttings of destructive drilling. The appropriate charts may be like the one in Fig. 12 and may be applied for mineralogically and chemically analo-gous granitic material altered in similar conditions as well as for weathering and hydrothermal processes. In a broader geological sense, we suggest this is plausible for granites in a similar setting as the studied Lipnice granite: two-mica S-granite genetically linked and tectonically intimately accom-panied with metapelitic migmatites affected by hydrothermal alteration (under green schist conditions) and weathering. 5.5 General implications for fracture-related
microporosity structure
When generalized, some of the observations contribute to frequently discussed topics concerning the relation between macroscopic fractures or fault zones and the structure of mi-croporosity in their vicinity.
It appears from the measured throat size distributions that fracturing not only enlarges the threshold size of connec-tions through crack formation but also eliminates structures with small threshold size through destruction of the associ-ated small-throat structures (the illite aggregates in our case).