HAL Id: hal-00022481
https://hal-insu.archives-ouvertes.fr/hal-00022481
Submitted on 3 May 2006HAL is a multi-disciplinary open access
archive for the deposit and dissemination of sci-entific research documents, whether they are pub-lished or not. The documents may come from teaching and research institutions in France or abroad, or from public or private research centers.
L’archive ouverte pluridisciplinaire HAL, est destinée au dépôt et à la diffusion de documents scientifiques de niveau recherche, publiés ou non, émanant des établissements d’enseignement et de recherche français ou étrangers, des laboratoires publics ou privés.
Experimental and Thermodynamic Constraints on the
Sulphur Yield of Peralkaline and Metaluminous Silicic
Flood Eruptions.
Bruno Scaillet, Ray Macdonald
To cite this version:
Bruno Scaillet, Ray Macdonald. Experimental and Thermodynamic Constraints on the Sulphur Yield of Peralkaline and Metaluminous Silicic Flood Eruptions.. Journal of Petrology, Oxford University Press (OUP), 2006, 47, 7, pp.1413-1437. �10.1093/petrology/egl016�. �hal-00022481�
Experimental and Thermodynamical Constraints on the Sulphur Yield of Peralkaline and Metaluminous Silicic Flood Eruptions
Bruno Scaillet1 and Ray Macdonald2
1* Institut des Sciences de la Terre d’Orléans, UMR 6113 CNRS-UO, 1A rue de la
Férollerie, 45071 Orléans, France
2 Environment Centre, Lancaster University, Lancaster LA1 4YQ, UK
ABSTRACT
Many basaltic flood provinces are characterised by the existence of voluminous amounts of silicic magmas, yet the role of the silicic component in sulphur emissions associated with trap activity remains poorly known. We have performed
experiments and theoretical calculations to address this issue. The melt sulphur content and fluid/melt partitioning at
saturation with either sulphide or sulphate or both have been experimentally determined in three peralkaline rhyolites, which are a major component of some flood provinces. Experiments were done at 150 MPa, 800-900oC, fO2 in the
range NNO-2 to NNO+3 and under water rich conditions. The sulphur content is strongly dependent on the
peralkalinity of the melt, in addition to fO2, and reaches 1000
at 800°C. At all values of fO2, peralkaline melts can carry
5-20 times more sulphur than their metaluminous equivalents. Mildly peralkaline compositions show little variation in fluid/melt sulphur partitioning with changing fO2 (DS ≈270).
In the most peralkaline melt, DS rises sharply at fO2 >
NNO+1 to values of >500. The partition coefficient increases steadily for Sbulk between 1 and 6 wt% but remains about
constant for Sbulk between 0.5 and 1 wt%. At bulk sulphur
contents lower than 4 wt%, a temperature increase from 800 to 900°C decreases DS by ∼10%. These results, along with (1) thermodynamic calculations on the behaviour of sulphur during the crystallisation of basalt and partial melting of the crust and (2) recent experimental constraints on sulphur solubility in metaluminous rhyolites, show that basalt fractionation can produce rhyolitic magmas having much more sulphur than rhyolites derived from crustal anatexis. In
particular, hot and dry metaluminous silicic magmas
produced by melting of dehydrated lower crust are virtually devoid of sulphur. In contrast peralkaline rhyolites formed by crystal fractionation of alkali basalt can concentrate up to 90% of the original sulphur content of the parental magmas, especially when the basalt is CO2-rich. On this basis, we
estimate the amounts of sulphur potentially released to the atmosphere by the silicic component of flood eruptive sequences. The peralkaline Ethiopian and Deccan rhyolites
could have produced ∼1017 and ∼ 1018 g of S, respectively,
which are comparable amounts to published estimates for the basaltic activity of each province. In contrast, despite similar erupted volumes, the metaluminous Paraná-Etendeka silicic eruptives could have injected only 4.6x10¹⁵ g of S in the atmosphere. Peralkaline flood sequences may thus have greater environmental effects than those of metaluminous affinity, in agreement with evidence available from mass extinctions and oceanic anoxic events.
INTRODUCTION
A detailed understanding of the solubility of sulphur in silicate melts is important for many geological processes (O’Neill & Mavrogenes, 2002): the origin of magmatic sulphide ores, the geochemical behaviour of the chalcophile trace elements, including the platinum group elements and the Re-Os isotopic system and their use as tracers of core-mantle and crust-mantle differentiation in the Earth and other planets or asteroids (e.g., Kracher & Wasson, 1982; Jana & Walker, 1997; Chabot, 2004). Sulphur solubility along with melt-vapor partitioning also determines sulphur degassing during volcanic activity and the potential effects on climate variability.
Most studies of sulphur solubility, cited in Carroll & Webster (1994), O’Neill & Mavrogenes (2002) and Jugo et al. (2005), have focussed on mafic and intermediate melt compositions. Our understanding of S behaviour in silicic magmas is more restricted and comes mainly from work on Fe-poor, metaluminous compositions (mol.
(CaO+Na2O+K2O) > Al2O3 > (Na2O+K2O)), of the type commonly associated with
Evans, 1999; Keppler, 1999; Costa et al., 2004; Clemente et al., 2004). Such compositions are not directly applicable to the magmatism of continental extensional zones, where the rhyolites tend to be alkali- and Fe-rich and either metaluminous or peralkaline (mol. (Na2O+K2O) > Al2O3) (Macdonald et al., 1992; King et al., 1997). The alkali/alumina
balance of silicate melts is known to profoundly affect their geochemical and physical behaviour (Mysen, 1988). Most notable among those effects are the increase in Fe3+/Fe2+ redox ratio (Gwin & Hess, 1989; Moore et al., 1995; Gaillard et al., 2001), water solubility (Dingwell et al., 1997), decrease of viscosity (Scarfe, 1977; Baker & Vaillancourt, 1995; Dingwell et al., 1998) and liquidus temperatures (Bailey & Schairer, 1966) as peralkalinity increases. These important differences imply that insight gained from the study of sulphur in metaluminous silicate melts is of little help in anticipating its behaviour in peralkaline rhyolites.
Whilst many flood basalt provinces seem to be dominated by basaltic lavas, several recent studies have emphasized that some have significant volumes of associated silicic rocks (Bellieni et al., 1986; Harris & Erlank, 1992; Peccerillo et al., 2003; Ewart et al., 1998, 2004; Ayalew et al., 2002; Bryan et al., 2002). The objective of the present study is to evaluate the sulphur yield potentially delivered to the atmosphere by silicic flood eruptions. Given that peralkaline rhyolites can largely dominate over metaluminous types in some silicic provinces (Ayalew et al., 2002), we currently lack the fundamental
information on which to base any such evaluation. We have, therefore, performed melt solubility and fluid/melt partitioning experiments for sulphur in peralkaline rhyolites from the Kenya Rift Valley, which broadly typify the felsic end-member of bimodal associations in rift-related settings (Bellieni et al., 1986; Harris & Erlank, 1992; Peccerillo et al., 2003; Ewart et al., 1998, 2004; Ayalew et al., 2002; Bryan et al., 2002). We combine these data with thermodynamic and mass balance calculations to evaluate the sulphur contents of
potential sources of felsic magmas associated with flood basalts, considering two end-member cases for the origin of the silicic end-end-member: fractional crystallisation of flood basalt and partial melting of lower dehydrated crust. We show that the attainment of peralkaline conditions dramatically increases the sulphur-carrying capacity of rhyolite magmas. We then estimate the sulphur yields of some silicic flood sequences. The results appear to be significant for the current debate on the volcanic origin of some of the main mass extinctions (e.g. Wignall, 2001; Morgan et al., 2004).
EXPERIMENTAL AND ANALYTICAL TECHNIQUES
We have performed sulphur solubility and fluid/melt partitioning experiments on three well-characterised, peralkaline rhyolitic obsidians from the Naivasha area of the Kenya Rift Valley (Table 1).
Table 1. Experimental conditions, masses of silicate and volatiles, run products and phase proportions
charge P tot fH2 fH2O T ΔNNO duration S bulk silicate+S H2O sulphur fl Po
bar bar bar °C hr wt% mg mg mg wt% wt%
ND bulk ND-1 1520 40.0 1166 803 -1.61 165 1.01 20.20 1.90 0.20 3.89 1.65 ND-2 1500 7.7 1180 803 -0.17 172 1.01 19.60 2.00 0.20 4.59 1.65 ND-4 1520 2.5 1170 804 0.82 309 1.01 20.00 2.10 0.20 4.90 1.47 ND-5 1520 1.3 1177 803 1.37 193 1.01 20.30 2.00 0.20 4.17 1.45 ND-6 1520 0.5 1120 806 2.25 192 1.01 20.30 2.00 0.20 4.63 - ND-3 1500 0.2 1123 808 2.96 188 1.01 30.00 3.00 0.30 4.73 - ND-9 1561 50.0 1295 900 -1.63 96 1.01 20.10 2.00 0.20 4.94 1.38 SMN-bulk SMN-1 1520 40.0 1182 803 -1.60 165 1.19 19.80 2.10 0.24 4.92 2.16 SMN-2 1500 7.7 1149 803 -0.19 172 1.19 20.20 2.00 0.24 4.39 1.93 SMN-4 1520 2.5 1150 804 0.80 309 1.19 20.70 2.00 0.25 4.23 1.76 SMN-5 1520 1.3 1120 803 1.33 193 1.19 19.20 2.20 0.23 6.24 - SMN-6 1520 0.5 1098 806 2.24 192 1.19 20.40 2.10 0.24 5.24 - SMN-3 1500 0.2 1098 808 2.94 188 1.19 20.20 2.10 0.24 5.32 -
SMN-9 1561 50.0 1299 900 -1.63 96 1.19 20.00 2.00 0.24 4.60 1.65
EBU bulk
EBU-1 1520 40.0 1205 803 -1.58 165 1.08 21.00 2.00 0.23 3.78 2.31
EBU-2 1500 7.7 1181 803 -0.17 172 1.08 20.20 2.00 0.22 4.18 2.06
Table 1. Continued
charge P tot fH2 fH2O T ΔNNO duration S bulk silicate+S H2O sulphur fl Po
bar bar bar °C hr wt% mg mg mg wt% wt%
EBU-4 1520 2.5 1159 804 0.81 309 1.08 20.60 2.00 0.22 4.23 1.45 EBU-5 1520 1.3 1104 803 1.32 193 1.08 20.80 2.10 0.22 4.99 - EBU-6 1520 0.5 1074 806 2.22 192 1.08 21.10 1.90 0.22 4.02 - EBU-3 1500 0.2 1093 808 2.94 188 1.08 20.40 2.00 0.22 4.74 - EBU-7-0.5 1500 6.1 1195 801 0.04 214 0.50 20.40 2.10 0.10 4.45 0.82 EBU-7-2 1500 6.1 1133 801 0.00 214 2.01 20.70 2.00 0.42 4.25 3.66 EBU-7-4 1500 6.1 1003 801 -0.11 214 3.85 20.10 1.90 0.77 4.94 6.01 EBU-7-6 1500 6.1 890 801 -0.21 214 6.14 20.00 2.10 1.23 7.43 7.40 EBU-8-2 1510 44.0 1161 805 -1.70 183 2.01 20.70 2.10 0.42 4.58 4.08 EBU-8-4 1510 44.0 1047 805 -1.79 183 3.85 21.30 2.10 0.82 5.12 6.51 EBU-8-6 1510 44.0 825 805 -1.99 183 6.14 21.50 2.00 1.32 6.41 7.31
EBU-9-0.5 1561 55.0 1353 900 -1.60 96 0.50 21.00 2.00 0.11 3.78 1.00 EBU-9-1 1561 50.0 1328 900 -1.61 96 1.08 20.00 2.00 0.22 4.35 2.07 EBU-9-2 1561 50.0 1253 900 -1.66 96 2.01 22.60 2.10 0.45 4.07 3.52 EBU-9-4 1561 50.0 1119 900 -1.76 96 3.85 20.90 2.00 0.80 5.22 5.71 EBU-9-6 1561 50.0 934 900 -1.92 96 6.14 20.40 2.00 1.25 7.22 6.56
S bulk is the wt% content of sulphur of the silicate powder. The mass of sulphur in the charge is given in the column labelled sulphur.
The wt% of pyrrhotite (Po), anhydrite (Anhy) and oxide (Ox) are calculated on the basis of condensed phases only (i.e. hydrous glass + minerals). fl is the weigth % of fluid at P and T.
Two (ND, SMN) are mildly peralkaline comendites ((Na2O+K2O)/Al2O3 = 1.05 and 1.31, respectively) from
the Greater Olkaria Volcanic Complex and were previously used in phase equilibrium studies (Scaillet & Macdonald, 2001; 2003). The third, EBU, is a pantelleritic obsidian from a welded fall deposit of the Eburru Volcanic Complex, immediately north of Olkaria. It is more strongly peralkaline than the comendites (NK/A = 1.88) and represents a composition that could have been generated by ~50% crystallization of Olkaria-type comendites similar to SMN (Scaillet & Macdonald, 2003). These starting melt compositions (Table 1) encompass the entire peralkalinity range displayed by rhyolites associated with flood basalts (Trua et al., 1999; Ayalew et al., 2002; Peccerillo et al., 2003). We restricted our investigations to low pressure
conditions (∼150 MPa), thought to be relevant to the production of alkali rhyolites (Mahood, 1984; Scaillet & Macdonald, 2001) and we focussed on the role of oxygen fugacity (fO2), which exerts a strong control on
sulphur behaviour in silicic magmas (e.g., Carroll & Webster, 1994 ; Scaillet et al., 1998; Keppler, 1999). The experimental procedures are similar to those used in previous studies performed at the ISTO experimental petrology laboratory, such as that by Scaillet et al. (1998) and Clemente et al. (2004). For each composition, batches of starting glass+sulphur powders with fixed sulphur contents were prepared by
weighing 200 mg of glass powder with appropriate amounts of elemental sulphur (1 to 12 mg added sulphur). The resulting mixture was thoroughly mixed in an agate mortar for several minutes. Most
experiments used ND, SMN and EBU batches with bulk sulphur contents of c. 1 wt% (1.01, 1.19 and 1.08 wt%, respectively see Table 1). However, two series with EBU composition were performed with additional bulk sulphur contents of 0.5, 2.01, 3.85 and 6.14 wt% S, so as to explore the effect of sulphur fugacity at fixed P and T and fH2. We used Au capsules, which were loaded with the glass+sulphur powder (c. 20-30
mg, Table 1) plus weighed amounts of distilled water (c. 10 wt%, Table 1), and welded shut with a graphite arc welder. Weighing before and after welding, as well as after run completion, was used as a monitor for any volatile loss having occurred at P and T. For all charges used in this study, capsule weighs remained constant to within 0.2 mg. We used either cold seal pressure vessels (CSPV) fitted with an H2 membrane
(runs at 800°C) or an internally heated pressure vessel (IHPV) with a drop quench setting (900°C). Errors in quoted temperatures and pressures are ±8°C, and 2 MPa, respectively. The fO2 was varied using various
Ar-H2 mixtures as the pressurizing gas. The H2 fugacity was either read with an H2-membrane (800°C) or
known from previous experiments that used the same Ar-H2 ratio and which were run with an H2 membrane
(900°C). Errors on H2 fugacities are ±0.01 MPa (800°C), or ±0.5 MPa (900°C), the latter determined by
repeat experiments performed with the IHPV while fitted with a H2 membrane. The fO2 of each charge was
computed using the dissociation reaction of water (Robie et al., 1979), the fH2 and the water fugacity (fH2O).
The fH2O of each charge (Table 1) was computed assuming ideal behaviour in the fluid (i.e., aH2O=XH2Ofl,
XH2Ofl being the mole fraction of H2O in the fluid and aH2O the activity of water defined as the ratio
fH2O/fH2O°, fH2O° being the fugacity of pure water at P and T as given by Burnham et al. (1969)) and using
the calculated fluid composition as determined from mass balance constraints. The fluid composition was calculated knowing the amounts of dissolved water and sulphur, the amount of sulphur locked into solid phases (sulphide and sulphate) and the bulk content of water and sulphur loaded to the capsules. The water content of quenched melts (glasses) was determined using the by-difference method employing appropriate sets of hydrous glass standards of known H2O contents (Scaillet & Macdonald, 2001). For charges with c. 1
wt% bulk sulphur, the calculated XH2Ofl of the equilibrium fluid (Table 2) is close to, or higher than, 0.9,
with the result that the calculated fO2 is only marginally lower than that corresponding to pure H2O
(difference less than 0.05 log unit). For those charges we estimate that the uncertainty on fO2 is < 0.1 log
units. In contrast, charges having bulk sulphur contents in excess of 1 wt% have calculated fluid compositions that are significantly poorer in H2O, with XH2Ofl going down to 0.68 (Table 2).
Table 2. Compositions of glasses, coexisting fluid, and calculated fluid/melt sulphur partition coefficients
charge SiO2 Al2O3 FeO MgO CaO Na2O K2O F Cl NK/A n Smelt Sfluid XH2Ofl Sfl/Smelt
wt% wt% wt% wt% wt% wt% wt% wt% wt% ppm wt% ND bulk 75.20 12.11 1.81 0.07 0.44 4.59 4.73 0.37 0.22 1.05 ND-1 77.25 12.08 0.39 0.05 0.37 4.54 5.00 0.13 0.13 1.07 7 268 8.2 0.95 307 0.18 0.12 0.08 0.03 0.05 0.01 0.08 0.14 0.03 31 ND-2 77.18 12.17 0.39 0.05 0.35 4.55 4.98 0.13 0.13 1.06 7 265 6.9 0.96 261 0.22 0.13 0.19 0.03 0.05 0.01 0.12 0.10 0.04 34 ND-4 77.25 12.19 0.54 0.04 0.30 4.54 4.76 0.18 0.15 1.03 12 266 7.7 0.96 290 0.21 0.15 0.17 0.03 0.06 0.01 0.12 0.09 0.04 36 ND-5 77.43 12.20 0.56 0.05 0.09 4.53 4.72 0.22 0.08 1.03 10 329 4.8 0.97 147 0.08 0.16 0.12 0.02 0.03 0.00 0.08 0.10 0.04 42 ND-6 77.43 12.16 0.87 0.03 0.03 4.51 4.55 0.16 0.11 1.02 10 462 14.4 0.91 310 0.27 0.13 0.14 0.02 0.03 0.01 0.23 0.13 0.06 27 ND-3 77.33 12.19 0.78 0.02 0.01 4.53 4.67 0.25 0.05 1.03 6 633 13.4 0.92 212 0.25 0.09 0.13 0.02 0.02 0.01 0.16 0.16 0.03 38 ND-9 76.97 11.98 0.63 0.04 0.37 4.55 4.82 0.27 0.12 1.06 7 303 8.9 0.95 294 0.23 0.13 0.10 0.03 0.06 0.01 0.12 0.05 0.05 15 SMN-bulk 74.17 10.89 3.98 0.00 0.29 5.81 4.34 1.00 0.50 1.31 SMN-1 75.60 10.67 2.11 0.02 0.06 5.71 4.45 1.07 0.26 1.33 7 242 6.1 0.97 254 0.24 0.12 0.23 0.02 0.05 0.01 0.16 0.14 0.08 39 SMN-2 75.14 10.66 2.32 0.01 0.06 5.72 4.42 1.17 0.37 1.33 8 315 8.7 0.95 277 0.36 0.12 0.28 0.01 0.04 0.01 0.20 0.20 0.12 24 SMN-4 75.23 10.75 2.46 0.01 0.03 5.70 4.33 1.20 0.22 1.31 16 351 10.3 0.94 293 0.22 0.10 0.11 0.01 0.03 0.01 0.12 0.15 0.06 67 SMN-5 75.43 10.53 2.67 0.02 0.03 5.67 4.20 1.09 0.21 1.32 10 452 14.4 0.91 318 0.26 0.15 0.25 0.01 0.02 0.01 0.16 0.07 0.06 46 SMN-6 76.51 10.73 1.58 0.00 0.01 5.65 4.24 1.08 0.08 1.29 10 487 17.1 0.90 350 0.22 0.15 0.14 0.01 0.02 0.01 0.11 0.10 0.02 37
charge SiO2 Al2O3 FeO MgO CaO Na2O K2O F Cl NK/A n Smelt Sfluid XH2Ofl Sfl/Smelt
SMN-9 75.22 10.49 2.35 0.02 0.06 5.74 4.41 1.05 0.41 1.36 8 548 11.0 0.94 201 0.24 0.16 0.21 0.02 0.02 0.01 0.15 0.16 0.05 46 EBU bulk 70.86 8.48 7.17 0.52 0.30 6.68 4.50 0.78 0.43 1.87 EBU-1 74.09 8.30 5.19 0.01 0.23 6.52 4.41 0.79 0.35 1.87 6 738 2.8 0.98 38 0.23 0.10 0.28 0.01 0.05 0.01 0.11 0.19 0.07 65 EBU-2 73.37 8.38 5.40 0.01 0.28 6.54 4.41 0.96 0.36 1.85 7 897 4.3 0.98 48 0.32 0.06 0.25 0.02 0.04 0.03 0.08 0.11 0.08 37 EBU-4 73.75 8.29 5.93 0.01 0.14 6.50 4.19 0.82 0.23 1.84 11 928 9.3 0.95 100 0.34 0.07 0.25 0.01 0.04 0.01 0.13 0.09 0.04 67 EBU-5 75.37 8.45 4.68 0.02 0.05 6.47 4.03 0.70 0.16 1.77 10 549 16.3 0.90 297 0.22 0.06 0.13 0.02 0.02 0.01 0.11 0.14 0.01 25 EBU-6 75.65 8.46 4.43 0.02 0.02 6.46 4.05 0.66 0.12 1.78 11 368 19.9 0.88 542 0.22 0.21 0.22 0.02 0.02 0.01 0.09 0.12 0.02 23 EBU-3 75.60 8.50 4.51 0.01 0.04 6.47 3.95 0.78 0.11 1.76 5 434 17.3 0.90 399 0.39 0.09 0.28 0.01 0.04 0.01 0.13 0.18 0.05 17 EBU-7-0.5 72.92 8.13 6.47 0.01 0.26 6.52 4.31 0.87 0.33 1.89 11 744 2.2 0.99 30 0.39 0.08 0.26 0.02 0.05 0.02 0.15 0.17 0.04 72 EBU-7-2 75.01 8.43 4.03 0.03 0.21 6.53 4.32 0.89 0.31 1.83 13 1013 10.8 0.94 107 0.20 0.12 0.14 0.01 0.02 0.01 0.21 0.19 0.09 149 EBU-7-4 77.29 8.59 2.00 0.02 0.11 6.50 4.44 0.66 0.15 1.81 10 845 26.9 0.83 319 0.30 0.16 0.16 0.02 0.03 0.01 0.13 0.18 0.03 61 EBU-7-6 78.70 8.77 0.79 0.01 0.08 6.48 4.39 0.46 0.08 1.76 10 880 39.1 0.74 445 0.23 0.09 0.11 0.02 0.02 0.02 0.09 0.13 0.01 94
charge SiO2 Al2O3 FeO MgO CaO Na2O K2O F Cl NK/A n Smelt Sfluid XH2Ofl Sfl/Smelt
wt% wt% wt% wt% wt% wt% wt% wt% wt% ppm wt% EBU-8-2 74.92 8.49 3.66 0.02 0.28 6.57 4.48 1.04 0.42 1.84 10 445 7.9 0.95 177 0.19 0.10 0.15 0.02 0.04 0.01 0.12 0.11 0.07 56 EBU-8-4 76.83 8.69 1.57 0.01 0.26 6.58 4.53 0.90 0.35 1.81 12 891 22.4 0.86 252 0.48 0.11 0.18 0.01 0.07 0.03 0.11 0.23 0.10 148 EBU-8-6 77.49 8.67 0.87 0.01 0.28 6.62 4.54 0.84 0.33 1.82 13 1222 45.7 0.68 374 0.36 0.18 0.06 0.02 0.07 0.01 0.13 0.15 0.04 180 EBU-9-0.5 72.66 8.06 6.32 0.02 0.23 6.55 4.30 0.82 0.41 1.92 8 969 2.8 0.98 29 0.28 0.07 0.14 0.03 0.03 0.00 0.15 0.10 0.03 52
0.11 0.13 0.18 0.01 0.04 0.02 0.12 0.04 0.04 25 EBU-9-2 74.44 8.23 4.15 0.01 0.27 6.58 4.38 0.77 0.42 1.89 8 1193 14.8 0.91 124 0.35 0.07 0.19 0.02 0.07 0.01 0.11 0.07 0.07 43 EBU-9-4 76.00 8.45 2.25 0.02 0.25 6.62 4.59 0.71 0.36 1.88 9 1591 28.9 0.81 182 0.24 0.05 0.17 0.02 0.06 0.02 0.15 0.06 0.06 73 EBU-9-6 76.39 8.49 1.52 0.02 0.26 6.63 4.54 0.74 0.37 1.87 8 2254 45.8 0.68 203 0.31 0.03 0.27 0.03 0.03 0.00 0.20 0.13 0.04 47
Glass compositions have been normalised to 100% anhydrous. Melt water contents determined with the by-difference method range from 5 to 6 wt%. The 1 standard deviation of each oxide or element analysed is given in italics below the concentration. Reported glass compositions are average of 6-10 electron microprobe analyses
The XH2Ofl represents the mole fraction of H2O of the coexisting fluid phase that is made of H2O and H2S (low fO2) or SO2 (high fO2), and which is determined by mass balance.
The Smelt and Sfluid are the sulphur content of melt and fluid, respectively.
n is the number of electron microprobe analyses of sulphur. NK/A is the (Na2O+K2O)/Al2O3 ratio (moles).
As a result, the value of fO2 for the sulphur-rich charges is lower than that corresponding to the pure
H2O case. However, for a fixed set of P-T-fH2 conditions (i.e. series EBU-9 in Table 1), the difference in
calculated fO2 between the sulphur-poor and sulphur-rich charges does not exceed 0.3 log unit (Table 1). The main source of uncertainty in S-rich charges comes from the estimate of the amount of H2O dissolved in the
melt. An error of 1 wt% absolute (i.e. 4.5 wt% instead of 5.5 wt%) produces a change in calculated XH2Ofl
of about ± 0.07, which in turn induces a change in the calculated log fO2 of about ± 0.07 unit. Overall, for
the sulphur-rich charges we estimate that the fO2 is known to within 0.3 log unit.
Because we use elemental sulphur as a source of sulphur, and not either sulphide or anhydrite (e.g. Luhr, 1990), the initial redox state of the charges is grossly out of equilibrium since the sulphur in the fluid must be complexed either with O2 to form SO2 or with H2 to produce H2S, which are the two dominant fluid
species in the fluid at P and T, depending on fO2 (see Clemente et al., 2004). As long as H2 from the vessel
does not diffuse across the capsule walls (i.e. below 600°C), the redox state of the charges will be internally controlled to some value which will depend on factors such as the ratio of H2O to S loaded, the amount of
atmospheric O2 present in the capsule and the rates of H2O and S dissolution into glass/melt. At 800°C,
however, the kinetics of H2 diffusion even within Au is so fast that osmotic equilibrium in H2 is attained
within a few tens of seconds across capsule walls (Scaillet et al., 1992), and maintained at a fixed value owing to the large H2-buffering capacity of the vessel volume (Schmidt et al., 1995). Both the CSPV and
IHPV attain the target temperature in about 20 min, so that the period elapsed at low temperature conditions, during which transient redox state may occur, is short relative to the total run duration (minimum of 96 hrs, Table 1). Redox equilibrium will be reached as soon as the dissolution process of volatiles into melt is achieved. Using appropriate diffusivities for H2O and S (taken at 800°C as 10-7 cm2/s
and 10-9 cm2/ s, respectively (Watson, 1994)), it can be calculated that volatile dissolution occurs in a matter of minutes (H2O) to few hours (S) owing to the finely powdered and well mixed nature of our starting
charges produced in this study displayed textural evidence of redox disequilibrium such as sulphide rimmed by sulphate or vice versa, suggesting that either the charge has no time to record redox states radically different from that imposed at run conditions, or any evidence of such variations in fO2 during the
heating-up period has been erased heating-upon run completion.
Run products were characterised first by optical inspection with a metallographic microscope and then by electron microprobe analysis (EMPA). Observation under reflected light prior to carbon-coating allowed the oxide to be distinguished easily from sulphide owing to their contrasted colours (grey for oxide
vs. yellowish for sulphide) as well as shape (rectangular to equant shape for oxide vs pentagonal to rounded
shape for smaller individual sulphide grain). Investigation under transmitted light and crossed polars enabled straightforward identification of anhydrite in oxidized charges due to its high birefringence. In anhydrite-bearing charges, anhydrite was fully enclosed by glass, suggesting that it grew from melt and is not the result of back reaction of fluid upon cooling, in which cases it should have partially filled open cavities
representing former gas bubbles. In all cases, optical identification of minerals was confirmed by subsequent EMPA, although owing to their generally small size, most analyses of minerals were contaminated by glass. We used the following conditions to determine the composition of glasses. For major elements, the
conditions were: accelerating voltage 15 kV, sample current 6 nA, counting time 10 s on peak for all elements, and a beam defocused to 5 m. Na and K were analysed first and a ZAF correction procedure applied. Correction factors for Na loss were based on analyses of synthetic peralkaline rhyolitic
compositions and a set of metaluminous rhyolitic and dacitic glasses, all of known water content as
determined by Karl Fischer titration. Between 6 and 10 analyses were performed for each glass. The water content of quenched glasses varied between 5 and 6 wt%, except for the two charges with c. 6 wt% sulphur which displayed slightly lower values (between 4 and 5 wt%). Owing to the large uncertainties of the by-difference technique in determining the H2O content of quenched glasses (e.g. Devine et al., 1995), in this
work we use a fixed melt water content of 5.5 wt% for all charges. The concentration of total sulphur in glasses was determined by EMPA using 3 synthetic hydrous dacitic glasses containing 750, 1400, and 1900
ppm sulphur (determined by wet chemistry) as standards (Clemente et al., 2004). The EMPA was run with the following conditions: accelerating voltage 15 kV, sample current 50 nA, beam diameter 10 µm with a counting time of 60 s. The background was determined by analysing a dry rhyolitic glass without sulphur, using the above analytical procedure. The detection limit under these analytical conditions is about 80 ppm. The sulphur data given in Table 2 are averages of 5-16 analyses.
Apart from oxide and sulphur-bearing phases, no other mineral was detected. Two S-bearing phases crystallised: pyrrhotite at NNO <1 and anhydrite at NNO >1. At high fO2, an oxide co-precipitated with
anhydrite. Knowing the amount of sulphur-bearing phases crystallised, and the amount of sulphur dissolved in the melt, the sulphur content of the coexisting fluid is calculated by difference with the known bulk sulphur content, using stoichiometric FeS and CaSO4 as sulphide or sulphate minerals (e.g., Scaillet et al.,
1998). Since, depending on fO2, sulphide or sulphate+oxides were the sole phases crystallising (Table 1), the
maximum proportions of sulphur-bearing minerals can be determined by the changes in either FeOtot (fO2 <
NNO) or CaO (fO2 > NNO+1) of the quenched glass. This obviously assumes that neither iron or calcium is
transported into the fluid (or lost to the capsule in the case of iron but, under our experimental conditions, sulphur was never detected in Au capsules). If any of these two elements is partitioned into the fluid, the amounts of sulphide or sulphate calculated from variations in FeO and CaO abundances in glass will be overestimated, with the consequence that there will be too much sulphur locked in solid phases. As a result, the calculated partition coefficient will be lower than its real value. Conversely, as stated above, we assume that pyrrhotite is end-member FeS. Pyrrhotite departure from FeS stoichiometry can be up to Fe5S6. An
Fe5S6 stoichiometry would decrease our calculated partition coefficients, since it maximises the amount of
sulphur tied up with iron in pyrrhotite and this sulphur is therefore no longer available to the fluid. For charges saturated in anhydrite, a problem also arises from the low bulk CaO content of the starting rocks. Generally those charges have melts with CaO contents close to the detection limit. The fact that this extreme depletion in CaO goes along with a decrease in melt Cl content relative to the starting value (see Table 2), suggests that not all the Ca complexes with sulphur to form anhydrite but that some goes into the fluid,
possibly as CaCl2 species. The concentration of CaO in charges run at low fO2 remains close to the starting
value, although some depletion does occur, possibly also as a result of Ca complexing with Cl. We recognise that partition coefficients of sulphur between fluid and melt determined in this way (by default) can be affected by a number of errors, as illustrated below. However, there is unfortunately no straightforward way of assessing this parameter in hydrothermal experiments. In particular, measuring the H-O-S fluid
compositions upon quench is unlikely to retrieve the correct numbers since back reactions within fluid can alter both its speciation and composition (L. Baker, personal communication).
As an example consider charge ND1 whose partition coefficient, Ds, calculated using the above assumptions, is 307 (Table 1). This charge consisted of 20.2 mg of silicate powder with 1.01 wt% S (0.2 mg), and 1.9 mg of H2O. The bulk FeO is 1.81 wt% (0.37 mg) and after the run the hydrous glass (5.5 wt%
or 1.11 mg H2O) has 0.39 wt% FeOtot (0.08 mg). The difference in FeO content in glass before and after the
run (0.2867 mg) implies that 0.00399 milimole of Fe is sequestered in pyrrhotite (0.2867/71.85). Assuming stoichiometric pyrrhotite this implies in turn that 0.128 mg (32x0.004) of sulphur is locked up in pyrrhotite. Knowing that the glass has 268 ppm dissolved sulphur, corresponding to 0.0054 mg sulphur, this leaves 0.07 mg sulphur for the fluid (or 0.074 mg H2S). The amount of water in the fluid is 0.79 mg (1.9-1.11), which
implies that the mole fraction of H2O in the fluid, XH2O, is 0.95, and that the amount of fluid at P and T is
0.864 mg (0.79+0.074) which corresponds to 3.9 wt% fluid in the system (0.864/(20.2+1.9)), the fluid having 8.2 wt% sulphur. The amount of pyrrhotite is 1.65 wt%, calculated on the basis of condensed phases
only (hydrous glass+pyrrhotite).
We now explore the individual effect of the main parameters that affect the calculated Ds, namely glass iron content, pyrrhotite stoichiometry, iron loss toward the capsule, and glass water content. If instead of 0.39 wt% FeO the glass contains 0.49 wt% (i.e. the amount of iron is allowed to increase by 1 sigma of EMPA), this increases Ds from 307 to 342. Similarly, if instead of FeS a stoichiometry of Fe5S6 is taken (1.2
mole of S for 1 mole of Fe), this means that 0.15 g of sulphur is locked into pyrrhotite, which decreases Ds to
a loss of 8 wt% of iron relative to bulk content, as observed in supra-liquidus charges by Scaillet & Macdonald (2004)), then this will increase Ds to 394. Finally, if the amount of H2O dissolved is 4 wt%
instead of 5.5 wt% (which would correspond to the possible melt H2O content of the charges with 6 wt%
sulphur), Ds decreases to 227. There is clearly a considerable uncertainty on our fluid/melt partition
coefficients, yet each parameter taken in isolation affects Ds by less than 40% when allowed to vary within a
reasonable range. Our assumptions of stoichiometric pyrrhotite and fixed melt water content, if incorrect,
lead to an overestimation of the calculated Ds. Conversely, other assumptions (in particular no Fe or Ca loss toward the fluid), if properly evaluated, would yield an underestimation of partition coefficients (i.e. real values are higher than the values listed in Table 2). This is in fact the main source of uncertainty in the
present work, since we have no control on the amount of dissolved fluid species other than H2O and S.
However, the work of Scaillet et al. (1998), using the same procedure, yielded for sulphur in silicic arc magmas partition coefficients that agree within a factor of 2 with those derived independently from remote sensing of volcanic plumes. We note in passing that this study explored the effect of CO2 and concluded that
this volatile species has no detectable effect on the partition behaviour of sulphur between fluid and melt in silicic magmas in the fO2 range explored. We thus conclude that the partition coefficients reported here are
accurate to within 50%, whilst the proportions of sulphide/sulphate are known to within 15%.
RESULTS
The experimental conditions together with run products and phase proportions are listed in Table 1. The melt compositions together with the calculated partition coefficients are listed in Table 2. Variations in melt sulphur content (Smelt) with fO2 (here expressed in log units notation relative to the NiNiO solid buffer, such
that NNO-1 means one log unit below NNO) are shown on Figure 1a. Also plotted is the Smelt of synthetic
metaluminous silicic melts held under similar P and T and bulk S content (Sbulk) conditions (Luhr, 1990;
Scaillet et al., 1998). The sulphur solubility of rhyolite melts is strongly dependent on their NK/A ratio, in addition to fO2. At 800°C, under reduced conditions (< NNO), Smelt rises from c. 50 ppm in metaluminous
rhyolite to nearly 1000 ppm in strongly peralkaline rhyolite (Fig. 1a). In the two less peralkaline compositions (ND and SMN), an increase in fO2 produces a smooth increase in Smelt, which broadly conforms with observed behaviour in other silicate melt compositions (e.g. Carroll & Webster, 1994). In
contrast, in the most peralkaline composition EBU, the increase in Smelt peaks at around NNO+1 and then
sharply decreases, so that at higher fO2 the relative order of sulphur enrichment for the three peralkaline
rhyolites is opposite to that observed below NNO. The enhanced sulphur solubility of peralkaline rhyolites
at low fO2 is in part related to the higher iron content (Table 2), which complexes with S (Carroll &
Webster, 1994), but may also be due to the greater proportion of oxygen anions in peralkaline melts relative to metaluminous varieties, since oxygen anions are believed to substitute for S (Carroll & Webster, 1994) via the following reaction:
1/2 S2 +O2- = S2- + 1/2 O2
This reaction makes no assumption as to the nature of the element complexed to sulphur in the melt. It simply states that, at fixed fS2, an increase in the activity of free oxygens will increase the amount of sulphur
dissolved. Given that peralkaline melts have more free oxygens than metaluminous ones (e.g., Mysen, 1988), this could be one explanation for their enhanced sulphur solubility at low fO2. At high fO2, the opposite, and
thus peculiar, trend displayed by EBU warrants further discussion. The above reaction predicts that an increase in fO2 decreases the sulphur solubility, if again it is assumed that fS2 does not change across the
interval of fO2 shown in Figure 1. However, rigorously evaluating the reason for such a trend would require
us to know the exact values of intensive parameters other than fO2, namely fS2 and the activities of oxygen
and sulphur anions in the melt, any of which is unknown in our experiments (and in almost all experimental work so far done at high P on aluminosilicate melts of geological interest). One possibility would be that our oxidized experiments with the EBU composition did not reach anhydrite saturation and thus that the
anhydrite in these charges represents a quench phase and that the drop in solubility observed at high fO2
simply reflects the fact that sulphur is being increasingly partitioned toward the fluid as fO2 increases. We
experimental conditions adopted in our study are similar to those of other experimental work aimed at defining the stability of anhydrite in silicate melts, in particular hydrous melts (e.g., Carroll & Rutherford, 1987; Luhr, 1990; Scaillet et al., 1998; Scaillet & Evans, 1999; Clemente et al., 2004), as are the criteria used to define anhydrite stability domains in magmas. In other words, if anhydrite is a quench product in our experiments, so it is in other experimental studies, in which case conclusions derived from those experiments about the stability field of anhydrite in magmas should be revised. Rather, we suggest that the trend shown by the EBU melt composition is a real feature that reflects the fundamental structural changes that occur in strongly peralkaline silicic liquids relative to metaluminous types, as noted in the introduction, and the control that fO2 exerts upon them. By analogy with what we observe at low fO2, we can only
speculate that the increase in fO2 dampens the role of oxygen anions in peralkaline melts, which results in a
decreased Smelt (at fixed fS2).
More generally, if sulphur solubility in hydrous silicic melts is a simple linear function of their iron content (at low fO2), as conventional wisdom would predict, then there would be no reason to have the huge
difference between metaluminous and peralkaline compositions that we document here (Fig. 1a). The very fact that Smelt increases by a factor of c. 5 between standard metaluminous rhyolitic and slightly peralkaline
melts having similar iron contents, indicates that the FeO content is not the sole parameter affecting sulphur behaviour in the studied compositions, unlike in dry basaltic systems (O’Neill & Mavrogenes, 2002). This is also shown by the three series of experiments done with various amounts of sulphur, in which the melt iron content decreases whilst the amount of sulphur dissolved in the melt increases (Table 2, series EBU 7, 8 and 9). For instance, at 900°C, the melt with 969 ppm dissolved sulphur has an FeO content of 6.32 wt%, whilst that with 2254 ppm of sulphur has an FeO content of 1.52 wt%. This trend is clearly due to our procedure of adding elemental sulphur, which forces the system to crystallise FeS which in turn removes FeO from the melt. It shows, however, that the FeO content and dissolved sulphur in hydrous silicic melts are not simply correlated. In this respect, the experimental study of Clemente et al. (2004) has clearly shown that in metaluminous rhyolites, the iron control on sulphur solubility is not straightforward, and that variations in
fS2, fH2S and fSO2 affect predominantly Smelt. This study has shown that in hydrous silicate melts, the Smelt
can be modelled as the result of two dissolution reactions, one involving H2S and the other SO2, as proposed
by Burnham (1979). Given the hydrous character of our experiments, it can be anticipated that the fugacities of sulphur-bearing species will exert a role, possibly a predominant one, on Smelt in peralkaline rhyolites as
well. Direct comparison of our results with experimental studies bearing on the sulphur solubility of
anydrous melts is therefore to a large extent meaningless (or of any anhydrous vs hydrous studies), since in the latter the dissolution reactions of S-bearing species cannot account for the role of H-bearing ones (i.e. H2S), leaving aside the profound structural changes produced by the incorporation of water into silicate
melts. In particular, the presence of hydrogen opens the possibility that Fe is not the element with which S preferentially complexes in silicate melts, but instead that H plays that role, as proposed by Burnham (1979), based on theoretical and experimental considerations, an hypothesis that is in agreement with the findings of Clemente et al. (2004). In other words, because both the nature and abundances of dissolving species (H2S vs S2 or SO2) and the sulphur complexes in the melt (H2S vs FeS) are likely to differ between
hydrous and anhydrous melts, there is no reason to expect that results gathered from the study of sulphur in anhydrous melts can be directly applicable to hydrous melts. If this statement could be rigorously
demonstrated, there would be no reasons for performing the present experimental work.
Whatever the mechanism of sulphur dissolution, our results show that at all values of fO2, the
sulphur-carrying capacity of peralkaline rhyolites is 5 to 20 times greater than their metaluminous
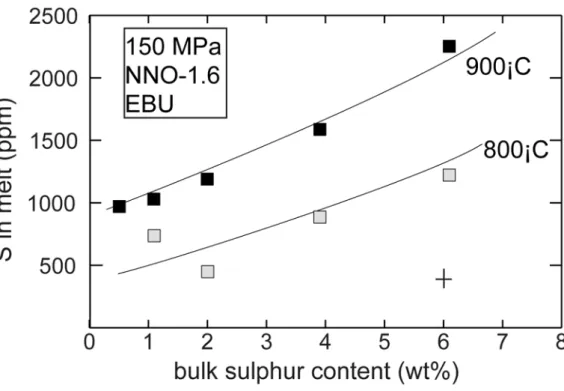
equivalents. Increasing the temperature to 900°C increases the Smelt by a factor of 2, other parameters being
kept equal (Fig. 2). Similarly, varying Sbulk from 0.5 to 6 wt% increases Smelt by 2-2.5 times, as a result of
increasing sulphur fugacity (Fig. 2). The increase may also reflect the fact that the melt composition is changing when sulphur is added, since it removes part of the iron in solution to produce sulphide.
Variations with fO2 in the sulphur content of fluid (Sfluid) over Smelt, or the partition coefficient DS,
are shown in Figure 1b for rhyolite melts having 1 wt% of Sbulk. Here again, the two less peralkaline
when anhydrite and pyrrhotite crystallise together, such as in charge ND5 which has a slightly lower DS
(Table 1). In the most peralkaline melt (EBU), however, the partition coefficient rises abruptly at fO2 >
NNO+1, behaviour similar to that found in silicic magmas from volcanic arcs (Scaillet et al., 1998). The reason for the limited variation in DS in the two less peralkaline melts is that the increase in sulphur
solubility with fO2 is compensated by crystallisation of lower proportions of anhydrite at high fO2 relative to
pyrrhotite at low fO2 (Table 1). In contrast, the increase in Ds in the most peralkaline melt is because it
crystallises slightly higher proportions of sulphide at low fO2, whilst at high fO2 this composition does not
crystallise anhydrite in higher modal amounts than ND and SMN. Because its solubility decreases beyond NNO+1, this results in an overall increase in the partition coefficient as fO2 rises.
A comparison with experimental results obtained on a natural metaluminous dacite (Scaillet et al., 1998) shows that, under the same T-fO2 conditions, a peralkaline rhyolite SMN) with bulk iron and sulphur
contents similar to those in the dacite crystallises approximately 30-40 % less sulphide (Fig. 1c). Even the most peralkaline rhyolite, with 7 wt% FeOtot (EBU, Table 1), crystallises less sulphide than the
metaluminous dacite, which has 4.4 wt% FeOtot. We interpret this as resulting from the fact that, when held
at the same fO2, the Fe2+/Fe3+ ratio is lower in peralkaline than in metaluminous melts (Gwin & Hess, 1989;
Gaillard et al., 2001), such that there is less Fe2+ available for sulphur complexation in the melt and consequently for sulphide crystallization. The lower modal proportion of sulphide in peralkaline rhyolites results in elevated fluid/melt partition coefficients, in particular for moderately peralkaline melts, even at low
fO2, differing in this respect from metaluminous melts (Scaillet et al., 1998). The partition coefficient
steadily increases for Sbulk between 1 and 6 wt%, but remains broadly constant for Sbulk between 0.5 and 1
wt% (Fig. 3). As for the solubility trend, this reflects an increase in fS2 perhaps coupled to a change in melt
chemistry (which becomes iron-poor as the bulk sulphur content increases). At bulk sulphur content lower than 4 wt%, a rise in temperature from 800 to 900°C decreases DS by only 10%, as a consequence of the
petrogenetic process favouring the formation of peralkaline over metaluminous silicic melts will minimise the possibility of sulphur loss via sulphide fractionation.
The increased solubility of sulphur in peralkaline melts is consistent with the apparent scarcity of modal sulphides in peralkaline rhyolites. We are aware of three occurrences. Crisp & Spera (1987) recorded scarce pyrrhotite microphenocrysts in comendites and pantellerites of the Tejeda volcano, Gran Canaria. Mungall & Martin (1996) noted rare pyrite phenocrysts in pantellerites of the Pico Alto volcano on Terceira Island, Azores. Lowenstern et al. (1993) found phenocrysts of pyrrhotite and molybdenite in pantellerites and pantelleritic trachytes from Pantelleria, Italy, the occurrence of molybdenite being apparently unique in a silicate magma.
SULPHUR CONTENT OF CRUSTALLY- AND MANTLE-DERIVED RHYOLITES General
Before using the above experimental results to constrain the atmospheric sulphur yields of rhyolites
associated with flood basalts, we need to fix possible limits on the bulk sulphur contents of rhyolites, which will depend on their source region. Two end-member petrogenetic models have been proposed bearing on sulphur enrichment in magmas: crystal fractionation of basaltic magmas, e.g. the Ethiopian ignimbrites (Ayalew et al., 2002), and partial melting of the lower-middle continental crust (albeit with variable mantle input), e.g. the Etendeka-Paraná deposits (Bellieni et al., 1986; Garland et al., 1995; Harris & Milner, 1997; Ewart et al., 1998, 2004). The Ethiopian rhyolites are peralkaline, whilst the felsic magmas of the Etendeka-Paraná province are predominantly metaluminous, being in addition slightly less silicic and more K2O-rich
than those in Ethiopia. Both types of magma have high iron contents, however, which is usually attributed to low fO2 during magma genesis (Ewart et al., 1998, 2004). Whatever their mode of origin, the sulphur content
of silicic magmas is controlled by the source composition during partial melting and by subsequent evolutionary processes. Sulphur in a magma can reside in fluid, melt and solids, the latter being mostly sulphides under the low fO2 thought to prevail in basalts and in the lower crust. In the following we first
consider a mantle origin (i.e., basalt fractionation) and then a crustal origin for rhyolites associated with trap sequences.
Mantle origin
Method
In basalts, sulphide stability largely dictates the possibility of generating a sulphur-rich silicic derivative since, given their high density, sulphides can easily settle out from the host magma. Thus, to produce a sulphur-rich rhyolite supposes that during fractionation the basalt does not crystallise significant amounts of sulphide. Generation of peralkaline rhyolites by fractionation of alkali basalt requires 80-90% crystallization (e.g., Barberi et al., 1975; Ayalew et al., 2002). Alkali basalts typically have bulk H2O contents of at least 1
wt%, CO2 contents sometimes higher than 1 wt%, and sulphur contents which can exceed 1000 ppm
(Clocchiatti et al., 1992; Bureau et al., 1999; Dixon et al., 1997; Wallace, 2002). They evolve at fO2 ≤ NNO
(Dixon et al., 1997). We have, therefore, calculated the conditions under which alkali basalts become saturated in sulphide during crystallisation, for bulk H2O-CO2 contents of 1-2 wt% as inferred from studies
of modern analogues (Dixon et al., 1997; Gerlach et al., 2002; Lange, 2002), using a Sbulk of 0.1 wt%, and
over a range of plausible redox conditions from NNO-2 to NNO+1 (Fig. 4). We also have calculated the corresponding proportions of bulk sulphur partitioned into sulphide and fluid phases (Fig. 5).
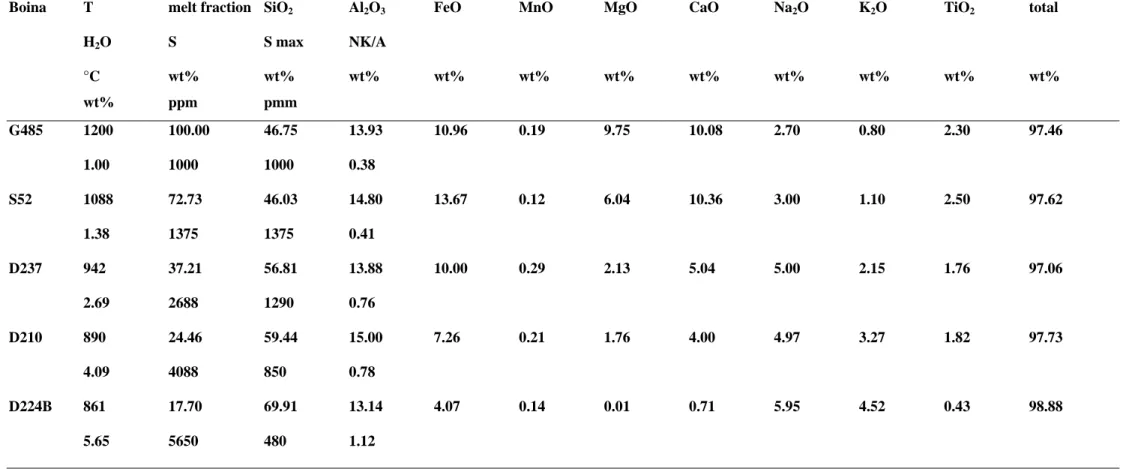
Melt compositions used. We used the basalt-rhyolite sequence of the Boina centre in the Afar rift (Barberi et al., 1975) as a proxy for the evolution of liquid compositions in a fractionating, mildly alkaline basalt series.
Although we could have used a thermodynamical model to simulate this evolution, available models still fail to reproduce the transition from metaluminous to peralkaline melts, a feature which is critical for the
understanding of sulphur behaviour, as shown below. The petrological and geochemical study of the Boina volcano concluded that the silicic magmas were derived from fractional crystallisation of transitional basalt (Barberi et al., 1975). Five representative compositions were used here: G485, S52, D237, D210, D224B (Barberi et al., 1975) (see Table 2). The degree of crystallization was determined using the K2O content,
assuming perfectly incompatible K2O behaviour during crystallization, a reasonable assumption except for
composition D224B in which K-feldspar crystallises, and thus for which the extent of crystallization relative to the parent basalt G485 is a minimum. The following proportions of residual liquids were calculated: S52, 73%; D237, 37%; D210, 24%; D224B, 18%. This natural liquid line of descent shows that peralkaline rhyolites can be produced from basalt crystallisation after c. 80 wt% crystallization (Table 3, composition D224B).
Table 3. Melt compositions used in the calculations
Boina T melt fraction SiO2 Al2O3 FeO MnO MgO CaO Na2O K2O TiO2 total
H2O S S max NK/A °C wt% wt% wt% wt% wt% wt% wt% wt% wt% wt% wt% wt% ppm pmm G485 1200 100.00 46.75 13.93 10.96 0.19 9.75 10.08 2.70 0.80 2.30 97.46 1.00 1000 1000 0.38 S52 1088 72.73 46.03 14.80 13.67 0.12 6.04 10.36 3.00 1.10 2.50 97.62 1.38 1375 1375 0.41 D237 942 37.21 56.81 13.88 10.00 0.29 2.13 5.04 5.00 2.15 1.76 97.06 2.69 2688 1290 0.76 D210 890 24.46 59.44 15.00 7.26 0.21 1.76 4.00 4.97 3.27 1.82 97.73 4.09 4088 850 0.78 D224B 861 17.70 69.91 13.14 4.07 0.14 0.01 0.71 5.95 4.52 0.43 98.88 5.65 5650 480 1.12
Melt compositions from Barberi et al. (1975)
Column melt fraction gives the amount of residual melt calculated assuming that liquid G485 is parental to all others and that K2O
behaves as a perfectly incompatible element.
Column H2O gives the H2O content of the residual melt in the case of a basalt melt crystallising without CO2
Column S gives the melt sulphur content if sulphur behaves as a perfectly incompatible element (no sulphide crystallisation and no fluid saturation)
Column S max gives the melt sulphur content corrected for sulphide crystallisation (aFeS = 1) for an fO2 at NNO-2 and with no CO2
present.
Temperatures were calculated assuming a linear relationship between melt fraction and T, and using a liquidus of 1200°C for basalt G485 and 890°C for the rhyodacite D210 (Table 3). Clearly, such an
approximation is unlikely to be valid in detail. We are, however, interested in fixing the general behaviour of C-H-O-S volatiles in a crystallising basalt, for which we need to know the approximate amount of residual melt available at each temperature in order to calculate the partitioning of each volatile species between melt and fluid using mass balance constraints and solubility laws (see below). Any departure from a linear trend will either promote or delay the attainment of volatile and sulphide saturation. This will not affect, however, the general conclusion derived from our analysis, which concerns the importance of the role of CO2. In
addition, we note that our assumption of linearity predicts a temperature of 861°C for the peralkaline rhyolite D224B, which is in reasonable agreement with available estimates for such compositions (Bizouard et al., 1980; Ayalew et al., 2002; Nekvasil et al., 2004). All calculations descibed below were performed for a pressure of 150 MPa since our experimental results were collected at this pressure.
Solubility and activity models. For a given initial volatile content and residual melt fraction, the amount of
volatiles dissolved in the melt was calculated using the solubility models for H2O and CO2 of Dixon et al.
(1995). In the absence of appropriate solution models for both H2O and CO2 in intermediate melt
compositions, those for basalt were used. For sulphur we use the solubility model of Scaillet & Pichavant (2005). The latter is an empirical model that allows us to relate the melt sulphur content to the sulphur fugacity, for a variety of melt compositions including hydrous basalts. This model was derived in an attempt
to evaluate the behaviour of sulphur in hydrous mafic magmas, for which there are few experimental data
(apart from those of Luhr (1990)). The model has the form:
log S = a P+ b T+ c NNO3+ d NNO2+ e NNO FFS + f FFS + giWi (1)
where S is the total sulphur concentration in ppm, P the pressure in bars, T the temperature in °C, NNO and FFS are the referenced fO2 and fS2 against the Ni-NiO and Fe-FeS solid buffers respectively, Wi
represents the weight % of oxide i, and a,b,c, d, e, f and gi are fitted parameters (Table 4) which were
obtained by linear regression of the experimental data bases of Clemente et al. (2004), Luhr (1990) and O’Neill & Mavrogenes (2002). The summation is carried out over all major oxides, including FeO, Fe2O3
OH- and H2O. This third order polynomial function is necessary to reproduce the inverted bell-shaped
pattern of sulphur solubility in silicate melts (e.g., Carroll & Webster, 1994; Clemente et al., 2004), whilst the crossed fO2-fS2 term is needed to take into account the effect of varying fS2 on the relationship between fO2 and S in melt (Clemente et al. 2004).
Table 4 : regression coefficients for the empirical model of sulphur solubility
P 7.28E-06 NNO3 0.00488128 NNO2 0.0818873 NNOFFS -0.0224068 T 0.00084107 FFS 0.22801636 SiO2 -0.012467 Al2O3 -0.0015766 Fe2O3 0.37362348 FeO 0.0674383 MgO 0.01121929 CaO 0.02000831 Na2O 0.05644745 K2O -0.0248037 TiO2 0.00672403 H2O 0.06868295 OH 0.05778453 From Scaillet & Pichavant (2005)This model encompasses a large SiO2 range (35-80 wt%), and reproduces measured fS2 within an average of
0.65 log unit, over more than 15 log units when normalised to the FFS solid buffer. Finally, note that the model of Scaillet & Pichavant (2005) is calibrated only for metaluminous compositions, which implies that sulphur solubilities of intermediate or silicic peralkaline compositions corresponding to any given fS2 are
underestimated by this model and thus that sulphide activities calculated here for those melts are overestimated (see below).
For any fO2 and fS2, the activity of FeS in the melt was calculated from the following equilibrium,
using thermodynamic data from O’Neill & Mavrogenes (2002):
FeS + 1/2 O2 <--> FeO + 1/2 S2 (2)
The activity of FeO in the melt was calculated by determining the Fe2+/Fe3+ ratio of the melt using the Kress & Carmichael (1991) method and an activity coefficient for FeO of 1.4 (O’Neill & Mavrogenes, 2002). For any melt in which the calculated FeS activity was found to exceed 1, the melt sulphur content was fixed to that corresponding to an aFeS=1, and the excess sulphur was converted to sulphide (we thus neglect the role of additional elements such as Ni or Cu which could promote early saturation in sulphide).
The fluid phase composition was calculated using a Modified Redlich-Kwong type equation of state (MRK), using as input parameters fH2O, fCO2 and fS2. It must be stressed that, regardless of our current
knowledge or body of experimental constraints on the sulphur content of fluids in magmas, the sulphur content of a fluid coexisting with silicate melts can be calculated using a thermodynamic approach, provided that appropriate solubility laws exist for the main volatiles species. This stems from the fact that in the C-O-H-S system, once fH2O, fCO2 and fS2 are fixed (at P and T), the fugacities of all other volatile species are
fixed as well (Holloway, 1987; Scaillet & Pichavant, 2003; 2004). In other words, the composition of the fluid is uniquely defined, including its sulphur content. This allows us to compute the partition coefficients of sulphur between fluid and melt, since the melt sulphur content is fixed by fS2 (and fO2). The accuracy of
such an approach relies, among other things, on our knowledge of the thermodynamic properties of C-O-H-S fluids which appear to be reasonably well known (e.g., Shi, 1992), at least in the low pressure range (<1000 MPa). Using this approach, Scaillet & Pichavant (2003) showed that there was a good overall agreement between calculated and measured fluid compositions for silicic arc magmas. The same method has been applied to active basaltic volcanoes (Scaillet & Pichavant, 2005), for which remote sensing of volcanic gases can be used to constrain the gas chemistry at depth. In this case too, generally good agreement is observed (Scaillet & Pichavant, 2005). Therefore, although we recognise that the current experimental data base on the sulphur content of fluids of mafic magmas is almost non-existent, this gap can be partly circumvented by
using a thermodynamic approach which, when compared to independent estimates, appears to retrieve the correct order of magnitude in terms of the sulphur content of magmatic fluids.
Procedure. For any given initial H2O, CO2 and S contents, the equilibrium distribution of those volatiles
between melt, fluid and sulphide was calculated via an iterative procedure by finding the fugacities that satisfy the following two sets of conditions: First, the condition of chemical equilibrium:
fH2Omelt = fH2Ofluid, (3) fCO2melt = fCO2fluid, (4) fS2melt = fS2fluid (5)
Second, the mass balance constraints:
H2Ototal = H2Omelt+H2Ofluid (6)
CO2total = CO2melt+CO2fluid (7)
Stotal = Smelt+Sfluid+Ssulphide (8)
The mass balance equations also take into account the amounts of C, S and H in other species such as H2S,
SO2, CO and CH4. In the H2O-only case, with a bulk H2O content of 1 wt%, we considered that the
crystallising basalt does not reach fluid-saturated conditions since the H2O content of the residual melt
reached after 82% crystallisation is 5.65 wt% (Table 3), that is on the verge of H2O saturation of rhyolitic
melts at 150 MPa (e.g., Zhang, 1999). In this case, the sulphur was partitioned between melt and sulphide only.
Consider, as an example of the calculation procedure, the case of a basalt carrying only H2O and
sulphur crystallising at an fO2 of NNO-2. At 890°C, the basalt has 24.46 wt% residual liquid with a
composition of D210 (Table 3). If sulphur had a perfectly compatible behaviour (bulk S of 1000 ppm), then the melt composition D210 would have 4088 ppm of dissolved sulphur (1000/0.2446). Using the model of Scaillet & Pichavant (2005), this amount of dissolved sulphur would correspond to an fS2 of 0.035 MPa, or
much sulphur in solution and some of it must be withdrawn in order to decrease the aFeS to unity, since by definition the activity of FeS cannot increase beyond 1 (for appropriate standard states for solids and liquids at P and T). The next step is thus to remove the excess sulphur in solution in the melt until the calculated fS2
corresponds to an aFeS=1, and convert that excess sulphur into immiscible/solid sulphide (considering also the constraints set out in equations (3) to (8)). For that specific case, using equation (1), we calculate that saturation of melt composition D210 with sulphide (aFeS=1, because we perform an equilibrium
calculation, aFeS in the silicate liquid is equal to that in the sulphide) is achieved when fS2 = 10-4 MPa at
890°C and NNO-2, which corresponds to a melt sulphur content of 850 ppm. In other words, it means that of the 1000 ppm sulphur dissolved in the molten basalt at 1200°C, 208 ppm (850x0.2446) are dissolved in the residual melt at 890°C, the remainder (792 ppm = 1000-208) being locked up in sulphide, since under these conditions no fluid is present (Table 3, the melt water content is below the saturation value of an andesitic melt at 150 MPa (Burnham, 1979)). The introduction of CO2 into the system promotes early fluid saturation
and thus the sulphur content of melt at 890°C (i.e., when there is only 24.46 wt% residual melt) must be lower than when only H2O is present. For instance, implementing the example above with addition of CO2,
that is, a basalt with 1 wt% H2O and 1 wt% CO2 at NNO-2, we calculate that at 890°C the sulphur content of
the residual melt is 635 ppm. Finally, as noted above, peralkaline melts dissolve more sulphur than metaluminous types, so our calculated sulphide proportions should be considered maxima for the most fractionated melt (D224B, Table 3). Assuming, on the basis of our experimental results, that the peralkaline melt D224B dissolves 5 times more sulphur than that calculated by the model of Scaillet & Pichavant (2004), or 4250 ppm, then it follows that such compositions would be barely saturated at NNO-2, the proportion of sulphide being low. This implies that the amounts of CO2 needed to scavenge the sulphur
toward the fluid, which under our P-T conditions is calculated to be 2 wt% (see below), must be considered maximum values where peralkaline derivatives are produced.
Results
The results of our calculations are shown on Figures 4, 5 and 6. We have considered three cases corresponding to different bulk volatile contents: case (1), 1 wt% H2O and 1000 ppm sulphur, case (2) 1
wt% H2O, 1 wt.% CO2 and 1000 ppm sulphur, and case (3) 2 wt% H2O, 2 wt% CO2 and 1000 ppm sulphur.
Figure 4a shows the evolution of aFeS of a basalt with degree of crystallization, calculated at four different
fO2. An H2O-bearing (1 wt%) but CO2-free alkali basalt crystallising at or above NNO-1 is
sulphide-saturated after c. 60% of crystallization. At NNO-2, saturation in sulphide is slightly delayed, to 70% crystallization. Figure 5a shows the evolution of the proportion of bulk sulphur sequestered in sulphide with degree of crystallization, corresponding to the calculations shown in Fig. 4a. By the time the residual melt is peralkaline (20-30% liquid, see Table 2), it can be seen that 90 wt% of Sbulk is locked up in sulphide (Fig.
5a). Further crystallisation results in massive sulphide precipitation; after 82% crystallisation more than 80 wt% of Sbulk is locked up in sulphide. The calculations corresponding to case (2) illustrate the role of CO2.
When this volatile is introduced, the sulphur behaviour is dramatically altered because fluid saturation occurs at an early stage, owing to the low solubility of CO2 in silicate melts (e.g., Dixon et al., 1995) and
chemical equilibrium demands that sulphur is also partitioned into the fluid, thus lowering Smelt and the
activity of sulphide. With a bulk CO2 content of 1 wt% and 1 wt% H2O (case 2), similar to the bulk content
inferred for Kilauean or Etnean basalts (Clocchiatti et al., 1992; Gerlach et al., 2002), the calculations show that sulphide saturation is slightly delayed compared to the H2O-only case (Fig. 4). However, the main
difference relative to the CO2-free situation (case 1) is that after 80% crystallisation, at least 60 % of Sbulk is
in the fluid phase, whatever the prevailing redox conditions, rising to 90% for fO2 = NNO+1 (Fig. 5b).
Finally, case (3) shows that at fO2 = NNO-2, for initial CO2 and H2O contents of 2 wt% each, a crystallising
alkali basalt remains below sulphide saturation, even after 80% crystallization when derivative liquids are rhyolitic (Fig. 6). Under these conditions 95% of Sbulk is hosted by the fluid, even after 80 wt% of
We stress that such elevated bulk volatile contents have been inferred for some alkali basalts (Dixon
et al., 1997), including those in flood sequences (Lange, 2002). In addition, recent experimental data on the
generation of silica-saturated alkalic suites from alkali basalts suggests that the latter contain at least 0.5 wt% H2O, and possibly up to 2 wt% (Nekvasil et al., 2004), which reinforces the view that trap basalts may be
considerably richer in fluids than those at mid-ocean ridges. The above calculations show that, provided they are CO2- and H2O- rich, basaltic magmas can readily produce sulphur-rich derivatives, regardless of the
imposed redox conditions. The amount of CO2 appears to be the key parameter, since it triggers early
volatile exsolution which prevents sulphide precipitation. Without CO2, fO2 exerts a prime control on the
amount of sulphide crystallisation in basalt with a certain initial sulphur content. A reduced CO2-poor
basaltic magma will yield silicic derivatives which are sulphur-poor owing to extensive sulphide
precipitation, whilst a basalt crystallising at or above NNO+1, as in arc settings, may give rise to sulphur-rich silicic magmas (Scaillet & Pichavant, 2003; Scaillet et al., 2003). The presence of CO2 in large amounts
significantly reduces this fO2 control. If alkali basalts are CO2-rich, they can release >90% of their Sbulk
during crystallisation. After the stage of rhyolite production, the ultimate fate of sulphur will be dictated by the composition of the melt, particularly its NK/A ratio (in addition to fO2, Scaillet et al., 1998). As our
experimental data show, metaluminous felsic magmas can carry less sulphur in solution than peralkaline types, especially at low fO2. We conclude that if alkali basalt fractionation produces peralkaline rhyolites,
these may well be sulphur-rich, concentrating a significant proportion of the original sulphur content of the parent magma.
Crustal origin
Method
To constrain the sulphur content of silicic melts produced by partial melting of the lower crust, we have calculated the sulphur contents of (1) anatectic melts and (2) metamorphic fluids in the amphibolite-granulite facies. The sulphur content of crustal melts can be calculated using the solubility model for