HAL Id: hal-00304952
https://hal.archives-ouvertes.fr/hal-00304952
Submitted on 1 Jan 2004HAL is a multi-disciplinary open access archive for the deposit and dissemination of sci-entific research documents, whether they are pub-lished or not. The documents may come from teaching and research institutions in France or abroad, or from public or private research centers.
L’archive ouverte pluridisciplinaire HAL, est destinée au dépôt et à la diffusion de documents scientifiques de niveau recherche, publiés ou non, émanant des établissements d’enseignement et de recherche français ou étrangers, des laboratoires publics ou privés.
interactions of vegetation and environmental factors
M. P. Kennedy, K. J. Murphy
To cite this version:
M. P. Kennedy, K. J. Murphy. Indicators of nitrate in wetland surface and soil-waters: interactions of vegetation and environmental factors. Hydrology and Earth System Sciences Discussions, European Geosciences Union, 2004, 8 (4), pp.663-672. �hal-00304952�
Indicators of nitrate in wetland surface and soil-waters: interactions of vegetation and environmental factors Hydrology and Earth System Sciences, 8(4), 663672 (2004) © EGU
Indicators of nitrate in wetland surface and soil-waters:
interactions of vegetation and environmental factors
M.P. Kennedy
1,2and K.J. Murphy
21Aquatic Environments Research Centre, Department of Geography, University of Reading, Reading, RG6 6AB, UK
2Institute of Biomedical and Life Sciences, Division of Environmental and Evolutionary Biology, Graham Kerr Building, University of Glasgow, Glasgow, G12 8QQ, UK.
Email for corresponding author: [email protected]
Abstract
This paper describes a new bio-indicator method for assessing wetland ecosystem health; as such, the study is particularly relevant to current legislation such as the EU Water Framework Directive, which provides a baseline of the current status of surface waters. Seven wetland sites were monitored across northern Britain, with model construction data for predicting eco-hydrological relationships collected from five sites during 1999. Two new sites and one repeat site were monitored during 2000 to provide model test data. The main growing season for the vegetation, and hence the sampling period, was MayAugust during both years. Seasonal mean concentrations of nitrate (NO3) in surface
and soil water samples during 1999 ranged from 0.01 to 14.07 mg N l1, with a mean value of 1.01 mg N l1. During 2000, concentrations
ranged from trace level (<0.01 mg N l1) to 9.43 mg N l1, with a mean of 2.73 mg N l-1. Surface and soil-water nitrate concentrations did not
influence plant species composition significantly across representative tall herb fen and mire communities. Predictive relationships were found between nitrate concentrations and structural characteristics of the wetland vegetation, and a model was developed which predicted nitrate concentrations from measures of plant diversity, canopy structure and density of reproductive structures. Two further models, which predicted stem density and density of reproductive structures respectively, utilised nitrate concentration as one of the independent predictor variables. Where appropriate, the models were tested using data collected during 2000. This approach is complementary to species-based monitoring, representing a useful and simple tool to assess ecological status in target wetland systems and has potential for bio-indication purposes.
Keywords: bio-indicators, surface water, water quality, wetland vegetation
Introduction
Nutrient enrichment from point sources such as sewage treatment works and from diffuse agricultural inputs may lead to problems of increased plant biomass production in rivers and lakes, and exacerbate the problems associated with resultant reduced dissolved oxygen concentrations within these systems (Neal and Whitehead, 2002). Standing waters are also under threat worldwide from various land-use pressures, including agriculture (Lemly, 1994), drainage (Sheil and Wells, 1983; Gerakis and Kiriaki, 1998), and flood control management (Washitani et al., 1997). Even oligotrophic lakes in Western Europe, located in upland areas not normally subject to such pressures, are under threat of acidification and also eutrophication, primarily from atmospheric nitrogen deposition (Murphy, 2002).
Many wetlands are now recognised as important ecosystem resources and have varying levels of protection.
For example, via the Ramsar Convention (RAMSAR Convention Bureau, 1990), via inclusion in the Natura 2000 network of the European Union (Directive on the Conservation of Wild Birds: 79/409/EEC) or, more locally (in a UK context), as Special Areas of Conservation (SACs), Sites of Special Scientific Interest (SSSIs) and local nature reserves. However, wetlands are still amongst those habitats most vulnerable to disruption by human interference, both intentional and accidental (Etherington, 1983).
Studies of various wetland systems have provided evidence that the underlying hydrology is often both complex and difficult to quantify (Grieve et al., 1995; Gilvear et al., 1997). Within individual sites, variations in hydrological and hydrochemical regimes are major factors driving wetland vegetation composition and structure, (Sjors, 1950; Gorham, 1953; Ingram, 1967; Damman and Dowhan, 1980; Malmer, 1986; Mountford and Chapman,
1993; Kennedy, 2001), and may control the distribution of individual species (Brown and Scott, 1997; Kennedy and Murphy, 2003; Kennedy et al. 2003). Certain studies have also begun to elucidate the role of riparian wetlands in such systems as potential nutrient stores (e.g. Prior and Johnes, 2002) and it is recognised that in modelling sequential routing through agricultural hillslopes and riparian wetlands is required to better understand in-stream nutrient loading. Legislative drivers in many parts of the world now require the assessment of biological, morphological, water quality and hydrological quality elements to define baseline reference conditions for freshwaters, including wetlands. Within this framework, there is often a strong emphasis on the use of ecological assessments (see Murphy et al., 2002). Within the EU, the Water Framework Directive (WFD,
Establishing a framework for community action in the field of water policy: 2000/60/EC) fills this role and requires
baseline assessments for river catchments and for standing waters. Whilst no specific reference is made to freshwater wetland systems within the WFD, they are covered under transitional waters, and as parts of surface water bodies and protected areas, etc. under the Common Implementation
Strategy for the Water Framework Directive (2000/60/EC).
They are also integral to the principal of integrated monitoring of freshwaters at the catchment scale (Kennedy, 2001; Murphy et al., 2002). Furthermore, The EC Nitrate
Directive (91/676/EEC) is concerned with the control of
nitrate inputs into the environment, including wetlands. As such, the need for ecological assessments that are relatively simple to implement is clear.
Assessments using plant functional types in community descriptions and biogeography have great potential, and should be seen as complementary to traditional taxonomic methodologies (Duckworth et al., 2000). Within wetlands, there has been success in recent years in applying trait-based assessments to the understanding of vegetationhydrology interactions (Murphy et al., 1994; Hills et al., 1994; Ali et
al., 1999; Willby et al., 2000; Kennedy and Murphy 2003;
Kennedy et al., 2003). However, with limited exceptions (e.g. Vretare et al., 2001), linkages remain to be made between phenotypic responses and specific functions such as nutrient uptake capacity of wetland vegetation. Nonetheless, recent complementary work has begun to characterise wetland community types in relation to differences within their underlying hydrological and hydrochemical regimes, and in terms of representative vegetation attributes (Kennedy, 2001).
This paper describes the results of a study undertaken at sites across northern Britain involving the monitoring of structural features (species richness, stem density and reproductive structure density, and nearest-neighbour
distance) within a range of tall herb fen and mire systems. Models are described which predict interactions between nitrate, other hydrochemical and hydrological variables, and the structure of wetland vegetation. The study therefore forms the basis for a tool which uses non species-specific vegetation variables as a bio-indicator to assess ecological status of typical freshwater wetland vegetation. As such, the tool has potential global applicability.
Study sites
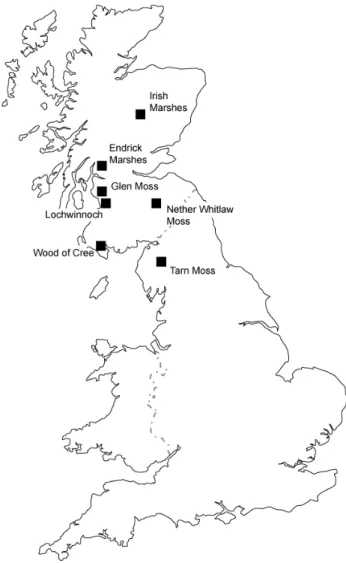
Fifty-five stations along eleven transects at seven wetland sites were monitored during 1999 and 2000 (see Table 1; Fig. 1). The main growing season for the vegetation (and hence the sampling period) was MayAugust. Sampling was conducted 18th May17th August during 1999, and 22nd May3rd August during 2000. At each station, the water level and bulked soil and surface water chemistry were measured and the vegetation characterised. Fixed stations
Fig. 1. Field site locations in Scotland and Northern England sampled
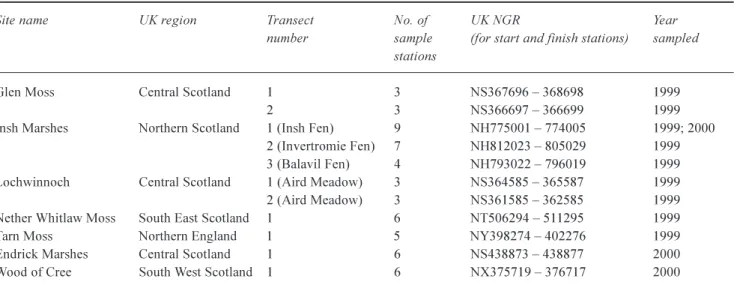
Indicators of nitrate in wetland surface and soil-waters: interactions of vegetation and environmental factors Table 1. Sites sampled during 1999 and 2000, showing number of sample stations per transect, UK locations, and grid references. Site name UK region Transect No. of UK NGR Year
number sample (for start and finish stations) sampled stations
Glen Moss Central Scotland 1 3 NS367696 368698 1999
2 3 NS366697 366699 1999
Insh Marshes Northern Scotland 1 (Insh Fen) 9 NH775001 774005 1999; 2000
2 (Invertromie Fen) 7 NH812023 805029 1999
3 (Balavil Fen) 4 NH793022 796019 1999
Lochwinnoch Central Scotland 1 (Aird Meadow) 3 NS364585 365587 1999
2 (Aird Meadow) 3 NS361585 362585 1999
Nether Whitlaw Moss South East Scotland 1 6 NT506294 511295 1999
Tarn Moss Northern England 1 5 NY398274 402276 1999
Endrick Marshes Central Scotland 1 6 NS438873 438877 2000
Wood of Cree South West Scotland 1 6 NX375719 376717 2000
Table 2. Site representation within relative TWINSPAN groups
for average 1999 vegetation data, showing indicator species; G = Glen moss; I = Insh marshes; L = Lochwinnoch; N = Nether Whitlaw moss; T = Tarn moss. See Kennedy (2001) for full details.
TWINSPAN Membership Dominant/indicator
species group 1 (n=6) I: 7, 11 Carex lasiocarpa L: 1, 2, 4 N:1 2 (n=9) I: 4, 8, 9, 18, 19 Galium palustre L: 5, 6 T: 1, 2 3 (n=7) I: 1, 2, 3, 5, 6, 10, 14 Carex panicea 4 (n=11) G: 1, 2, 3, 5, 6 Carex rostrata I: 20, 21 N: 4, 5, 6 T: 3 5 (n= 6) I: 12, 13, 15, 16 Potamogeton N: 2, 3 polygonifolious 6(n=3) G: 4 Vaccinium oxycoccus T: 4, 5 Eriophorum angustifolium Calluna vulgaris Erica tetralix were established at intervals of 3050 metres along each
transect and were visited monthly during the plant growth season (MayAugust) of 1999. This was repeated during 2000 at Insh Fen and at two new sites: Endrick Marshes and Wood of Cree. The wetland vegetation surveyed represented a range of UK National Vegetation Classification (NVC) community types (Rodwell et seq., 1991; see Table 2), comprising various tall herb fen, swamp, mire and rush pasture communities (Kennedy, 2001). These also fall within wider CORINE biotopes (EU Coordination of Information on the Environment; Devillers et al., 1991) comprising bottle sedge beds, and Epilobio-Juncetum effusiia and
Sphagno-Caricetum rostratae vegetation types.
Methods
ENVIRONMENTAL DATA
At each station, water level range gauges (see Bragg et al., 1994) were installed to a maximum depth of 75 cm in the wetland soils, following removal of a soil core with a hand-held auger. These were used to measure minimum (MIN: cm) and maximum (MAX: cm) water levels relative to ground surface during periods between sampling. Overall levels of fluctuation (FLU: cm) between sampling periods were derived from these two readings. Water levels (WAT: cm) were measured using fully perforated dipwells installed to a depth of 75cm alongside the gauges. The pH and electrical conductivity (CON: mS cm s1) were measured in
each dipwell using Hanna meters. This followed a purging and refilling of each dipwell using a 50 ml syringe connected to a length of PVC tubing. Soil redox potential (RED: mV) was measured at a soil depth of 23 cm using a Hanna meter
with a self-referencing platinum electrode probe. Following evacuation and re-filling, water samples were taken from each dipwell (therefore representing either a soil water sample, or a mixed soil/ surface water sample at stations
where standing water was present) using a 50 ml syringe and were placed into acid-washed PVC bottles in an insulated cool-box. On return to the lab, the samples were filtered through 0.5 mm Whatman GF/C glass fibre filters and Cl, F, NO3, and SO42 were determined from
sub-samples using a DIONEX ion chromatograph (QIC Model). Samples were eluted with sodium hydroxide (Na2CO3/
NaHCO3) solution and conductivity was reduced with dilute
sulphuric acid (H2SO4) to suppress interference. The
detection limit for these elements was 0.02 mg l hr1. K and
Na were determined using flame photometry. Ca, Mg and Mn were determined using flame atomic absorption spectrometry (AAS); samples were dosed with strontium nitrate solution (0.4%) to suppress interference for Ca and Mg. Fe was determined by graphite furnace AAS. Samples were diluted where appropriate and the detection limit was 0.01 mg l1 (see Grieve et al., 1995 for full details).
VEGETATION DATA
At each sample station, species assemblage and richness (S, per m2) was recorded within a 1m × 1m quadrat;
nomenclature followed Stace (1997). Stem density (STDE) and density of reproductive structures (REPR) was estimated from three random counts conducted within a 10cm × 10cm quadrat (Kennedy, 2001). Nearest-neighbour distance (NENE) was measured between three random pairs of stems and scored on a 15 scale (1 = 0 to <2 cm; 2 = 2 to <4 cm; 3 = 4 to <6 cm; 4 = 6 to <8 cm; 5 = >8 cm: Kennedy, 2001). Shade was estimated where 0 = no shade and 5 = heavy shade.
DATA ANALYSIS
Site data for 1999 were classified into groups, based upon relative species abundances, using TWINSPAN (Two-Way Indicator Species Analysis (Hill, 1979): see Kennedy (2001) for full details).
A constrained ordination analysis, with species data constrained upon environmental data, was conducted using Canonical Correspondence Analysis (CCA) within the Canoco for Windows package (ter Braak and milauer, 1998). Environmental variables which were auto-correlated (minimum and average water level, and sodium (Na) concentration: indicated by a Variance Inflation Factor > 20) were omitted. Monte-Carlo permutation tests were conducted to determine which remaining variables significantly influenced the ordination (p < 0.05).
Three models were constructed from the 1999 dataset. In the first model the independent variable was nitrate concentration and the predictor variables were species richness, nearest neighbour distance and density of
reproductive structures. In the second model the independent variable was stem density and the predictor variables were average water level, average minimum water level, degree of water table fluctuation, pH and nitrate concentration. In the third model, the independent variable was density of reproductive structures and the predictor variables were pH and nitrate concentration. The response curve of each variable (i.e. linear, cubic, quadratic) was assessed in relation to independent variables using SPSS 9.0. Stepwise regressions were then carried out, starting with full models. Variables were removed if they explained little or no variance in the dependent variable (an increase in the R2 of at least 0.03). Predicted scores were compared with observed values by calculation of the product-moment correlation coefficient and residuals were checked for normality by the construction of normal probability plots. Models were tested, where appropriate, using data collected in 2000 from independent sites and repeat sites.
Results
TWINSPAN groups for 1999 contained sample stations from each of the various sites (Table 2), indicating the suitability of the data for the construction of generally applicable models.
During both 1999 and 2000 a range of soil and surface water conditions was observed over the sites, with saturated and unsaturated soils and comparable ranges in pH, conductivity and nutrient status observed in both years (Table 3). Slightly drier surface conditions were observed at transect 1 within the Insh Marshes during 2000, although the largest levels of water table fluctuation were also recorded here. However, nitrate concentrations were somewhat lower overall in 2000. Mean water levels were slightly lower at the two independent test sites (Endrick Marshes and Wood of Cree) in 2000 than those measured during 1999 at the sites used to construct models (Glen Moss, Insh Marshes, Lochwinnoch, Nether Whitlaw Moss and Wood of Cree). However, inundation during the sampling periods was experienced during both years, as were variations in the overall level of water table fluctuation: levels of fluctuation were within comparable limits across the two years.
Mean nitrate concentrations in the water samples from all of the sites monitored during 1999 ranged from 0.01 to 14.07 mg NO3-N l1, with a mean concentration of 1.01 mg
l1 (s.e. = 0.24). During 2000 (model test data) concentrations
ranged from trace level (< 0.01) to 9.43 mg NO3-N l1, with
a mean of 2.73 mg l1 (s.e. = 1.73).
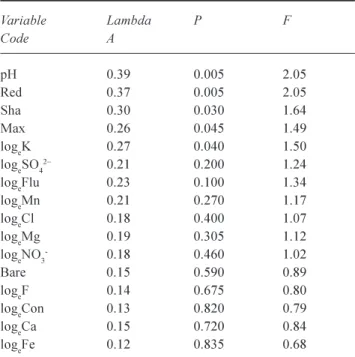
Of the environmental variables monitored, five influenced significantly the ordination of the species and site data (Table
Indicators of nitrate in wetland surface and soil-waters: interactions of vegetation and environmental factors Table 3. Ranges of mean site and environmental variable values per transect for (a) 1999 and (b) 2000; trace = undetectable at <0.01mg l -1 (a) G LEN M OSS L OCHWINNOCH I NSH M ARSHES N ETHER T ARN M OSS W HITLA W M OSS T1(n=3) T2(n=3) T1(n=3) T2(n=3) T1(n=9) T2(n=7) T3(n=4) (n=6) (n=5) Variable Min. Max. Min. Max. Min. Max. Min. Max. Min. Max. Min. Max. Min. Max. Min. Max. Min. Max. Degree of shading 0. 7 0. 7 0. 3 1 1. 0 1. 3 0 1 0 0 0 0 0 0 0. 0 2 .0 0. 0 0. 7 W
ater table relative to surface (cm)
-6 17 -1 2 0 1 -1 0 5 -3 0 3 -2 13 -1 6 8 0 2 3 -6 2 Maximum water table relative to surface (cm) -3 17 1 3 1 2 10 21 -1 6 18 1 18 -2 10 0 2 6 3 11 Minimum water table relative to surface (cm) -1 7 8 -1 6 -9 -1 0 -1 1 3 -3 5 -1 -7 12 -3 9 5 0 2 0 -1 1 -2 Overall level of water table fluctuation (cm) 9 14 12 18 2 2 15 22 5 19 3 8 4 32 0 7 6 15 Redox (mV) -6 7 69 -4 3 15 1 -5 8 12 5 -8 0 -1 8 -4 7 26 3 -7 2 87 -4 2 21 6 -6 4 8 9 13 89 pH 5.77 6.30 5.41 5.63 5.0 6.0 6.1 6.5 5.68 6.56 5.67 6.18 5.70 5.95 5.25 6.33 5.17 6.17 Conductivity (m S/cm/s -1) 168 329 140 198 187 271 638 971 121 666 195 355 234 403 146 1 344 85 436 Bare ground (%) 2 3 0 3 0 5 2 7 0 24 0 24 2 26 0 3 4 0 18 Fe (mg l -1) trace 0.18 0.03 0.15 0.1 1 0.21 trace 0.05 0.06 1.51 0.03 0.78 0.13 0.87 0.05 0.76 0.01 0.37 Mn (mg l -1) trace 0.03 trace trace 0.04 0.21 trace 2.29 trace 0.28 0.01 0.38 0.01 0.69 trace 0.05 trace 0.77 Mg (mg l -1) 0.85 1.95 0.53 1.09 1.77 2.08 3.47 6.22 0.70 2.31 0.98 2.58 1.30 1.86 0.75 9.33 0.54 1.86 K (mg l -1) 0.36 0.56 0.19 0.60 2.99 3.00 0.52 1.54 0.27 3.27 0.44 4.09 0.69 2.03 0.47 1.40 0.29 1.38 Ca (mg l -1) 5.76 22.92 1.92 3.70 4.36 12.75 21.1 1 38.63 2.82 19.38 3.93 10.33 6.69 12.27 5.42 90.40 2.51 18.49 Na (mg l -1) 5.69 7.37 5.15 7.26 5.64 6.10 13.33 18.89 3.92 8.09 4.80 7.68 8.33 9.21 5.19 59.16 2.54 5.83 Fluoride (F) (mg l -1) trace trace trace 0.22 trace trace 0.09 0.48 trace 0.37 trace 0.48 trace 0.47 trace 0.19 trace trace Chloride (Cl) (mg l -1) 8.29 13.39 11.66 20.85 9.83 12.64 19.77 28.73 7.91 14.64 6.79 15.73 20.17 24.04 11.73 131 1.61 9.71 Nitrate (NO 3 -) (mg l -1) 0.01 0.05 0.03 0.05 0.48 0.77 0.03 0.63 0.05 14.07 0.02 0.24 0.04 0.43 0.02 0.91 0.03 0.36 Sulphate (SO 4 2-) (mg l -1) 0.94 3.36 1.04 7.15 3.43 3.94 0.60 1.98 0.72 3.57 0.41 2.08 0.50 2.66 0.49 2.29 1.49 7.40
Table 3 contd.
(b)
ENDRICK MARSHES INSH MARSHES WOODOF CREE
Variable Min. Max. Min. Max. Min. Max.
Degree of shading 0 2 0 0 0 2
Water table relative to surface (cm) -21 0 -30 -11 -5 1
Maximum water table relative to surface (cm) -4 17 -9 40 1 14
Minimum water table relative to surface (cm) -31 -1 -37 -14 4 18
Overall level of water table fluctuation (cm) 5 32 5 46 10 40
Redox (mV) 65 349 95 596 72 192 pH 5.60 6.30 5.50 6.90 5.40 5.60 Conductivity (mmS/cm/s-1) 192 533 51 328 112 205 Bare ground (%) 2 27 2 15 3 13 Fe (mg l-1) 0.31 3.76 0.04 0.40 0.20 0.98 Mn (mg l-1) 0.32 3.40 0.05 1.53 0.56 1.04 Mg (mg l-1) 1.21 2.97 0.43 1.94 1.36 1.61 K (mg l-1) 0.39 2.30 0.71 5.91 0.34 2.56 Ca (mg l-1) 9.33 24.54 1.58 31.20 4.91 6.95 Na (mg l-1) 6.79 23.26 4.24 8.83 7.89 9.79
Fluoride (F) (mg l-1) trace 0.24 trace 0.30 0.33 0.39
Chloride (Cl) (mg l-1) 14.93 55.95 12.55 30.11 35.13 42.51
Nitrate (NO3-) (mg l-1) trace 9.43 trace 6.743 trace 0.21
Sulphate (SO42-) (mg l-1) 1.14 74.91 1.15 10.57 5.40 35.47
Phosphate (PO42-) (mg l-1) 0.01 0.01 trace 0.35 0.02 0.04
Table 4. Environmental variables employed in CCA for 1999 data,
showing those which significantly influenced the ordination (p<0.05: shown in bold type) following Monte-Carlo permutation. See methods section for explanation of codes
Variable Lambda P F Code A pH 0.39 0.005 2.05 Red 0.37 0.005 2.05 Sha 0.30 0.030 1.64 Max 0.26 0.045 1.49 logeK 0.27 0.040 1.50 logeSO42 0.21 0.200 1.24 logeFlu 0.23 0.100 1.34 logeMn 0.21 0.270 1.17 logeCl 0.18 0.400 1.07 logeMg 0.19 0.305 1.12 logeNO3- 0.18 0.460 1.02 Bare 0.15 0.590 0.89 logeF 0.14 0.675 0.80 logeCon 0.13 0.820 0.79 logeCa 0.15 0.720 0.84 logeFe 0.12 0.835 0.68
4). These primary environmental gradients also allowed a differentiation between defined National Vegetation Classification (NVC) community types (Fig. 2). Generally, M2 Sphagnum cuspidatum/recurvum bog pool community samples were associated with relatively acidic soil
-1.0 +1.0 -1.0 +1.0 pH Shade lnFluctuation lnK Red ox Max
Fig. 2. CCA ordination of site and species data constrained upon
environmental variables, 1999. Groups (G) and NVC classifications are shown (see Table 2 for group details): o= G1 (S27a); O = G2 (M23b); × = G3 (M9b); l = G4 (S27a); = G5 (S9b); = G6 (M2). Cumulative variance of species-environment relation = 25.2% for axis 1; 47.2% for axis 2; 80.1% for all four axes combined. All variables shown are significant (p < 0.05) under Monte-Carlo permutation.
conditions, and low levels of water table fluctuation. Examples representative of the M23b Juncus effusus/
Indicators of nitrate in wetland surface and soil-waters: interactions of vegetation and environmental factors characterised in most cases by higher levels of water table
fluctuation and less reducing soils.
Whilst nitrate concentration within the systems studied did not influence vegetation community structure significantly (Table 4), it was useful in the prediction of structural and reproductive components of the wetland vegetation. Conversely, aspects of the vegetation structure were found to be useful predictors of nitrate concentrations within the surface and soil water component of the systems: nitrate concentration within the mixed water samples was successfully predicted from three basic features of the vegetation sampled (Eqn. 1: see Methods section for explanation of codes). An increase in nitrate concentration is characterised by a linear increase in species richness (S per m2) and, similarly, by a linear increase in the density of
reproductive structures per m2. There is a slightly more
complex relationship with nearest-neighbour distance, with a decrease in values (i.e. less spaces between neighbouring stems), followed by a subsequent increase in values (i.e. an increase in the spacing of stems), characterising increasing nitrate concentrations.
lnNO3 = 0.308 + 0.041S 0.780NENE + 0.045NENE3
+ 0.245lnREPR (1)
(F = 4.077; d.f. = 4; R2 = 0.31; p = 0.008; n = 43) A regression model for stem density (Eqn. 2) utilised average and minimum water level, overall degree of water level fluctuation, pH and nitrate concentration as predictor variables. The nitrate concentration of the water (lnNO3)
has a cubic function within the equation. This suggests that in relation to an increasing stem density, nitrate concentration characteristically increases, then decreases, and finally increases again within the confines of the model. Mean water level relative to the wetland soil surface has a quadratic response expressed relative to increasing stem density, with an initial decrease followed by an increase (i.e. greatest stem density in wetter sites). Minimum water level (i.e. depth of water table below ground surface) takes the same form within the equation, with an increase in stem density characterised initially by wetter soils, but with the highest stem densities characterised by drier soils (i.e. greatest depths of water table below ground surface). The degree of water table fluctuation characterises increasing stem density by an initial increase; however, the sites with the greatest levels of fluctuation had lower stem density. The relationship between pH and stem density is linear, with an increased stem density as water samples became less acidic and approached circumneutral conditions.
lnSTDE = 4.054 0.046WAT 0.037MIN + 0.997lnFLU + 0.363PH 0.001WAT2 +
0.001MIN2 0.241lnFLU2 + 0.639lnNO 3
0.405lnNO3 2 + 0.080lnNO3 3 (2)
(F = 6.14; d.f. = 10; R2 = 0.67; p = <0.001n = 43) A third model (and the second involving nitrate as a predictor variable: Eqn. 3) illustrates a simplified but weaker relationship, with an increasing density of reproductive structures within the wetland vegetation being characterised by a linear increase in both the pH of the wetland hydrosoil, and in the nitrate concentration of the water samples.
lnREPR = 3.094 + 0.392PH + 0.260lnNO3 (3)
(F = 3.280; d.f. = 2; R2 = 0.15; p = 0.049; n = 43) Due to the relatively low predictive capacity of the models predicting nitrate concentration (Eqn. 1) and density of reproductive structures (Eqn. 3), they were not validated using independent test data. However, they are included because they suggest a strong potential for further development at targeted wetland vegetation types. The use of test data from 2000 to test the model predicting stem density (Eqn. 2) showed that predicted values were relatively noisy (Fig. 3). However, 11 of the 20 predicted values were within approximately one unit (on a logarithmic scale) of their corresponding observed values. The scores were positively correlated, but only marginally significant (r = 0.41; 0.05 < p < 0.1).
Discussion
Several of the sites studied (Kennedy, 2001) are likely to have varying nutrient inputs from agriculture and other land use practices, such as forestry, from adjacent areas within the their catchments (e.g. Endrick Marshes, Nether Whitlaw Moss, Glen Moss and Tarn Moss). Others (e.g. Lochwinnch and Wood of Cree) might be inundated periodically by enriched or acidified waters from within the wider catchment or, alternatively, are located in areas with potentially minor anthropogenic impacts (e.g. Insh Marsh). However, at just over 1 mg Nl1, mean nitrate concentrations were not
excessively high within the ranges observed for wetlands in the U.K. context (for example, concentrations of between 2.0 and 4.0 mg N l1 were observed within the Boxford
Marsh riparian wetland on the River Lambourn in southern England: Prior and Johnes, 2002).
Within the range of wetlands sampled, relative nitrate concentration does not appear to be a factor with a highly
significant role to play in differentiating vegetation community composition (e.g. Kennedy, 2001). However, nitrate may well have predictable relationships with structural aspects of the vegetation. Similarly, Wheeler and Proctor (2000) reported significant differences in biomass values relative to trophic status within samples which were otherwise classified as identical community types within the NVC (e.g. S27 Carex rostrata-Potentilla palustris Tall-herb fen: Rodwell, 1995).
The results suggest that even within the relatively short growing periods characteristic of northern European wetlands, nitrate has the potential to act as a predictor of species richness, the abundance of reproductive structures within wetland vegetation, and of nearest-neighbour distance (as a measure of how crowded the vegetation is within the basal parts of the vegetation canopy). In addition, characterisation of stem density was aided by reference to a range of environmental variables, including nitrate concentrations within the wetland soil and surface waters sampled, as was the density of reproductive structures within the vegetation. An apparent contradiction in the findings may also be explained: both wetter and drier sites are characterised by high stem density, while sites with intermediate levels of inundation aided the prediction of lower values for stem density (e.g. Kennedy and Murphy, 2003). This could be explained by the observation that wetter sites represent relatively dense Carex rostrata beds, for example, whilst the driest sites may be characterised by wetland grass communities, which are also more likely to have high stem density values (e.g. Kennedy et al., 2003). An increase in stem density appears to be linked to initially increasing, then decreasing, levels of water table fluctuation. This might be explained by the same mechanism of changing
vegetation type but, additionally, mineralisation might be increased within surface soils where they experience interspersed periods of wetting-up and drying out (Patrick and Malhapatra, 1968; Davidsson and Leonardson, 1998), increasing the availability of nitrate for plant uptake. However, where fluctuations become more extreme, or soils generally wetter, denitrification may lead to a net loss of nitrogen from the soil sink, limiting stem density (Patrick and Malhapatra, 1968).
Soil-water nitrate concentration has also been predicted by reference to vegetation bio-indicator variables, with an increase in species richness and associated reproductive structures predicting increasing nitrate concentration in the surface waters. Where diffuse or point source inputs into a freshwater system are minimal, then nitrate may well be a limiting factor to plant growth (Neal and Whitehead, 2002). In several of the stations sampled (Kennedy, 2001), bryophytes dominated in areas associated with low surface water nitrate concentrations (and therefore often had low vascular plant presence). The potential relationship outlined above between increasing levels of fluctuation, denitrification and subsequent nitrate loss, might also help to explain a decrease in nearest-neighbour distance (i.e. less well spaced stems), followed by an increase in stem spacing in relation to increasing nitrate concentrations (moving from drier through to wetter systems). It is evident from the nitrate model that the predictive relationships between nitrate concentration and the vegetation structural elements used as independent variables are difficult to separate. However, there is potential to develop this approach, and make predictions more robust, by targeting it at wetland types, such as riparian wetlands, where nitrate is likely to be less limiting within the surface water system (e.g. Prior and
6.0 6.5 7.0 7.5 8.0 8.5 9.0 9.5 10.0 10.5 11.0 e3 e1 e5 e2 e6 w4 w5 w3 w2 e4 w6 i1 w1 i3 i9 i7 i5 i4 i6 i8 Station (l o g e) St em de n si ty Observed Predicted
Fig. 3. Rank scores of observed stem density values (m-2) plotted against values predicted from model (Equation 1); R =0.41; e = Endrick Marshes; i = Insh Marshes; w = Wood of Cree.
Indicators of nitrate in wetland surface and soil-waters: interactions of vegetation and environmental factors Johnes, 2002) and might reach concentrations which begin
to threaten the ecological functioning of freshwater systems (Neal and Whitehead, 2002). The prediction of values might be improved by targeting certain wetland types (e.g. riparian wetlands or reed beds). Also, sampling specifically from soil waters (rather than using mixed soil and surface water samples) might benefit the predictive capacity of the models. The residence time of standing waters on wetlands such as Insh Marshes, which are large and hydrologically complex (Grieve et al., 1995), may be too short to allow uptake of nitrate by vegetation. A sensible development of this approach, therefore, may be to investigate potential differences in nitrate concentrations between soil and surface water components.
The need to incorporate wetland ecosystems into a unified framework which considers water quality, biological and hydrological processes for the prediction of the flow of nitrate (and other target parameters) through catchments is well recognised (Neal and Whitehead, 2002). However, the specific role which wetlands play as nutrient sequestration zones in riparian locations is still not clear (Prior and Johnes, 2002). Given that climate change may also play a role in the relative ability of wetland systems to undertake processes such as mineralisation and denitrification (Davidsson and Leonardson, 1998), this is an area in need of further research. Indeed, all these issues are important in relation to managing wetlands, which are an important component of aquatic ecosystems, not only in the UK, but globally.
Conclusions
The use of relatively simple traits in predicting aspects of eco-hydrological functioning within wetlands goes some way to answering the call for generally applicable tools in ecological assessment (e.g. Keddy, 1992a, b; Wheeler and Shaw, 1995) and can be highly complementary to purely taxonomic approaches in this respect (Duckworth et al., 2000). In addition, this study indicates a potential ability to predict nitrate concentrations within wetland systems from observations of the representative vegetation. In the context of biomonitoring and wetland management, such observations might give early indications of the occurrence of nitrate enrichment; this would be especially useful where water quality is not monitored routinely. Conversely, observed soil-water nitrate concentrations could be used as an indicator of the vegetation present. Such knowledge may have applications in the remediation of degraded wetlands. The equations presented here, therefore, have the potential for application to target wetland types (e.g. tall herb fens and other typical riparian wetland vegetation), as bio-indicators of wetland ecosystem functioning.
Acknowledgements
Stephanie Evers, Anna Griffin, Anne-Cecile Gross, Kevin Hall, Julia Van Leeuwen, Judith Milne, Joan Perry and Ruth Wingfield are thanked for fieldwork assistance, and RSPB, Scottish Natural Heritage, Scottish Wildlife Trust and English Nature for site access. Thanks also go to Aileen Adam (Glasgow), Chris Anderson, Stuart Bradley, George MacLeod and Helen Ewen (Stirling) for technical support, and to Dave Gilvear for access to analytical equipment at Stirling. M.P.K. was supported by a NERC postgraduate studentship (Ref. GT04/97/07/FS).
References
Ali, M.M., Murphy, K.J. and Abernethy, V.J., 1999. Macrophyte functional variables versus species assemblages as predictors of trophic status in flowing waters. Hydrobiologia, 415, 131 138.
Bragg, O.M., Hulme, P.D., Ingram, H.A.P., Johnston, J.P. and Wilson, A.I.A., 1994. A maximum-minimum recorder for shallow water tables, developed for ecohydrological studies on mires. J. Appl. Ecol., 31, 589592.
Brown, C.J. and Scott, P.J., 1997. Environmental parameters influencing the distribution of Platanthera blephariglottis and
Platanthera clavellata (Orchidaceae) in peatlands on the Avalon
Peninsula, Newfoundland. Can. J. Bot., 75, 974980. Damman, A.W.H. and Dowhan, J.J., 1980. Vegetation and habitat
conditions in Western Head Bog, a southern Nova Scotian plateau bog. Can. J. Bot., 59, 1343-1359.
Davidsson, T.E. and Leonardson, L., 1998. Seasonal dynamics and denitrification activity in two water meadows.
Hydrobiologia, 364, 189198.
Devillers, P., Devillers-Terschuren, J. and Ledant, J.P., 1991.
CORINE Biotopes manual: habitats of the European Community. Publication EUR 12587/3 EN: Commission of the
European Communities, Luxembourg.
Duckworth, J.C., Kent, M. and Ramsay, P.M., 2000. Plant functional types: an alternative to taxanomic plant community description in biogeography? Prog. Phys. Geog., 24, 515542. Etherington, J.R., 1983. Wetland ecology. Edward Arnold, London. Gerakis, A. and Kiriaki, K., 1998. Agricultural activities affecting the functions and values of Ramsar wetland sites in Greece.
Agri. Ecosyst. Environ., 70, 119128.
Gilvear, D.J., Sadler, P.J.K., Tellam, J.H. and Lloyd, J.W., 1997. Surface water processes and groundwater flow within a hydrologically complex floodplain wetland, Norfolk Broads, U.K. Hydrol. Earth Syst. Sci., 1, 115135.
Gorham, E., 1953. Chemical studies on the soils and vegetation of waterlogged habitats in the English Lake District. J. Ecol.,
41, 345360.
Grieve, I.C., Gilvear, D.G., Bryant, R.G., 1995. Hydrochemical and water source variations across a floodplain mire, Insh Marshes, Scotland. Hydrol. Process., 9, 99110.
Hill, M.O., 1979. TWINSPAN a fortran programme for arranging multivariate data in a ordered two way table by classification of the individuals and the attributes. Cornell University, department of Ecology and Systematics, Ithaca, New York, USA.
Hills, J.M., Murphy, K.J., Pulford, I.D. and Flowers, T.H., 1994. A method for classifying European riverine wetland ecosystems using functional vegetation groupings. Funct. Ecol., 8, 242 252.
Ingram, H.A.P., 1967. Problems of hydrology and plant distribution in mires. J. Ecol., 55, 711724.
Keddy, P.A., 1992a. Assembly and response rules: two goals for predictive community ecology. J. Veg. Sci., 3, 157164. Keddy, P.A., 1992b. A pragmatic approach to functional ecology.
Funct. Ecol., 6, 621626.
Kennedy, M.P., 2001. Predicting the impact of hydrological change on wetland vegetation. PhD thesis, University of Glasgow, U.K. Kennedy, M.P. and Murphy, K.J., 2003. Hydrological and hydrochemical conditions characterising Carex chordorrhiza L. fil (String Sedge) habitat in a Scottish riverine floodplain wetland. Aquat. Bot., 77, 243-255.
Kennedy M.P., Milne J.M. and Murphy K.J., 2003. Growth responses to groundwater level variation and competition in freshwater wetland plant species. Wetl. Ecol. Manage., 11, 383 396.
Lemly, A.D., 1994. Agriculture and wildlife: ecological implications of subsurface irrigation drainage. J. Arid Environ,
28, 8594.
Malmer, N., 1986. Vegetational gradients in relation to environmental conditions in the northwestern European mires.
Can. J. Bot., 64, 375383.
Mountford, J.O. and Chapman, J.M., 1993. Water regime requirements of British wetland vegetation: using moisture classifications of Ellenberg and Londo. J. Environ. Manage.,
38, 275288.
Murphy, K.J., 2002. Plant communities and plant diversity in softwater lakes of northern Europe. Aquat. Bot., 73, 287-324. Murphy, K. J., Castella, E., Clement, B., Hills, J. M., Obrdlik, P., Pulford, I. D., Schneider, E. and Speight, M. C. D., 1994. Biotic indicators of riverine wetland ecosystem functioning. In: Global
Wetlands: Old World and New, W. J. Mitsch (Ed.), Elsevier,
Amsterdam, The Netherlands. 659-682.
Murphy, K.J., Kennedy, M.P., McCarthy, V., OHare, M.T., Irvine, K. and Adams, C., 2002. A review of ecology based classification
systems for standing freshwaters. SNIFFER Project No.
W(99)65 / Environment Agency R&D Technical Report: E1-091/TR.
Neal, C. and Whitehead, P.G., 2002. Water quality functioning of lowland permeable catchments: inferences from an intensive study of the River Kennt and upper River Thames: an introduction. Sci. Total Environ., 282-283, 37.
Patrick, W.H. and Mahapatra, I.C., 1968. Transformation and availability to rice of nitrogen and phosphorus in waterlogged soils. Adv. Agron., 20, 323359.
Prior, H. and Johnes, P.J., 2002. Regulation of surface water quality in a cretaceous chalk catchment, UK: an assessment of the relative importance of instream and wetland processes. Sci. Total
Environ., 282-283, 159174.
RAMSAR Convention Bureau, 1990. Directory of wetlands of
international importance: sites designated for the list of wetlands of international importance. IUCN, Gland, Switzerland, and
Cambridge, UK.
Rodwell, J.S., 1991 et seq. British plant communities, Vol. 1-5. Cambridge University Press, UK.
Rodwell, J.S., 1995. British plant communities, Vol. 4: Aquatic communities, swamps and tall-herb fens: Cambridge University Press, UK.
Sheil, J. and Wells, T.C.E., 1983. The Fenlands of Huntingdonshire, England: a case study in catastrophic change. In: Ecosystems of the world, 4B. Mires: swamp, Bog, fen and
moor; regional studies, A.J.P. Gore (Ed.), Elsevier, Amsterdam,
The Netherlands. 375394.
Sjors, H., 1950. On the relation between vegetation and electrolytes in north Swedish mire waters. Oikos, 2, 241258.
Stace, C., 1997. New flora of the British Isles. Cambridge University Press, UK.
ter Braak, C.J.F. and Smilauer, P., 1998. CANOCO reference manual and users guide to Canoco for windows: software for canonical community ordination (version 4). Microcomputer Power (Ithaca, NY, USA).
Vretare, V., Weisner, S.E.B., Strand, J.A. and Graneli, W., 2001. Phenotypic plasticity in Phragmites australis as a functional response to water depth. Aquat. Bot., 69, 127145.
Wade, A.J., Whitehead, P.G. and OShea, L.C.M., 2002. The prediction and management of aquatic nitrogen pollution across Europe: an introduction to the Integrated Nitrogen in European Catchments project (INCA). Hydrol. Earth Syst. Sci., 6, 299 313.
Washitani, I., Takenaka, A., Kuramoto, N. and Inoue, K., 1997.
Aster kantoensis Kitam., an endangered floodplain endemic
plant in Japan: its ability to form persistent soil seed banks.
Biol. Conserv., 82, 6772.
Wheeler, B.D. and Proctor, M.C.F., 2000. Ecological gradients, sub-divisions and terminology of north-west European mires.
J. Ecol., 88, 187203.
Wheeler, B.D. and Shaw, S.C., 1995. Plants as hydrologists? an assessment of the value of plants as indicators of water conditions in fens. In: Hydrology and hydrochemistry of British
wetlands, J. Hughes and L. Heathwaite (Eds.), Wiley, Chichester,
UK. 6382.
Whitehead, P.G., Johnes. P.J. and Butterfield, D., 2002. Steady state and dynamic modelling of nitrogen in the River Kennet: impacts of land use change since the 1930s. Sci. Total Environ.,
282-283, 417434.
Willby, N.J., Abernethy, V.J. and Demars, B.O.L., 2000. Attribute-based classification of European hydrophytes and its relationship to habitat utilisation. Freshwater Biol., 43, 4374.