Water Production in Comets C/2011 l4 (PanSTARRS) and C/2012 f6 (Lemmon) from observations with SOHO/SWAN
Texte intégral
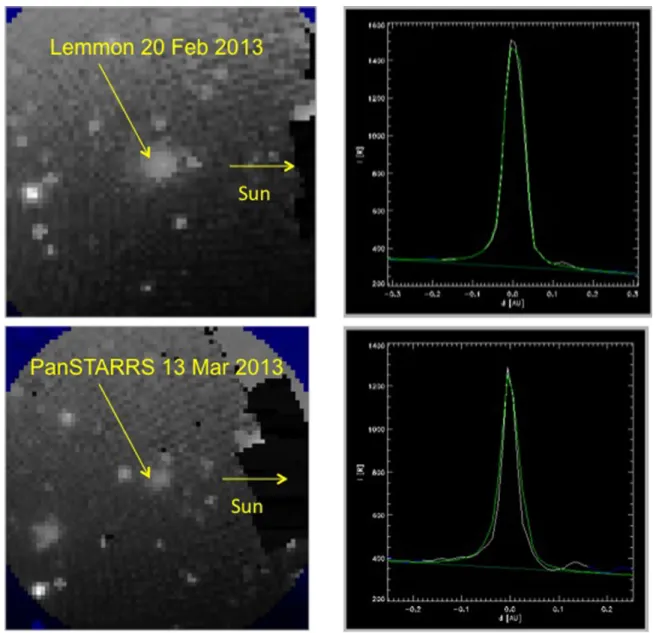
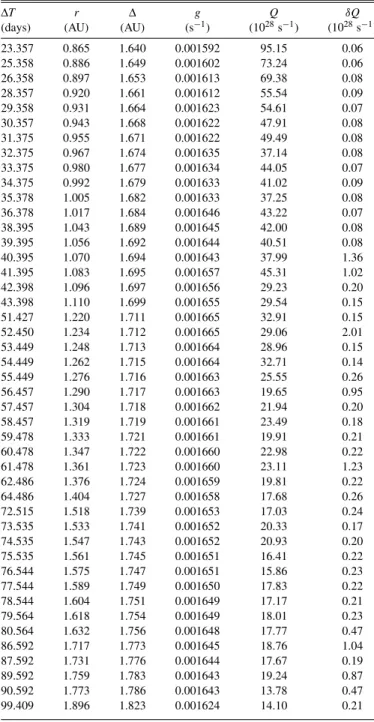
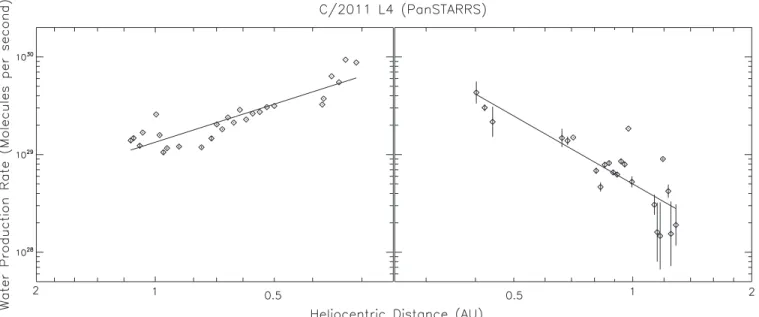
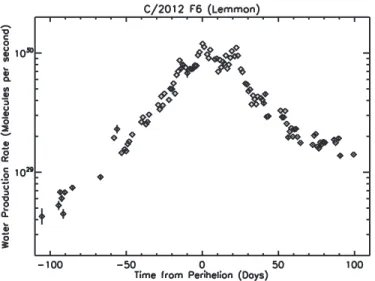
Figure
Documents relatifs
C/2011 L4 (PANSTARRS) est donc une comète non périodique ou à période longue, la quatrième découverte dans la 11 e quinzaine de 2011 (L est la 11 e lettre de l’alphabet
Dans ce contexte les objectifs de ce travail sont donc (i) de caractériser la va- riabilité spatio-temporelle des flux et des variables environnementales qui pourraient les
A multidisciplinary study of a syntectonic pluton close to a major lithospheric-scale fault: relationships between the Montmarault granitic massif and the Sillon Houiller Fault in
Cette cyclicité concorde avec les rythmes enregistrés par l’ACL, confirmant ainsi des changements rythmiques de végétation.Leδ 13 C des n-alcanes mesuré sur
Water production rate in comet C/2019 Y4 (ATLAS) as a function of time from perihelion and UT date 2020. The points give the water production rate in s -1 from
However, this profile can be used to obtain more appropriate g-factors to analyse the optical spectra taken in a similar aperture: given the heliocentric velocity of the comet and
PROFILE AND IWV INTERCOMPARISON The DEMEVAP 2011 experiment involved the IGN- LATMOS scanning Raman lidar [1], the OHP Raman lidar [2], four radiosonde systems, five
