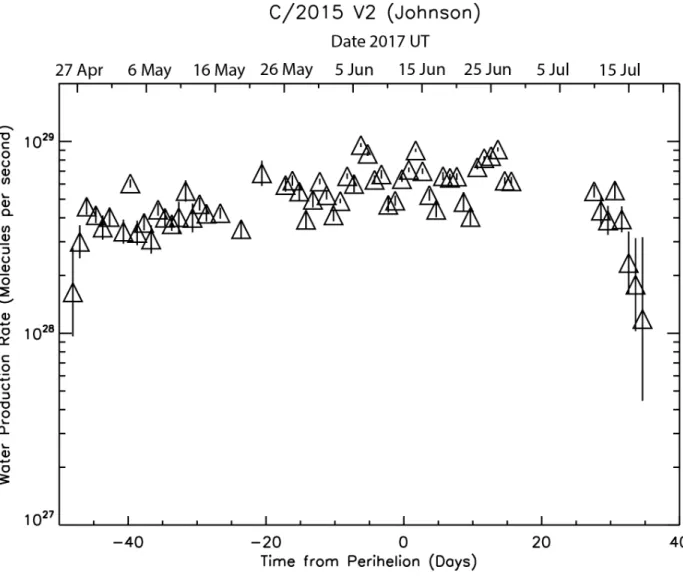
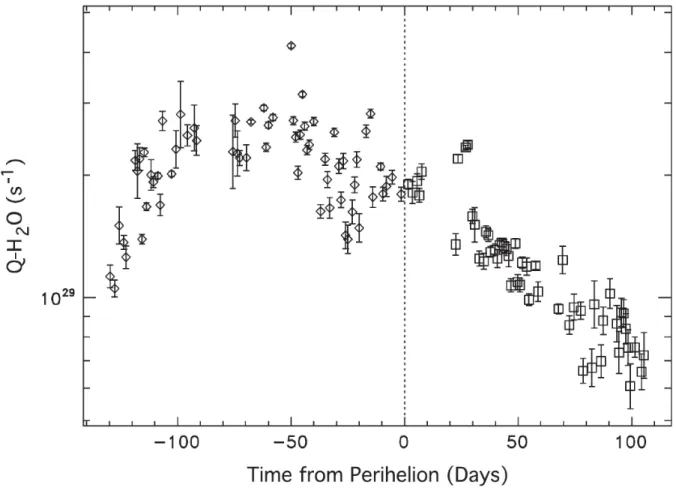
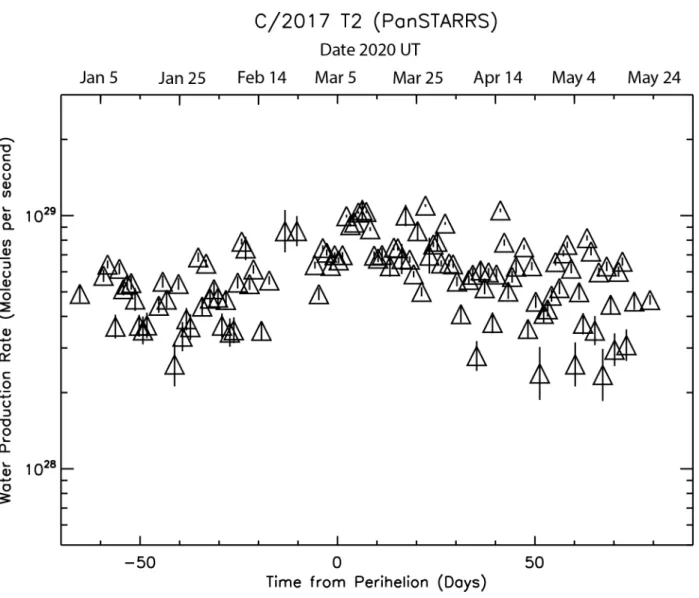
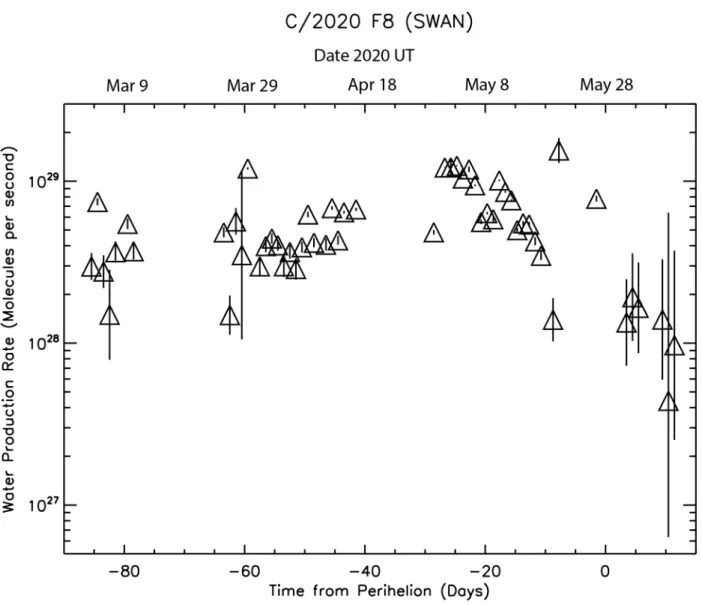
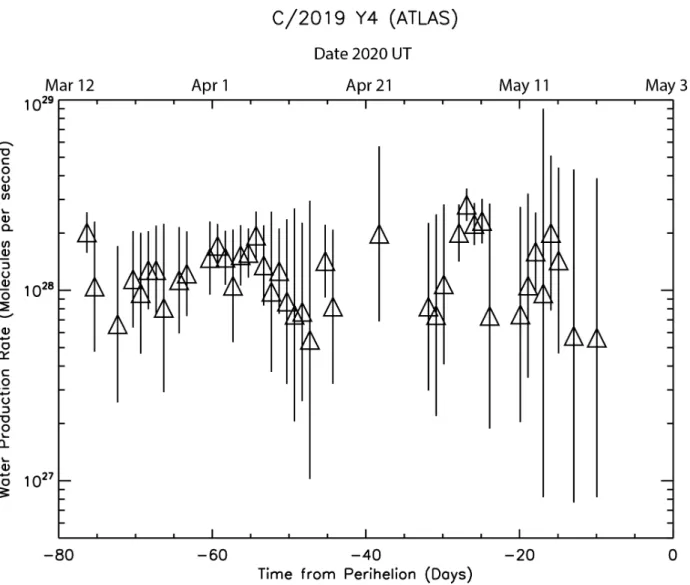
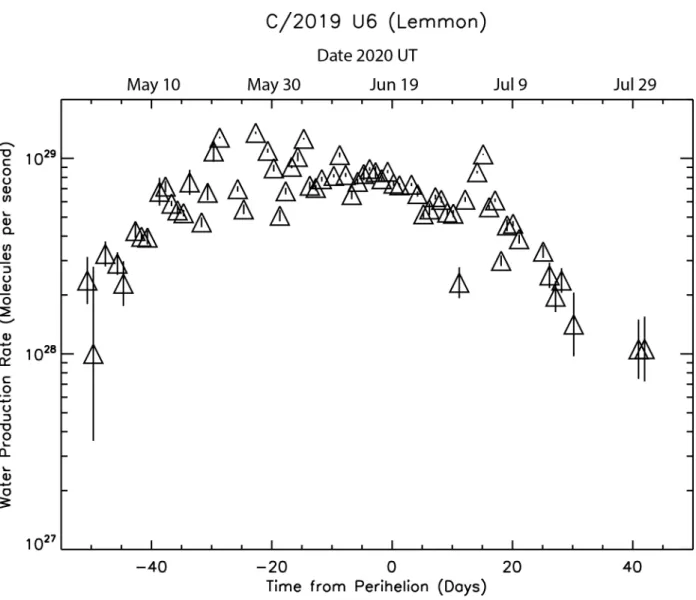
Water production rates from SOHO/SWAN observations of six comets: 2017–2020
Texte intégral
Figure

Documents relatifs
Dans un premier temps, sera exposé la méthode suivie pour synthétiser un film métallique avant d’évaluer l’influence de la concentration en zinc dans la solution électrolytique
Mg/Co, Mg/Zr/Co, Mg/Co/Zr and Mg/Zr/Co/Zr multilayers are designed, then characterized in terms of structural quality and optical performances through X-ray and EUV reflectometry
Term Frequency/Inverse Document Frequency (TF/IDF) at index time assigns weights
FOREIGN KEY (segment_2) REFERENCES GenSeg, FOREIGN KEY (units) REFERENCES UnitsDict (_code), FOREIGN KEY (owner) REFERENCES Contact. CREATE TABLE GenSegallLoc OF TYPE
Stable isotopes of the water molecule clearly evidence the local present day recharge especially within the surfi- cial aquifer, whereas some samples are affected by in situ
efficacement les fluides aqueux, d'autres les fluides silicatés ou encore les taux de fusion et les volatils permettent de contraindre des conditions de genèse des magmas. Le
Dans ce contexte les objectifs de ce travail sont donc (i) de caractériser la va- riabilité spatio-temporelle des flux et des variables environnementales qui pourraient les
