Dueling Markets: Capitalizing on the Non-Institutional and Institutional Asset Arbitrage
by
Bernardo A. Sacchini Bruzual B.S., Civil Engineering, 2008 Andres Bello Catholic University
and Zachary C. Shipps B.S., Biology, 2007
AWNWf
MASSACHUSETTS INSTITI TE -OF TECHNOLOLGY MAY2 12015
LIBRAR
IES
Samford UniversitySubmitted to the Program in Real Estate Development in Conjunction with the Center for Real Estate in Partial Fulfillment of the Requirements for the Degree of Master of Science in Real Estate
Development at the
Massachusetts Institute of Technology February, 2015
@2015 Bernardo A. Sacchini Bruzual and Zachary C. Shipps All rights reserved
The author hereby grants to MIT permission to reproduce a o distribute publicly paper and electronic
copies of this thesis document in who lD-i t ar ur now known or hereafter created.
nature
of
Authoracted
Center forat1-Estde January 9,_ZD-0
SigatreofAuthor gnaorreeaf Auaho
Signature
redacted
Certified by-Certified by Accepted by C 4n /?a tate I zY~an4I9, 2 0 /
Signature redacted
-""John [KennedLecturer, Cent! for Real Estate Thacde Snnervisflr
Sig nature redacted__
'1avid Af. Ge tnfr
Professor of Real Estate Finance, Department of Urban Studies & Planning and Center for Real Estate
Thesis Supervisor
Signature redacted
6i-rAlbert Saiz
Daniel Rose Associate Professor of Urban Economics and Real Estate, Department of Urban Studies and Center for Real Estate
Qi Si
Dueling Markets: Capitalizing on the Non-Institutional and Institutional Asset Arbitrage by Bernardo A. Sacchini B. and Zachary C. Shipps
Submitted to the Program in Real Estate Development in Conjunction with the Center for Real Estate on January 9, 2015 in Partial Fulfillment of the Requirements for the Degree of
Master of Science in Real Estate Development
Abstract
The rising supply of both domestic and international capital pursuing yield in major U.S. real estate markets is staggering and has resulted in substantial unmet demand for quality, institutional assets. This thesis examines the pricing and yield arbitrage between
institutional and sub-institutional grade assets, as defined by valuation parameters, alongside the feasibility of an investment model to capitalize on the aggregation of sub-institutional assets into portfolios attractive to sub-institutional investment.
The U.S. market was analyzed both quantitatively and qualitatively to determine the
viability of the perceived arbitrage, the components comprising both institutional and non-institutional markets, and where these have been successfully capitalized on with an aggregation investment model. In order to assess the viability and best practices of an aggregation strategy, interviews were conducted with firms invested in or executing this model. A repeat sales index was also created using data provided by Real Capital Analytics which comprised over 68,000 transactions of assets valued above $2.5 million which
transacted between 2000 and 2014 across the United States.
The interviews, regressions, and corresponding data analysis revealed distinguishable trends underlying institutional and sub-institutional assets within specific markets. These trends suggest that there is inefficiency in the real estate market regarding the pricing of certain sub-institutional assets in older, land-constrained cities making them target
locations for an urban aggregation model. The largest disparities between sub-institutional and institutional investments were found in the yield and growth rates of specific assets based on underlying market criteria. By aggregating these two metrics for total return averages for non-institutional and institutional assets, and by analyzing the risk
performance of each, we conclude the existence of a different pricing of risk, which generates the potential for arbitrage. Specifically, non-institutional properties exhibited better risk-adjusted returns relative to their larger counterparts for land constrained, older regions and cities, confirming our hypothesis.
Thesis Supervisors: John F. Kennedy and David M. Geltner Titles: Lecturer and Professor of Real Estate Finance
Acknowledgements
Immense credit and gratitude for the support of this research is owed to our advisors, Dr. David Geltner and Mr. John Kennedy. Their friendship, encouragement, insight, and consistent motivation throughout our experience at MIT and this thesis were invaluable. This research would have been incomplete without the interviewees who were generous in our direction with their time, experience, and understanding. They shall remain
confidential but their insight is interlaced throughout this document.
We are indebted to Real Capital Analytics and their support of research at the MIT Center for Real Estate. In addition, Dr. Sheharyar Bokhari provided critical guidance in
constructing the repeat sales index and adding valuable insight to the results.
I am especially grateful for the valuable input, collaboration and opportunity to work
alongside my good friend and co-author, Bernardo Sacchini in crafting this thesis. I am excited to see the impact he has on the people and places he works throughout his career. Most importantly, I am grateful for the support and love of my incredible wife, Sara. Her consistent and steadfast encouragement throughout the rigor of the past year has enabled us to experience an incredible education, build lasting friendships, and realize unforeseen opportunities.
Zach
There are few words that can explain the 18 months that I spent at MIT. The things I learned, the people I met, the friends I made, it exceeded each and every one of my expectations. This thesis is written as humble contribution to the incredible community that MIT represents.
Also I would like to give special credit to our thesis advisors, Dr. David Geltner and Mr. John Kennedy, whose incredibly wise insights, guidance and enthusiasm made it a great, fun and didactical journey. I will like to extend credits too to Dr. Sheharyar Bokhari, whose help in the deep quantitative, analytical part was much needed. I would also like to thank Real Capital Analytics for their support and generosity, without their data this paper would have not been possible.
Special gratitude is owed to Zach Shipps, co-author of this paper, whose views and knowledge complemented my own perspectives, and with whom is very easy to work. It was a great time.
Finally, special gratitude goes out to my family whose support and encouragement to keep studying brought me to this place. I am forever grateful.
Table of Contents Abstract 3 Acknowledgements 5 Table of Contents 7 Table of Figures 9 CHAPTER 1. Introduction 11
CHAPTER 2. The Investment Market 14
Real Estate Investment Styles 14
Institutional Assets Defined __15
CHAPTER 3. Market Analysis 19
Supply 19
Demand 20
CHAPTER 4. Manufacturing Institutional Assets 24
Aggregation Model 25
Physical Constraints 27
Regulatory Constraints 27
Aggregation Challenges and Risks 27
Entry 29
Operations 30
Exit 31
Other Challenges and Risks 31
Aggregation Benefits 32
CHAPTER 5. Operational Components 34
Property Management 34
Construction and Renovations 35
Role of Technology 36
General Expenses 36
CHAPTER 6. Data Analysis 39
Data Parameters 39
Data Sources and Other Basic Information 40
Data Sorting and Filtering 42
CHAPTER 7. The Framework for Analysis 48
The Law of One Price and the Sharpe Ratio 49
CHAPTER 8. Methodology_53
Growth Methodology. The Repeat Sales Regression Index 53
Cap Rate Methodology
54
CHAPTER 9. Research Findings_56
Cap Rate Findings 56
Growth (Capital Gains) Findings 59
Total Return Findings 62
Risk (Volatility) Findings 64
Bringing It All Together. Risk-Adjusted Arbitrage 66
CHAPTER 10. Conclusions 69
Bibliography 71
Exhibit A. Apartment arbitrage results for $5 million cutoff_74 Exhibit B. Summary table of ranks for apartment product type_80
Exhibit C. Result summary tables for all property types 81
Table of Figures
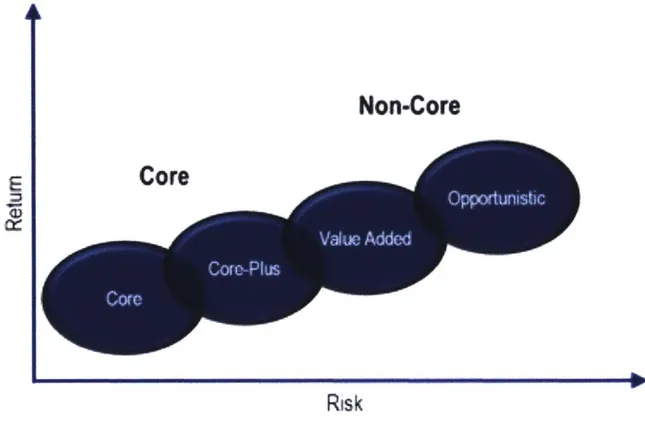
Figure 2-1. Real estate segments risk and return 15
Figure 3-1. Map of top U.S. markets for foreign real estate investment (2012-2014) __ 22
Figure 6-1. RCA regions and metros map. 47
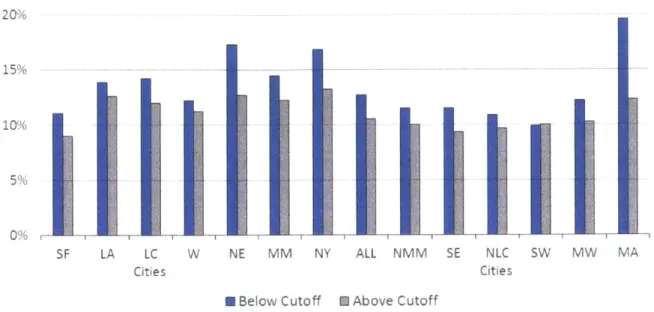
57 Figure 9-1. Apartment cap rate series. Major metros. Cutoff at $10 million
Figure 9-2. Apartment cap rate series. Non-land constrained cities. Cutoff at $10 million. 57 Figure 9-3. Apartment cap rate bar chart for properties above and below a $10 million
cutoff
Figure 9-4. Apartment cap rate spread bar chart between properties above and below I
million cutoff
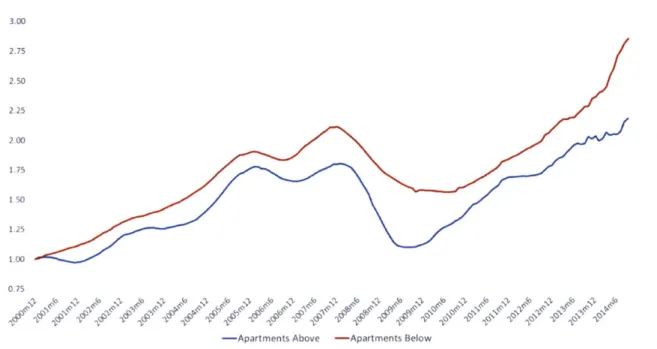
Figure 9-5. Apartment repeat sales index. Land constrained cities. Cutoff at $10 million. 58 $10
58 60
Figure 9-6. Apartment repeat sales index. Non-major metros. Cutoff at $10 million 60
Figure 9-7. Apartment growth rate spread bar chart for properties above and below $10
million cutoff
Figure 9-8. Apartment growth rate spread difference bar chart between properties above 61
and below $10 million cutoff
Figure 9-9. Apartment total return (not adjusted by risk) spread bar chart for properties
above and below $10 million cutoff_ 63
Figure 9-10. Apartment total return (not adjusted by risk) spread difference bar chart for
properties above and below $10 million cutoff 63
Figure 9-11. Apartment standard deviation spread on repeat sales index bar chart for
properties above and below $10 million cutoff
61
Figure 9-12. Apartment standard deviation spread difference on repeat sales index bar
chart for properties above and below $10 million cutoff 65
Figure 9-13. Apartment Sharpe Ratio bar chart for properties above and below 10 million
cutoff 67
Figure 9-14. Apartment relative Sharpe Ratio difference (arbitrage potential) bar chart for
CHAPTER 1. Introduction
This thesis explores the pricing and yield arbitrage between institutional and
sub-institutional grade assets alongside the feasibility of an investment model to capitalize on the aggregation of non-institutional assets into portfolios attractive to institutional
investment. The foundation of this research is both quantitative, using data provided by Real Capital Analytics ("RCA"), and qualitative through interviews with industry
professionals.
A repeat sales index was created using Real Capital Analytics data for United States assets
valued at $2.5 million and above which transacted since the year 2000. The regressions and corresponding data points revealed distinguishable trends underlying institutional and institutional assets. For the purpose of this thesis, we defined institutional and non-institutional asset categories strictly by valuation. Institutional assets were determined to have a valuation greater than $10 million while non or "sub"-institutional assets are
between $2.5 and $10 million in total value. These findings were additionally vetted against research, and professional interviews to arrive at the synopsis.
Ten individual and confidential interviews were conducted over the course of this thesis with active industry professionals representing the top institutional and general partner firms in their field. The questions were consistent and focused on either institutional or general partner positions accordingly. Interviewees and their firms are held in the strictest of confidentiality to ensure quality and unbiased responses. Therefore, citations will be denoted as either "Institutional Firm #1,2,3..." or "General Partner # 1,2,3..."
correspondingly.
This paper further examines the longstanding aggregation investment model as a means to manufacture real estate portfolios of an institutional level in markets meeting certain criteria. Raw land for development, farmland, hotels, and industrial sites have long been the main targets of investors for the purpose of aggregating into portfolios of a critical mass. More recently, student housing and mini-storage have been the components of successful aggregation plays. These portfolios are commonly aggregated using an initial value-add approach given the additional risk resulting from meaningful physical
renovation, lease-up, or are ahead of projected growth. Once the business plan is
completed, and dependent on several factors including market, asset quality, and capital markets, these portfolios are commonly viewed as core-plus investments1.
Driven mainly by the desire for superior risk-adjusted yield and capital market tail winds, this model is being expanded to include assets in single-family residential rental, self-storage, single-tenant industrial buildings, and mobile home parks2.Advancements in
technology and operating efficiencies have helped make this expansion possible. While there are systematic commonalities that can be applied to all asset classes, which will be covered by this thesis and representative data, the multi-family sector will be the focus of our research.
As a real estate cycle matures and yields are compressed in major markets, investors are faced with difficult investment decisions in order to maintain desired returns. These often include development of core assets if possible, the pursuit of lower quality assets within the major market, venturing into secondary and tertiary markets, and increasing leverage to attain the required returns. Another, but rarely executed option due to operational burden and scaling risks, is to aggregate smaller assets into portfolios of a size that attract institutional capital. While there are specific risks inherent to an aggregation investment strategy, we provide evidence suggesting that this rarely used option of aggregating smaller assets should be strongly considered by institutions.
In order to accurately exhibit the research and data involved in deciphering the arbitrage opportunities around aggregating assets, this thesis is organized as follows3.CHAPTER 2
1 In the real estate investment industry, "value add" refers to investment strategies that contain
more risk and require more hands-on active involvement, and therefore provide higher returns (lower going-in price/income multiples), compared with "core" investment strategies which are typically stabilized prime properties. "Core-plus" is a category between "value add" and "core" as defined later in this paper.
2 The Superior risk-adjusted yield implies a greater return going-in (ex-ante) than is warranted by
the amount of risk in the investment. Conversely, merely obtaining higher yield by going out on the risk/return Security Market Line (i.e.: taking on more risk to get more return ex-ante), would not be viewed as "superior risk-adjusted yield" in this thesis.
3 In this thesis, we define arbitrage as obtaining higher risk-adjusted returns. This entails investing
and CHAPTER 3 explore the existing supply and demand within real estate markets for institutional assets through literature analysis. CHAPTER 4 is devoted to the arbitrage opportunity within aggregating sub-institutional properties and the potential to "manufacture" core assets through aggregation as opposed to new, ground-up development.4. Additionally, CHAPTER 5 examines the attributes and operational components of an aggregation investment model. Detailed data analysis comprises
CHAPTER 6, CHAPTER 7, CHAPTER 8 and CHAPTER 9 while CHAPTER 10 draws the conclusions and results of our research.
provide similar returns with lower risks. Arbitrage opportunities of this kind are different from value-add strategies that provide for higher (not risk adjusted) returns, because in reality unlike value add, arbitrage opportunities do not create any value, they are mere inefficiencies of the market, thus are not sustainable over time. First movers will be the ones that capitalize on the inefficiencies and will generate the super normal profits offered initially, but once competition arises, additional profits provided will be eroded, reducing the return to a level commensurate with the risk that it entails.
4While an arbitrage scenario can be realized in an aggregation model, there are also "value-add"
components to the investments such as: building renovations and improving operations. These methods incur real value added to the assets in addition to the arbitrage opportunity. Incorporating these components alongside an aggregation model could result in creating or "manufacturing" and institutional grade investment portfolio.
The Investment Market
The U.S. real estate investment market is massive in scale. This chapter seeks to explore generally accepted parameters for investments styles, define institutional and non-institutional assets, and consider the types of investment structures commonly implemented.
Real Estate Investment Styles
Real estate investment allocations are often divided into "styles" or strategies based on a risk and return measurement, characterized by a combination of type of assets and
investment business model. The least risky and thus lower returning assets purchases with a relatively passive business model and low leverage are generally considered "core" or "core plus" and are commonly characterized as institutional grade assets5. The following
categories include generally accepted descriptions of the investment categories.
* Core - Low risk: diversified across five major property types: office, retail,
industrial, multifamily, and hotel. Low to moderate leverage and located in major markets.
e Core Plus - Moderate risk: essentially core properties in terms of location and
type but contain riskier elements such as capital requirements, lease turnover, or slightly higher leverage.
* Value-Add - Elevated risk: higher leverage used to increase returns. Capital is
required to re-position the asset, perform extensive renovations, or conduct considerable leasing. Can be located in any market.
* Opportunistic - Higher risk: substantial leverage can be incurred to generate
increased returns. Includes development, substantial redevelopment projects and non-traditional property sectors, which often entail investment in real estate related operating companies.
5 Joseph L. Pagliari Jr., "The Pricing of Non-Core Real Estate Ventures,"Journal of Portfolio
Management 33 (September 2, 2007): 119-33.
4
S
z
LNon-Core
Risk
Figure 2-1. Real estate segments risk and returnSource: Advisorperspectives.com
Though perceived risk of an asset is a component to the opaque definition of an institutional asset, this thesis determines the definition strictly by a valuation range.
Institutional Assets Defined
By investment standards the real estate market is largely bifurcated into two categories:
Institutional and Non-Institutional. The line separating institutional from non-institutional assets is opaque with no clear, defined definition in existence. Key distinguishing factors include asset size, quality, location, financing source, and age6. Assets fitting the
institutional mold are often owned and traded by institutional investors such as, pension funds, investment banks, Real Estate Investment Trust, sovereign wealth funds,
endowments, private equity funds, and insurance companies, where as non-institutional assets are often owned by individuals or smaller companies7. As evidenced in the
6 Arthur Segel, I., "How Institutional Investors Think About Real Estate," August 12, 2010.
PriceWaterhouseCoopers Real Estate Investor Survey (formerly Korpacz) the institutional-grade label is not static, and institutional status can change with a property's physical condition or economics, market conditions and trends, or investor's preferences8.
Additionally, financial characteristics are good indicators of institutional grade assets as further assessed in the PwC Survey, "The financial characteristics of institutional grade property vary and depend on the investor's specific objective for the specific investment
-immediate cash flow, asset enhancement, or upside potential. In general, the property has low leasing risk, proven stable occupancy, a preponderance of financially strong tenants, and good long-term growth9". Institutions are willing to accept a lower yield on such "core" assets due to perceived security and liquidity, which in turn results in higher valuations than non-institutional properties.
The National Council of Real Estate Investment Fiduciaries ("NACREIF"), Real Capital Analytics ("RCA"), CoStar, and the National Association of Real Estate Investment Trusts
("NAREIT") represent the major sources of real estate data and were critical in defining the institutional asset threshold. Additional interviews with Institutional investment firms, endowments, and life insurance companies confirmed these findings.
Real Capital Analytics is a global research and consulting firm founded in 2000. RCA collects transactional information for current property sales and financings globally, then analyzes and interprets the data. The RCA website (www.rcanalytics.com), defines the "institutional investor" as an "investor, such as a bank, insurance company, retirement fund, hedge fund or mutual fund which is financially sophisticated and makes large investments, often held in very large portfolios of investments."
Typically, institutional investors or "limited" partners provide capital to operating or "general" partners as defined in a legal document termed the Joint Venture Agreement.
8 Jacques Gordon, Rich Kleinman, and William Maher, "Tracking Institutional Real Estate Capital
Markets--A 'Stock' versus a 'Flow' Approach," Real Estate Finance (Aspen Publishers Inc.) 29, no. 3
(October 2012): 6-11.
9 "PwC Real Estate Investor Survey Second Quarter 2014," PwC, Real Estate Investor Survey, 27, no. 2 (June 16, 2014).
Generally, the limited partner invests a majority of the equity in the investment alongside the operating partner who essentially acquires, manages, and oversees the disposition of the real estate assets. A sample of actual entities in the institutional investment and
operating partner tiers provided by Real Capital Analytics are listed below:
Examples of Institutional Investors (Real Capital Analytics)
AEW Capital Management Prudential Real Estate Investors
Apollo Blackstone
TA Associates Realty CalPERS
Invesco Citi Group
Norges Bank Harvard Management Co.
AIG Met Life
Examples of Operating Partners (Real Capital Analytics)
Laramar Co. CNL Financial Group
Lincoln Property Group Fairfield Residential Paradigm Property Group Extell Development Inland Real Estate Group Rhino Capital
Vantage Properties Triple Net Properties
Pinnacle Group Greystar
Examples of Non-Institutional/Private Investors (Real Capital Analytics)
Family Offices Non-traded REIT
High Net Worth Individuals Syndicated Investments
This thesis focuses on the potential to aggregate specific sub-institutional assets with valuations greater than $2.5 million but less than $10 million, in the value-added space. These assets are considered to be value-add as they typically require significant capital
investment, and are generally smaller in size10. The aggregation criteria for these
properties resemble that of institutional assets in location, quality, vintage but lack in size or value.
10 Arleen Jacobius, "U.S. Is Location, Location, Location for Foreign Buyers," Pensions & Investments
Considering all the aforementioned definitions regarding asset grade, this thesis and data components defined the institutional parameters strictly by asset valuation. While this assumption is a material generalization and will knowingly contain outlying data points, we deemed it the most efficient way to tranche and analyze the accompanying data while delivering the key metrics to our hypothesis. These metrics included a pricing, yield, and growth arbitrage between institutional and non-institutional assets across multiple geographic regions in the U.S.
CHAPTER 3. Market Analysis
With the investment market defined, the following chapter will focus on the supply and demand metrics around U.S. real estate markets.
Supply
According to research by accounting firm Price Waterhouse Coopers, the global stock of institutional-grade real estate is $29 trillion in 2012. This stock is expected to expand by more than 55%, to $45.3 trillion in 202011. Also, according to a 2010 paper by Costar researchers, the estimated cumulative value of the United States commercial real estate market at the end of the year 2009 was $11.5 trillion12. That is nearly $4 trillion lower than the peak estimated value in 2006, which in certain markets has been recovered and
surpassed at the time of this thesis. This economic growth and corresponding increase in prices has caused a birth of new construction in recent years to "manufacture core" assets through ground-up development. Major metros such as New York, Boston, Los Angeles, Washington D.C., Chicago, and San Francisco are some of the most sought after for domestic and foreign investment in institutional real estate. Given the prior mentioned constraints around the characteristics that make a property "institutional" grade, there is a limited supply of investment grade assets.
A recent paper by Real Estate Finance examines the size of the institutional real estate
market from a "capital flow" perspective rather than a measurement of existing or
developable stock13. Based on the capital amount of both debt and equity, the total value of
U.S. institutional real estate stock is estimated at $3.9 trillion as of year-end 201114. The
paper categorizes the institutional investment in real estate into four sections: privately held debt, publicly traded debt, public equity, and private equity. For the purpose of this thesis, we are focusing on both the public (i.e., REIT's, investment banks) and private (i.e.,
11 PwC. "Real Estate 2020: Building the Future," 2014. www.pwc.com/realestate.
12 "Real Estate Investing," Pensions & Investments 42, no. 10 (May 12, 2014): 24-29. 13 Jacobius, "U.S. Is Location, Location, Location for Foreign Buyers."
equity funds, sovereign wealth funds) equity components. As the market continued to improve since 2012, increasing amounts of institutional capital has flooded the market resulting in lower core market yield and a scarcity of institutional quality assets to meet the increasing demand further outlined in the next section.
Professor
J.
Shilling PhD, points out in his paper regarding Risk Premiums in real estatethat, "evidently, institutional investors prefer to invest in real estate only if the case is so obvious as to justify its undertaking. This must mean that institutional investors miss many worthwhile investment projects"". This leads us to believe that there are many investment opportunities that are just outside of the institutional realm. If these "sub-institutional" assets could be acquired and "institutionalized", a resulting increase in value could be realized. Additionally, this could allow for an expansion of "institutional" asset stock by expanding the actual supply boundary of the market, possibly ultimately generating downward pressure on current prices and increasing yields in the present institutional market.
This research seeks to expound on the viability of such opportunities through analyzing a repeat sales index and engaging the industry around ways to capitalize on such an
arbitrage. The existing arbitrage, or ability to capitalize on the aggregation of assets into institutional grade portfolios, can be further expanded by implementing a strategy to add value to the individual assets through operations, capital components, and other property variables.
Demand
The U.S. is known to serve as a sort of "safe harbor" for international capital due to a stable government, transparency and dependable legal system, low inflation, and enticing growth as compared to most other countries. A recent survey of foreign investors by the
Association of Foreign Investors in Real Estate noted the U.S "is perceived to provide a
stable environment in which to invest and is the best market for capital1 6." Demand for core or perceivably safe, institutional assets is on the rise domestically but most noticeably from an international influence with 42% of all buyers of U.S. real estate in the first half of
2014 being foreign17.This rush of overseas capital has pushed prices so high in the major
U.S. markets that many investors are seeking more attractive returns in non-major
markets. According to a survey by Jones Lang Lasalle, "71% of foreign investor respondents indicated interest in buying properties in the so-called secondary U.S. cities due to an increase in economic fundamentals"18. Based on our research and data, these institutions are making the wrong investment decision by pursuing yield in secondary markets. These non-major markets expose portfolios to greater risk through volatility, and while core markets may exhibit a lower yield, their volatility and corresponding risk is minimized. Comparatively, the aggregation model would theoretically increase desire for investments in markets in prime locations while providing, at least initially, the potential for higher returns with less volatility.
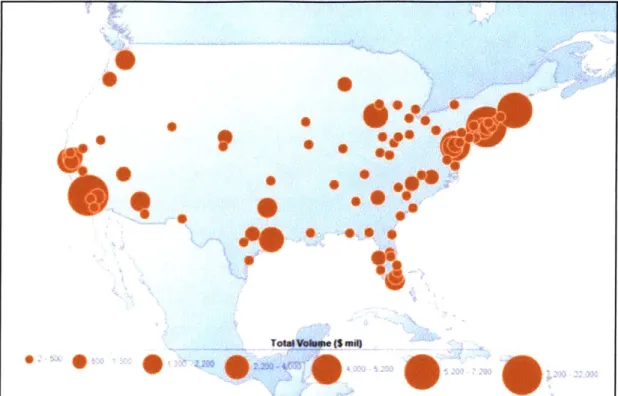
The Figure 3-1 below illustrates the major catchments of foreign real estate investment since 2012.
16 Ibid.
17 David Geltner and Henry Pollakowski, "A Set of Indexes for Trading Commercial Real Estate Based on the Real Capital Analytics Transaction Prices Database," MIT Center for Real Estate, 2007.
* @
f
AmpLQ
T#a6W($w4 001
p
Figure 3-1. Map of top U.S. markets for foreign real estate investment (2012-2014) Source: Real Capital Analytics.
Top Market Destinations
Volume in Millions ($USD)
Maniattan 11U $Z1,973.3 Los Angeles 69 $8,188.5 Boston 53 $6,302.0 DC 33 $4,125.6 Chicago 87 $3,989.4 Hawaii 13 $2,982.1 San Franciscc 42 $2,949.9 Houston 76 $2,352.9 Seattle 63 $2,106.2 Other 1,478 $33,547.1 Total- 2,04 $80,516.9
Table 3-1. Top U.S. markets for foreign real estate investment (2012-2014)
Source: Real Capital Analytics.
Origin of Capital
Volume in Millions ($USD)
canada U91 $25,Z63.2 China 83 $8,513.6 Norway 81 6339.7 Germany 87 $4,752.4 Switzerland 101 $4,669.6 Japan 56 $4,028.2 Singapore 18 $3,910.8 Israel 102 $3,693.8 Hong Kong 56 $3,244.2 Other 549 $24,101.3 Total 2,04 M516.%,
Table 3-2. Origin of U.S. invested capital (2012-2014)
In addition to international capital flowing into the United States, real estate has returned to favor for domestic capital and become a staple allocation for many investment portfolios. Typical real estate target allocations are approximately 8% -10% of a portfolio driven by
attributes such as inflation protection, diversification, and cash flow19 However, according to the efficient market theory and research, portfolios are generally underweighted in real estate. Some research suggest that optimal allocation should amount to be more than 10% of total wealth20. This would demand much more investable assets to cope with inflows of money responding to adjustments in allocations, which supports the idea of expanding the institutional market. While this allocation can manifest itself in many forms, a majority of institutions will chose the bulk of their real estate exposure to be in the form of core or "institutional" assets. A recent article by Pensions & Investments pointed out that most major institutional investors with a real estate allocation maintain 50% to 65% of that commitment in core assets. Additionally, given the strong performance of commercial real estate since the recession, many sponsors are increasing real estate allocations or entering the realm for the first time21. This additional capital is continuing to pour into real estate markets driving prices up in traditionally major markets and forcing investors to seek yield elsewhere. The substantial influx in demand has outstripped the supply of institutional investments to the extent that Jones Lang Lasalle again estimates that "there are $12 for every $1 dollar of property in the market"22.
These scenarios and data identify the existing demand for investors to own assets in the major U.S. markets but also highlight the lack of available product that meets institutional criteria. Considering these facts, investment opportunities that provide expansions of existing market boundaries in highly desired markets will prove to be good to be of interest to institutional capital by allowing for similar "certain" returns previously sequestered in only prime locations.
19 David M. Geltner et al., Commercial Real Estate Analysis and Investments, 3rd ed. 20 Jacobius, "U.S. Is Location, Location, Location for Foreign Buyers."
21 Confidential, Institutional Firm #1, November 3, 2014. 22 Confidential, General Partner #1, November 17, 2014.
CHAPTER 4. Manufacturing Institutional Assets
The supply and demand components of CHAPTER 3 delineate the potential for an investment model to capitalize on opportunities using an aggregation strategy. In this chapter we will further consider the components of the aggregation investment model, potential challenges, and the benefits to implementing this investment thesis.
The supply and demand components reveal a compelling story for means to create assets of institutional quality through development, re-development, or aggregation. This thesis examines the potential to aggregate, and thus transform, sub-institutional multi-family assets that meet certain criteria within specific types of markets into portfolios that would be attractive to institutional investors.
Ultimately, as with most investments, the capital markets play a critical role in the overall success or failure of an aggregation model. In a period of rising prices, the aggregation model, as well as most prudent investments at that point in the cycle will likely perform well due to the resulting premium on the exit. Conversely, a portfolio that is aggregated amidst a downward progression in pricing, will likely not realize any such premium, indeed, may be exposed to some loss in value with the down cycle. While the investments will be made and business plan determined by the capital source and corresponding holding period, the market ultimately controls the outcome.
Some of the most notable real estate investment trends in the past decade focus on the Single Family Residential market and the exponential influx of institutional capital to acquire portfolios of rental houses23. Major investment firms such as Colony, Blackstone,
and Oaktree Capital have committed billions in capital to acquiring, leasing, and operating portfolios of thousands of single-family homes. Several firms have actually taken their portfolios to the public market through recent IPO's while others have successfully securitized cash flows from the portfolios which sold as residential mortgage backed
securities (RMBS) since the recession. Despite the amount of work required to close on one
house, technological advances in software and data have played significant roles in the process of identifying markets, inspecting houses, acquiring individual homes, and
managing portfolios. The progress seen in the aggregation of the single-family sector can be transferred to other asset classes, and the benefits of such market expansions reaped, of course, not without challenges.
Aggregation Model
Historically, real estate has been a prime medium for aggregation when considering, REIT's, the CMBS market, comingled real estate funds (CREF's), and various syndications, but the aggregation of real estate assets has been fairly limited in scope when specifically employed to transform sub-institutional properties into institutional grade investments. Asset classes that have experienced a focused aggregation into institutional portfolios generally include land for development, farmland, hotels, and industrial properties due to the scalability of management or lack thereof2 4. Hotels maintained operations that were accretive in value if an efficient scale was achieved. Similarly, farmland and land likely
required minimal operational efforts depending on the purpose and structure. Industrial assets by nature typically required the least amount of management of the major asset types and were often more easily assembled due to location and ownership.
Advancements in the operations, technology, and data across the real estate industry and the aggregation model components, which are being refined in the single-family residential realm, provide methods to capitalize on the increasing demand for scarce, institutional assets. The aggregation model can be molded around a myriad of situations, markets, and opportunities. This investigation will highlight common factors affecting aggregation models but focus on multi-family assets in major markets.
Upon deciding to enter a market with the intention of aggregating sub-institutional, multi-family assets a firm will likely chose to "anchor" themselves by acquiring an existing
24 Confidential, Institutional Firm #1. November 3, 2014.
portfolio or securing enough units to constitute a critical mass25. The critical mass
generally considered to substantiate management, maintenance, and leasing personnel is a minimum of one hundred units depending on the market26. Often times, investors will not
enter a market with this model unless there is a "reliable, proven path to building critical mass"27. The geographic location is an advantage as the aggregation component may provide access to areas previously untouched by institutional investors due to regulatory or land constraints, operational bandwidth, or other barriers to entry, as the assets are considered sub-institutional28. The proximity is important for operational efficiency and
while this is enhanced the closer the assets are to each other, the maximum distance between outlying assets should be four miles or an hour drive29. Another metric proposed
by a prominent institutional investor is to contain the portfolio within the same
Metropolitan Statistical Area (MSA), which denotes an urban concentration of 1 million or more inhabitants 30. This initial anchor portfolio will provide a substantial presence within
a market to establish operations and a brand.
A critical component to the success of the portfolio is a cohesive brand, and a cohesive
experience for the tenant31. The Journal of Corporate Real Estate highlights the importance
of branding conforming to the following criteria for success3 2:
* a brand has a name, symbol or design which identifies the product or service as having sustainable competitive advantage;
* results in superior profit and market performance;
25 Confidential, General Partner #2. November 10, 2014. 26 Confidential, General Partner #1, November 17, 2014. 27 Confidential, General Partner #3, November 17, 2014.
28 Operational bandwidth represents the capacity of the investor to effectively operate or manage
the assets in its control either directly or through a partner. In this case, institutional investors may be deterred from smaller assets with a high or complex operational burden.
29 Confidential, General Partner #1, November 17, 2014. 30 Confidential, Institutional Firm #1, November 3, 2014.
31 Abdul Jalil Omar and Christopher A. Heywood, "Defining a Corporate Real Estate Management's
(CREM) Brand," Journal of Corporate Real Estate 16, no. 1 (April 2014).
e is only an asset if it leads to sustainable competitive advantage; and
* like other assets, will depreciate without further investment.
Strategic branding will create a commonality across the properties although they will be separate and allow for autonomy in the operational components. A quality, recognized brand will also incur enterprise value to the assets while positioning the portfolio within the market.
Physical Constraints
Geographic constraints play a major role in the practicalities of an aggregation investment model. High barriers to entry, limited supply, and sustainable demand are the foundational frameworks for a successful small asset portfolio. Physical land constraints represent barriers that prevent the development of additional stock or the growth of a specific area often resulting in stable demand. These constraints are often the result of mountains, bodies of water, roadways, or physical components that make expansion either impossible or detrimentally difficult.
Regulatory Constraints
Regulatory barriers to entry are equally efficient at preventing new stock from entering a market. Regulatory scenarios often provide a framework that limits additional competition and creates a barrier to entry into a certain location or market. These can manifest
themselves in a myriad of ways such as historical landmarks, natural preserves, zoning uses, environmental protection, and other areas where legalities or governmental
authorities affect property usage. This can be beneficial, under the right circumstances, in identifying an area with limited supply, stable demand, and the potential to aggregate assets into a portfolio of critical mass.
Aggregation Challenges and Risks
The defined, non-institutional asset market exists in part because of the minimum equity investment imposed by institutional investors given the quantity of capital they are
required to deploy as well as the operational burden required to acquire and operate assets not of the size or scale included in the institutional asset class. Evidenced in the single-family residential investment market illustrates, possibly, the largest hurdle an aggregation investment model faces, the geographic dispersion of assets. According to an article by National Real Estate Investor, this has been hedged by attempting to build scale quickly33.
This often required a base of 1,000 single-family homes within a 30-mile radius in order to effectively scale operations. The challenges underscoring the single-family residential model are not unique, and some of them are universal to aggregation investment strategies. Outlined below are some of these challenges and risks as revealed through research and interviews.
1. Entry
- Deal Sourcing
- Replication of Investments
- Financing and Capital Markets
- Warehousing and Timing
- Acquisitions Costs 2. Operations
- Operator Qualifications
- Construction
- Scalability and De-Scalability of Operations
3. Exit - Financing - Exit Options 4. Other - Informational Inefficiency - Volatility - Market Correlation
- Idiosyncrasies of Non-Institutional Assets
33 Elaine Misonzhnik, "House Money," National Real Estate Investor 56, no. 4 (August 7, 2014):
Entry
The process of sourcing successful sub-institutional asset acquisitions is often complex, as these assets are typically owned by unsophisticated parties, which can result in unique and inconsistent challenges. The sub-institutional deal size is often under the radar of most top tier brokerage and advisory firms. The resulting inefficiency of information in the sub institutional market can be challenging to navigate. This frequently results in the need for focused proprietary research on behalf of the operating company, which often involves taking action with limited data34. These complexities often produce a challenge to consecutively replicating methods to source investment opportunities while building a portfolio to scale.
Timing of the investment aggregation is a critical component to the success of the strategy.
A "warehousing" risk exists where integral components to favorable investment outcomes
such as the capital markets, economic conditions, and asset pricing, change between the period of the first investment and the final investment to complete the aggregation portfolio. In order to mitigate this risk and attain economies of scale, investors at times assemble and acquire an initial portfolio in a specific market to offset costs and gain an entrance. This can be accomplished in a myriad of ways such as placing properties under contract with extended due diligence clauses, purchase options, and amassing several small portfolios. This "anchor" portfolio size is considered to be between 100 and 300 units, depending on the market, to cover the necessary costs for key personnel and gain
immediate scale35. Acquiring what are often multiple, smaller assets can incur substantial due diligence and closing costs as compared to a single, institutional asset. These costs can pose a substantial risk if not fully understood and accounted for in underwriting. With scale, these expenses can also be mitigated with service contracts and replicable systems around the due diligence process.
34 Confidential, General Partner #3, November 17, 2014. 3s Confidential, General Partner #1, November 17, 2014.
Capital market fluctuations can have a more profound impact on sub-institutional real estate due to the asset size, availability and cost of capital, as well as a myriad of other circumstances affecting the private owner that do not necessarily impact institutional companies. The availability of capital also has a direct impact on the ability of sub-institutional owners to compete in the market and refinance owned assets.
Operations
The operational expertise and capacity of all parties involved in the aggregation process is critical to the overall success of the investment strategy. The operating partner must be able to effectively execute the business plan alongside the contractors performing the renovation and the property manager throughout the lifecycle of the investments. A failure to include contractors throughout the due diligence process could result in unconsidered expenses and non-functional renovation plans36. The construction process also contains
challenging components such as understanding potential exit plans and how those will affect the type of required renovations. Additional challenges that must be considered include remodeling an asset with tenants in occupancy, a constrained timeline due to the importance of speed in the aggregation process, and effectively managing construction crews working at various locations. The overall aggregation, projected returns, and disposition have critical ties to the successful execution of the renovation stage.
The operator must be well qualified and exude a complex understanding of the target market, a detailed strategy, and ultimately the ability to execute the aggregation plan. Often times, these operators are intensely hands on with a finite understanding of the operational components necessary to lead a successful assemblage, business plan, and exit.
Another important component to the operating partner is their ability to scale and
ultimately de-scale operations in accordance with the business plan37. Both scenarios have
the potential to create conflict between the operator and its capital partner if no strategy is
36 Confidential, Institutional Firm #5, November 6,2014. 3 7 Ibid.
mutually agreed upon from the onset and consistently communicated throughout the investment period. High fixed costs, an operator overweight on personnel, or a disconnect with the market could incur challenges to de-scaling operations as the business plan reaches an exit stage.
Exit
The capital markets play as critical a role in the ability to enter a market as they do in the exit strategies. An aggregated portfolio presents several options for an exit strategy such as a portfolio sale, one-off dispositions, condo conversions, or the potential formation of a REIT38.While these options are largely considered benefits of the model, challenges exist in
understanding the local market as well as conducting an aggregation and renovation strategy in-line with realistic exit options and considering projected capital markets.
Other Challenges and Risks
An inefficiency in or lack of viable market information around non-institutional assets frequently results in taking action with limited data, which can expose the investor to unforeseen risks. Exposure to both known and unknown risks increases with time in an aggregation model. The shorter the duration of time between necessary acquisitions, the lower the probability that volatility related risk could be exuded on the portfolio.
Ultimately, idiosyncratic risks pertinent to local market and individual properties can be unique in nature and can be mitigated by a strong local operating partner.
Another risk that exists in the sub-institutional market is the existence of increased
correlation between assets with the general capital market. Real estate assets are appealing to investors because they provided a source of diversification from other investments, or in portfolio theory terms, real estate offered lower betas than similar risk investments in other industries39. Generally, non-institutional assets attract non-institutional tenants
38 Confidential, General Partner #2, November 10, 2014.
39 The Beta in portfolio theory is defined as the normalization of the investment risk as a fraction of
which are more affected by market swings, making them more correlated with broad economic conditions relative to their larger, institutional counterparts, this is particularly true for office, industrial and retail products.
Aggregation Benefits
While challenges and risks exist that are specific to aggregation models, there are numerous intrinsic benefits. The value-driving component to the data substantiated aggregation model is the ability to penetrate desirable markets, to capitalize on the yield arbitrage -partially in place and partially created through economies of scale, and then to take advantage of multiple exit opportunities.
Given the demand for quality real estate in core markets, aggregating a sub-institutional portfolio can provide an entry point that is otherwise unattainable for the institutional investor. Considering the data analysis performed in this thesis, the best performing
locations are often supply-constrained markets in which there are barriers that prevent or strongly hinder new entrants into the market, contain a dense population, and have strong demographics. These factors tend to assure that supply does not outpace demand, which leads to increasing rents within asset classes that are typically privately owned and fractured across a myriad of investors. The aggregation model capitalizes upon the operational and yield opportunities through the consolidation of these sub-institutional properties, which do not fit the typical institutional asset mold.
The aggregation strategy may require a strong renovation plan to achieve consistency in rents, branding and property components across the portfolio. This allows for the
revitalization of assets, which could result in a transformational impact on the surrounding community as the area is improved. Re-developing communities in areas ripe for
is not only proportional to its own volatility, but also to its correlation with the market's portfolio. A lower beta means that the investments are not as correlated with the general market, providing good source of diversification.
aggregation can have an accretive effect on the local market as a whole, not just the specific
assets40.
The economies of scale achieved will also benefit the investors through operational efficiencies that can also be realized upon initial acquisition from un-sophisticated ownership and on an increasing basis as the portfolio grows. Cost reducing benefits
primarily come in the form of bulk service contracts and lower expenses due to operational expenses spread across multiple properties.
Ultimately the capital markets will determine the best strategy, but there are multiple exit options available to the owners of an aggregated portfolio. These include the sale of the portfolio as a whole to an institutional grade investor, one-off sales of individual assets, or potential condo conversions for the sale of individual units in the multi-family context. Dependent upon the size of the portfolio, there is also the potential to offer the assets publicly through the formation of a Real Estate Investment Trust (REIT)41.
40 Confidential, Institutional Firm #4, November 5, 2014. 41 Confidential, General Partner #2, November 10, 2014.
CHAPTER 5. Operational Components
The previous CHAPTER 4explained the framework, challenges, and benefits to an aggregation investment model while touching on the operational structure. Moving forward, the following chapter will further elaborate on the components affecting the operation of sub-institutional portfolios from property management to outlining potential exit strategies.
To Institutional asset owners, buying assets right is important, but efficient operation of owned real estate is more critical. Challenges often voiced by professionals during interviews revolved around the scaling of operations to absorb assets as the portfolio grew42. Equally important is the de-scaling of operations as the business plan reached an exit stage, which resulted in one-off sales or a portion of the portfolio. Both scenarios can create conflict between the operator and its capital partner if no strategy is laid out at the onset. These issues encompass fixed costs and employees associated with implementing and managing the investments, as well as the space occupied by the general partner for the undertaking. We will touch on some of the main operational components during this
chapter.
Property Management
Operating costs relating to managing the properties are also a point of debate. Aggregation models have been successfully executed using both in-house and third party property management43. The argument against third party managers in these scenarios hinges upon an alignment of interests and whether managers can be effectively incentivized to
outperform given the level of operational intensity required. Additional challenges to third party management include communication components of independent firms instead of being under common ownership, as well as a common and current understanding of the
overall business strategy for the investments. Proponents of in-house management
42 Confidential, Institutional Firm #5, November 6, 2014.
leverage these perspectives while opposing views point out that focusing on deal sourcing and aggregation strategy enables a more effective approach given the critical timing involved while allowing a third party management to execute the business plan.
According to a paper published by the Building Services Operation and Maintenance
Executives Society of Hong Kong, four key factors of success in building or hiring a property
management organization in a dense, residential context are outlined below44:
* Discipline
* Key performance measures
* Necessity and cost-effectiveness of maintenance * Expenditure against budget
We found that ultimately both in-house and third party management operations could be successful with the outcome contingent upon several factors including management expertise and ability to scale accordingly, relationship between the property management group and operating partner, as well as an acute understanding of the investment strategy for both parties 45.
In addition to the actual property level management components, important items vital to the aggregation model and a potential institutional investor exit include the accounting and reporting mechanisms employed by the manager.
Construction and Renovations
Given the value-add nature the majority of aggregation investment models exhibit, there is typically a renovation plan in place to renovate units due to their vintage, to attain a level of consistency across the portfolio, and boost rents. While this resurfaces similar issues to the in-house or third party property management debate, the same conclusions hold.
44 "Key Success Factors of Building Management in Large and Dense Residential Estates," Facilities
23, no. 1/2 (January 2005): 47-62.
Regardless of the construction segment's position whether in-house or third party, all firms engaged the contracting expertise early in the acquisition process to fortify projected costs.
Role of Technology
Technology has played a critical role in advancing the investors' ability to scale operations and management across numerous assets in varying locations as evidenced by the public offerings of single family home portfolio Real Estate Investment Trust's (REIT's) 46.In the multi-family arena, property management software such as Yardi, Buildium.com, and MRI Management Software have enabled the operator to scale operations without necessarily compounding fixed costs with additional employment of management, accounting, leasing, and maintenance staff. These and similar programs automate much of the daily
management process by allowing tenants to pay rent electronically, generate maintenance requests and, while enabling operating companies to automatically generate available postings to rental websites, notify vendors of work orders and compile financials at the click of a button47. In addition to systematic advancements, this data has been collected and with proper analysis can aid operators in determining a myriad of beneficial factors such as common issues with buildings inspected and how efficient their firm is throughout the due diligence process to when energy loads demand peaks on their properties to
pre-determining maintenance issues before they arise. These technological efficiencies allow for operators to locate, conduct efficient due diligence, acquire buildings, and provide a quality tenant experience in ways that previously would have been considered
unattainable because of the lack of operational scalability.
General Expenses
According to industry professionals and operators, the economies of scale achieved through aggregation models can result in a 14% to 20% savings in expenses relative to
46 Karen Weise, "Wall Street Wants You to Become a Landlord," Business Week com, May 6, 2013,
5-5.
general expenses incurred by similar assets owned by non-institutional investors 48. These
cost savings are primarily realized from bulk service agreements such as trash, hardware purchasing, and other contracts achieved at scale. The cost of repairs and general
maintenance also decrease with scale as dedicated staff are employed rather than individual service calls. Online maintenance requests, work order processing, and scheduling also contribute to cost savings and improve the efficiency of management across a portfolio of individual buildings.
Additional expenses are subjective and locational dependent such as property taxes and insurance. According to a national risk management advisory firm, insurance may decrease with a portfolio of assets given the geographical spread of risk49. The example provided
depicted a single building with 200 units versus 10 buildings with 20 units each. In the event of a damaged roof, fire, or flood the displaced tenancy and cost burden is greater with the single building while the damage exposure to the individual building is considered to be more limited. Regardless of locational premiums that will be in affect such as the risk of hurricanes in Miami or earthquakes in Los Angeles, the chance of damage is spread over multiple assets in the portfolio, which could result in lower premiums.
Exit Strategies
An aggregated portfolio has the added benefit of several exit mechanisms as opposed to single, institutional sized assets. Ultimately, the capital markets drive the exit strategy employed at the time of sale. The capital source and corresponding holding period are also taken into effect regarding the desired multiple or internal rate of return (IRR) to the investors. Regarding multi-family assets, four options have been proven successful at varying times in market cycles50:
48 Confidential, General Partner #2, November 10, 2014.
49 Confidential, Risk Management Advisor, October 27, 2014.
* Portfolio Exit: Sell the aggregated portfolio to an institutional or other quality
investor. Most efficient method regarding the cost of sale, timing to complete the transaction, and potentially realize a premium based on the portfolio.
* Individual Asset Exit: Sell assets individually to high net worth investors, private
owners, or similar purchasers. Often achieve a higher price per individual property. However, the Internal Rate of Return (IRR) could be depressed based on the length of the sale process between first and last asset sold. Additional costs associated with marketing and closing the assets could dilute and benefit from a higher individual sales price.
* Condo Conversion Exit: Converting the units to condominiums for individual sales
is ultimately dependent upon the capital markets. This strategy may yield the highest return but would also incur corresponding risk with additional costs and time.
- Public Offering: An initial public offering serves as a potential exit dependent upon
the size and scope of the portfolio assembled.
The benefits of multiple exit strategies must be aligned with the business plan from the beginning of the aggregation investment. For example, certain renovation thresholds must be considered should the disposition strategy entail condominium conversions as opposed to a rental portfolio sale. Ultimately, the optionality component to the exit strategies is a significant value to the aggregation investment model.
Data Analysis
Data Parameters
The $5 to $10 million threshold regarding non-institutional asset values for this thesis was arrived at through both qualitative and quantitative measures. The stated collective equity investment floor of a majority of institutional funds is $5 millions1. As previously
evidenced, there is no clear and defined delineation between institutional and non-institutional assets. Considering the varying ambiguity of defining non-institutional assets as well as the data and information available to us, we concluded on using total asset valuation as the defining measurement. Additionally, we sought to examine potential discrepancies in the data using two different valuation thresholds. The first considered an institution acquiring an asset with a minimal direct investment of $5 million and securing financing of 50% loan-to-value, common leverage for "core-plus" assets, which results in an asset value eclipsing $10 million. Secondly, we ran analyses using a straight $5 million valuation with all asset values greater being considered Institutional.
For the purpose of this thesis and the availability of data, we determined the defining line of institutional assets to be those over $10 million in value. Although most assets below
$10 million in value would be considered non-institutional, we defined a group between
$2.5 and $10 million in total value for all asset types, including multi-family buildings, as "sub-institutional assets". Given the broad nature of the division between institutional and non-institutional assets and based on available data, we decided to delineate categories based on a total asset value. This is a generalization with several outlying factors, however research and industry professionals agreed on the parameters in place for this analysis.
Considering this, in the present study, assets valued below $2.5 million were not included in the quantitative research. This was due to a lack of available data for assets values under $2.5 million. Our data focuses on assets in the valuation gap just above the majority of individual investors and slightly below institutional funds.
51 Confidential, Institutional Firm #5, November 6, 2014. CHAPTER 6.
Data Set 1: $ 2.5M < Type 1 < $10M, Type 2 > $10M
Data Set 2: $2.5M < Type 1 < $5M, Type 2 > $5M
Data Sources and Other Basic Information
Through the support of Real Capital Analytics, this research benefitted from full access to the raw data in their repeat sales database. This data set consisted of over 68,000 repeat sales transactions for U. S. commercial real estate since 2000. RCA is a company that started tracking commercial (income producing) property transactions in the year 2000 and they have totaled over $9 trillion of reported trades. Real Capital Analytics is one of the most respected and comprehensive real estate research firms in the world and as such, their information is of the highest quality available.
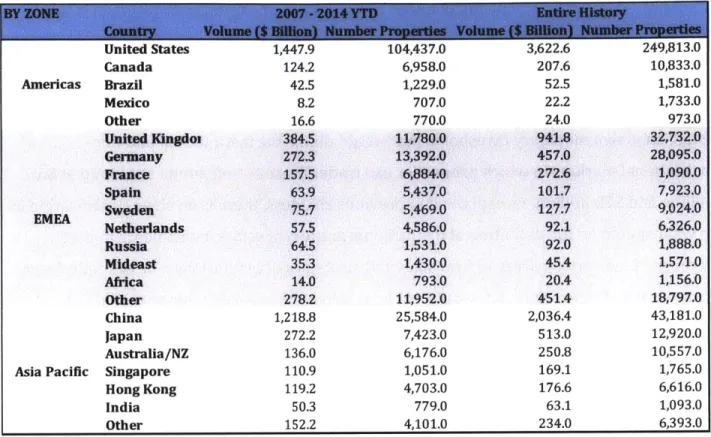
RCA coverage has significantly expanded since 2000; especially in 2007 when operations were scaled internationally, covering markets in all continents except Antarctica. As Table
6-1 shows, they are in most if not all developed countries and in some of the biggest
developing economies in the world.
The composition of the RCA's data varies, it reports on transactions consisting of
apartments, industrial, office, retail, hotel, and senior housing & care, to developable land sites. Their focus is on commercial properties that trade above $2.5 million for U.S.