HAL Id: hal-00318248
https://hal.archives-ouvertes.fr/hal-00318248
Submitted on 21 Dec 2006
HAL is a multi-disciplinary open access
archive for the deposit and dissemination of
sci-entific research documents, whether they are
pub-lished or not. The documents may come from
teaching and research institutions in France or
abroad, or from public or private research centers.
L’archive ouverte pluridisciplinaire HAL, est
destinée au dépôt et à la diffusion de documents
scientifiques de niveau recherche, publiés ou non,
émanant des établissements d’enseignement et de
recherche français ou étrangers, des laboratoires
publics ou privés.
energetic particle events of solar cycle-23
R. Rawat, S. Alex, G. S. Lakhina
To cite this version:
R. Rawat, S. Alex, G. S. Lakhina. Low-latitude geomagnetic signatures during major solar energetic
particle events of solar cycle-23. Annales Geophysicae, European Geosciences Union, 2006, 24 (12),
pp.3569-3583. �hal-00318248�
www.ann-geophys.net/24/3569/2006/ © European Geosciences Union 2006
Annales
Geophysicae
Low-latitude geomagnetic signatures during major solar energetic
particle events of solar cycle-23
R. Rawat, S. Alex, and G. S. Lakhina
Indian Institute of Geomagnetism, New Panvel (W), Navi Mumbai-410218, India Received: 23 August 2006 – Accepted: 26 October 2006 – Published: 21 December 2006
Abstract. The frequency of occurrence of disruptive
tran-sient processes in the Sun is enhanced during the high solar activity periods. Solar cycle-23 evidenced major geomag-netic storm events and intense solar energetic particle (SEP) events. The SEP events are the energetic outbursts as a result of acceleration of heliospheric particles by solar flares and coronal mass ejections (CMEs). The present work focuses on the geomagnetic variations at equatorial and low-latitude stations during the four major SEP events of 14 July 2000, 8 November 2000, 24 September 2001 and 4 November 2001. These events have been reported to be of discernible mag-nitude following intense X-ray flares and halo coronal mass ejections. Low-latitude geomagnetic records evidenced an intense main phase development subsequent to the shock im-pact on the Earth’s magnetosphere. Satellite observations show proton-flux enhancements associated with solar flares for all events. Correlation analysis is also carried out to bring out the correspondence between the polar cap magnetic field perturbations, AE index and the variations of low-latitude magnetic field. The results presented in the current study elucidate the varying storm development processes, and the geomagnetic field response to the plasma and interplanetary magnetic field conditions for the energetic events. An im-portant inference drawn from the current study is the close correspondence between the persistence of a high level of proton flux after the shock in some events and the ensuing intense magnetic storm. Another interesting result is the role of the pre-shock southward IMF Bzduration in generating a
strong main phase.
Keywords. Magnetospheric Physics (Storms and
sub-storms) – Solar Physics, Astrophysics, and Astronomy (En-ergetic particles; Flares and mass ejections)
Correspondence to: S. Alex (salex@iigs.iigm.res.in)
1 Introduction
The dynamic Sun is characterized by disruptive transient en-ergetic processes, such as solar flares and coronal mass ejec-tions (CME), which are attributed to the temporal and spatial instabilities of the complex solar magnetic field. During solar flares a tremendous amount of energy of the order of ∼1028 ergs is released, whereas in CMEs, higher energy of the or-der of ∼1032 ergs, accompanied by a huge quantity of mass (∼ 1016g) with a speed ranging from ∼300 to ∼2000 km/s, is released. During active periods, enormous energy emis-sion from the solar interior is sufficient to energize and ac-celerate the energetic particle population existing in the solar environment. Such outbursts of energetic and accelerated he-liospheric particles are called Solar Energetic Particles (SEP) events.
The first observation of SEPs from the Sun was recorded nearly 50 years ago in the form of an abrupt enhancement in the intensity in ground-level ion chambers during the large solar events which occurred in February and March 1942 (Forbush, 1946). Differentiation of the solar energetic par-ticle events as impulsive and gradual SEP events was pre-sented on the basis of their association with solar flares and coronal mass ejections, respectively (Cliver et al., 1983; Cane et al., 1988 and Kahler, 1986, 1992). Cane et al. (1986) observed a difference in the ratio of proton to electron popu-lations for the two classes of SEPs.
The SEP events are characterized by abrupt enhancements in the proton flux in the energy range of keV to MeV, follow-ing the powerful solar emissions. Proton showers associated with solar transient eruptions are accompanied by enormous energy and mass that upon impacting the Earth’s magneto-sphere, lead to a sudden disturbance in the Earth’s magnetic field, known as Geomagnetic storms (Sugiura and Chapman, 1960; Gonzalez and Tsurutani, 1987). A large fraction of the energy associated with the solar ejecta is transferred into the Earth’s magnetosphere mainly by the process of mag-netic reconnection (Dungey, 1961; Akasofu, 1981; Gonzalez et al., 1994, 1999). Subsequently, this energy is distributed
in various regions of the magnetosphere in different quanti-ties. The energetic protons and ions in the energy range be-tween ∼20 keV to ∼300 keV are trapped in the geomagnetic field and gyrate around the ambient field as a result of the Lorenz force. These ions also experience a westward drift, owing to the presence of gradients and curvatures in the ge-omagnetic field. The energetic electrons, on the other hand, experience an eastward drift due to gradients and curvatures of the geomagnetic field. This generates a toroidal current in the region from ∼2RE to ∼7RE and is known as the
ring current (Singer, 1957; Baumjohann et al., 1996). This induces a magnetic field opposite to the ambient geomag-netic field, to form a sharp depression in the Earth’s maggeomag-netic field, called the main phase of the geomagnetic storm. Dif-ferent geomagnetic storms exhibit diverse evolution profiles that can be attributed to the varying interplanetary conditions. The north-south component of interplanetary magnetic field, “Bz”, plays a crucial role in the excitation of the magnetic
reconnection process at the magnetopause. During the south-ward incursion periods of IMF Bz, the IMF field lines
recon-nect with the oppositely directed geomagnetic field lines to reinforce the energy transfer (Tsurutani and Gonzalez, 1997; Gonzalez et al., 2001; Feldstein et al., 2003).
The dynamic interaction between solar wind and magneto-sphere is widely reflected in high-and low-latitude magnetic variations. The coupling between the solar wind and the high latitudes results in ionospheric convection and subsequent perturbation in polar cap magnetic activity. Several global indices have been defined to indicate the state of the magne-tosphere at any given time, namely the Kpindex, Dstindex, Sym − H and AE index. Bartels (1939) proposed a 3-hourly
index called the Kpindex. Mid-latitude magnetometer
sta-tions have been chosen for obtaining the Kp index, as they
are devoid of auroral elecrojet currents. Sugiura (1964) in-troduced an hourly index and called it the disturbance storm time (Dst) index, as it is a direct measure of the hourly
av-erage of the geomagnetic perturbation. The hourly index is obtained from low-latitude equatorial magnetometer stations to avoid electrojet affects. To describe the geomagnetic fields in mid latitudes with a high time resolution of 1 min, a sym-metric index is introduced for the two components of the ge-omagnetic fields, horizontal (H ) and orthogonal (D), and are depicted as Sym − H and Sym − D. To obtain magnetic per-turbation in the horizontal component (H ) at the auroral zone with a 1-min resolution, Davis and Suguira (1966) proposed auroral electrojet (AE) index from a number of stations dis-tributed in the Northern Hemisphere. Another index was in-troduced by Troshichev et al. (1979, 1988) for measuring the disturbances in the polar cap magnetic activity in response to changes in the IMF southward component and solar wind velocity, and was called the polar cap (P C) index. Venner-stroem et al. (1991) and Takalo et al. (1998) investigated the relationship between polar cap magnetic field variations and auroral electrojet activity, and have found a fairly good cor-relation.
The present study highlights the low-latitude geomagnetic signatures as a consequence of the energetic proton events and associated coronal mass ejections. Sometimes energetic proton events do not show correspondence with geomagnetic signatures. One of the most typical energetic proton events occurred in October 1989 that was characterized by a spike in proton flux but did not have any association with the geomag-netic disturbance (Shea and Smart, 1998). Thus, understand-ing the geo-effectiveness of the wide varieties of such phe-nomena is crucial in understanding the near-Earth space en-vironment. The uncertainty for all the four events as obtained from the fit procedure (linear) comes out to be 2–3 min.
2 Data base examined
Solar cycle 23 started in year 1996 and peaked in 2000, fol-lowed by a second peak in 2001. The solar maximum period is featured by an enhancement in numerous explosive events like large solar flares, coronal mass ejections, solar proton events and consequent geomagnetic storms. The current so-lar cycle also witnessed intense proton events, as reported by SOHO/CELIAS, out of which four major SEP events are discussed in the present work.
The data set utilized for the current work is taken from var-ious sources. Solar flare and coronal mass ejection (CME) onset information is taken from geosynchronous satellite GOES-8 and LASCO instruments on board the SOHO satel-lite, respectively. Actual CME onset time considered in the present cases is taken, as suggested by Zhang et al. (2002), with the definition given as the time when CME is at the height of 1.1 Rs and is calculated by fitting the CME
height-time profile given by the SOHO/LASCO CME catalog, as-suming that the CME is moving with a constant speed. Magnetic field and solar wind data are extracted from the SWEPAM and MAG instruments of the upstream spacecraft Advanced Composition Explorer (ACE), located at L1 point (GSE ∼240 RE), and the WIND satellite (GSE ∼0.1 RE to ∼85RE). It may be noted that ACE or SOHO satellites are
near the L1 point upstream and hence receive a shock im-pact ∼1 hr prior to the magnetosphere. Proton flux data is taken from the EPAM instrument of ACE and the COSTEP instrument of the SOHO satellite. The interplanetary mag-netic field data set contains east-west component (By),
north-south component (Bz) of interplanetary magnetic field (IMF)
and total IMF (|B|). Solar wind data consists of solar wind speed (Vsw) and proton density (Np). All the satellite data
acquired in this paper has been originally analyzed by re-spective instrument team members. Low-latitude regions are devoid of auroral and equatorial electrojets effects. In consid-eration of this point, for the current study, one-minute digital data of the horizontal component (H ) from the low-latitude observatories located at Alibag (geographic lat. 18.63◦N, long. 72.87◦E; geomagnetic lat. 10.02◦N, long. 145.97◦) and Tirunelveli (geographic lat. 8.7◦N, long. 77.8◦E;
geomag-netic lat. 0.32◦S, long. 149.76◦) are used. Diurnal departures
are computed by subtracting the mean midnight level for the day and have been depicted by 1HABG and 1HTIR for
re-spective magnetic observatories, which will be used through-out the work presented here. Hourly average values of the storm-time disturbance index Dst, 1-min resolution values
for the auroral electrojet (AE) index have been acquired from the World Data Center, Kyoto. Magnetic disturbances at the polar cap are measured by polar cap index (P C) and the data is taken from Thule for the northern polar cap.
3 Case studies
3.1 Case 1: 14 July 2000
3.1.1 Solar conditions and proton flux
The most referred to as major proton event of current solar is popularly known as the “Bastille day event”. The event originated from an X-ray solar flare of magnitude X5.7 on 14 July 2000 that occurred in the NOAA active region num-ber 9077, located near the center of the solar disk at 22◦north and 7◦west. Topmost curves in Fig. 1 show the flare charac-teristics as recorded by GOES-8 at two wavelengths of 0.5-4 ˚Aand 1-8 ˚A. The vertical dashed line at 10:03 UT marks the onset of the solar flare on 14 July, with a subsequent peak at 10:24 UT. This solar flare eruption was followed by a proton shower after about 36 min of the flare maximum, with the enhancement in energetic particle flux observed at 11:00 UT. The bottom panel of Fig. 1 depicts the proton flux at various energy levels including low energy ranges of 47–65 keV, 112–187 keV and higher energy ranges of 0.31– 0.58 MeV, 0.76–1.22 MeV, 1.06–1.91 MeV from ACE and 1.99–6.03 MeV from SOHO. Around 11:00 UT, a relatively larger enhancement in the flux of higher energy particles (0.31–1.91 MeV) is seen compared to the increase in the 47– 187 keV range particle flux though the background flux lev-els just before onset of SEP event are much higher for lower energies. A steady profile is observed for the 47–187 keV range particles after the enhancement for nearly a period of 12:00 h, while in the higher energy range of 0.31–6.03 MeV, particle flux continued to increase. Following this pattern a continuously increasing trend can be seen in all energy ranges that persisted until an abrupt enhancement was con-fronted on the second day of the SEP onset at 14:35 UT. Dur-ing the period 14:35 UT to 19:10 UT, the 47–187 keV range particles acquired a high flux, of the order of ∼ 105−107 particles/cm2/s/sr/MeV. A special feature observed in this proton event is the persistence of high proton flux (∼3×10⁶ particles/cm2/s/sr/MeV) for nearly a period of 4 h (15:00– 18:55 UT), in all energy channels following the interplane-tary shock (Fig. 1).
10-8 10-6 10-4W a tts / m 2 6 12 18 0 6 12 18 0 6 UT (hr) 100 101 102 103 104 105 106 107 Pr o to n s /(c m 2 s r s Me V) 47-65 keV 112-187 keV 0.31-0.58 MeV 0.76-1.22 MeV 1.06-1.91 MeV X5.7 GOES-8 X-Ray Flux Shock 14-16 July 2000 1-8A 0.5-4A
14 Jul. 15 Jul. 16 Jul.
ACE Proton Flux
SOHO Proton Flux
---1.99-6.03 MeV
Fig. 1. Upper panel shows X-ray flux at two wavelengths 0.5–4
˚
A and 1–8 ˚A. Proton flux characteristics in various energy levels of 47–65 keV, 112–187 keV, 0.31–0.58 MeV, 0.76–1.22 MeV and 1.06–1.91 MeV (ACE) and 1.99-6.03 MeV (SOHO) for 14–16 July 2000 are shown in the lower panel.
3.1.2 Interplanetary shock and geomagnetic storm In Fig. 2 the interplanetary magnetic field and ground mag-netic signatures are reproduced for the intense storm event of 14 July 2000. The coronal mass ejection traveling with a high speed of ∼1674 km/s, associated with the flare event on 14 July, was recorded by LASCO on board SOHO, on the same day at 10:25 UT. The CME driven interplanetary shock (IPS) was recorded by ACE on 15 July at 14:15 UT after about 27 h 49 min of CME occurrence. As reported by SOHO (PM), at the time of the shock, Vswand Npincreased from ∼600 km/s
to ∼800 km/s and ∼6 protons cm−3to ∼17 protons cm−3, re-spectively. Impingement of the CME shock on the magneto-sphere, compressed the magnetopause resulting in a storm sudden commencement (SSC) feature at ground magnetic observations. The SSC was detected at 14:40 UT on 15 July, following the interplanetary shock with a discernible ampli-tude of 118 nT in the “H ” component at the low-latiampli-tude Al-ibag observatory and 103 nT at Tirunelveli, as shown in the lowest panel of Fig. 2. The magnetic storm commenced at
-40 -20 0 20 40 60 n T -80 -60 -40 -20 0 20 40 n T -300 -200 -100 0 n T Dst 0 6 12 18 0 6 12 18 0 6 UT (hr) -500 -400 -300 -200 -100 0 100 n T Shock SSC ABG-118 nT TIR-103 nT 15-17 July 2000 ∆HABG Bz By |B|
15 Jul. 16 Jul. 17 Jul.
∆HTIR 0 20 40 60 80 n T
Fig. 2. From top to bottom: IMF |B|, IMF By, IMF Bz, hourly
av-eraged Dstindex, 1-mindigital magnetic data 1HABGand 1HTIR for 15–17 July 2000. Red star (*) depicts local noon.
local nighttime hours for Alibag (ABG). Local noon has been indicated by a red star in Fig. 2. The transit speed of the shock can be assessed by the delay in the arrival of the shock at ACE and that of the SSC at the magnetopause, and for this event the speed has been computed to be 998 km/s. Fol-lowing the SSC, from 14:40 to 19:10 UT, an unsteady
vari-ation in 1HABGand 1HTIR persisted for almost 4 h 30 min
and correspondingly a consistent fluctuating pattern in IMF
Bzbetween the values −25 nT to +25 nT was quite evident.
During this period IMF By and the total magnetic field |B|
also exhibited some rapid variations, ranging from −20 nT to +20 nT for IMF By. The main phase onset is
charac-terized by a sharp depression in 1HABG, 1HTIR and Dst
around 19:10 UT on 15 July, almost with a delay time of 4 h 30 min from the shock impact time. Prior to the storm sudden commencement, IMF Bzwas oriented southward for ∼8 h, with average values ∼10 nT. At 18:45 UT, IMF Bz
tra-versed sharply southward, attaining a peak of ∼−60 nT at 19:30 UT. Total IMF field |B| steadily acquired high values
∼60 nT after the initial oscillating pattern. Low energy par-ticles (47–187 keV) from the proton shower resulted in the enhancement of a westward flowing ring current. The south-ward orientation of IMF Bzlasted for about 5 h when the IMF
turned northward sharply at 00:25 UT on 16 July. During this phase, as inferred from 1H for both the low-latitude sta-tions at Alibag (ABG) and Tirunelveli (TIR) (bottom panel of Fig. 2), a sudden decrease in the 1HABG, 1HTIR field
commenced as the Bzturned southward, following which the
recovery commenced around 22:00 UT.
3.2 Case 2: 4 November 2001
3.2.1 Solar conditions and proton flux
The proton event of 4 November 2001 is the most intense solar energetic particle event of the current solar cycle, as reported by CELIAS/MTOF. An intense solar flare of mag-nitude X1, produced by the active region numbered 9684 lo-cated at 6◦north 18◦west, occurred at 16:03 UT on 4 Novem-ber, as recorded by GOES-8 (Fig. 3). After about 45 min following the flare maximum at 16:20 UT, a proton event occurred at 17:05 UT. Proton fluxes recorded at six energy ranges (47 keV to 1.91 MeV from ACE and 1.99 MeV to 6.03 MeV from SOHO) are shown in Fig. 3. The increase in proton flux at all energy ranges at the onset of the proton event at 17:05 UT following the solar flare is followed by a steady increase. Higher energy ranges (0.31–6.03 MeV) exhibit a relatively larger enhancement magnitude ∼ 102 particles/cm2/s/sr/MeV (lower panel of Fig. 3). The increas-ing trend in proton flux continued gradually to attain its peak at the shock time of 01:20 UT on 6 November. At this time the flux at all the lower energy ranges experienced an abrupt increase. Similar to the July 2000 proton event, the persist-ing high proton fluxes (∼2×10⁶particles/cm2/s/sr/MeV) in all energy channels are seen after the passage of the inter-planetary shock. The striking feature to note is that the fluxes remained at such a large level for a period of ∼9 h (04:05– 12:55 UT) at the development stage of the intense storm.
10-9 10-7 10-5 W a tts / m 2 6 12 18 0 6 12 18 0 6 12 18 UT (hr) 10-3 10-2 10-1 100 101 102 103 104 105 106 107 Pr o to n s /(c m 2 s r s Me V) 47-65 keV 112-187 keV 0.31-0.58 MeV 0.76-1.22 MeV 1.06-1.91 MeV
X1 X-Ray FluxGOES-8
1-8A 0.5-4A ACE Proton Flux Shock 4-6 November 2001
4 Nov. 5 Nov. 6 Nov.
SOHO Proton Flux
---1.99-6.03 MeV
Fig. 3. Upper panel shows X-ray flux at two wavelengths 0.5–4 ˚A
and 1–8 ˚A. Proton flux characteristics in various energy levels of 47–65 keV, 112–18 keV, 0.31–0.58 MeV, 0.76–1.22 MeV and 1.06– 1.91 MeV (ACE) and 1.99-6.03 MeV (SOHO) for 4–6 November 2001 are shown in the lower panel.
3.2.2 Interplanetary shock and geomagnetic storm On 4 November 2001, a full halo coronal mass ejection occurred at 16:12 UT, associated with X1 solar flare. As recorded by LASCO/SOHO, CME was ejected with a high speed of ∼1810 km/s. The interplanetary parameters and the ground magnetic signatures for the event on 4 Novem-ber 2001 are reproduced in Fig. 4. The fast CME drove an interplanetary shock that was recorded by ACE after about
∼33 h at 01:20 UT on 6 November 2001, as evidenced by a rapid increase in the solar wind parameters. A sig-nificant increase was noted in the solar wind speed (Vsw)
from ∼475 km/s to ∼700 km/s and the proton density (Np)
from ∼4 protons cm−3to ∼45 protons cm−3, as reported by SOHO/PM. About 33 min later, a storm sudden
commence-0 20 40 60 80 n T -40 -20 0 20 40 60 n T -80 -60 -40 -20 0 20 40 n T -300 -200 -100 0 n T Dst 6 12 18 0 6 12 18 0 6 UT (hr) -500 -400 -300 -200 -100 0 100 n T Shock SSC ABG-76 nT TIR-100 nT 5-7 November 2001 ∆HABG Bz By |B|
5 Nov. 6 Nov. 7 Nov.
∆HTIR
Fig. 4. From top to bottom: IMF |B|, IMF By, IMF Bz, hourly
av-eraged Dstindex, 1-min digital magnetic data 1HABGand 1HTIR for 5–7 November 2001. Red star (*) depicts local noon.
ment was recorded by the ground observatories on 6 Novem-ber 2001 at 01:53 UT. The shock transit speed for this case has been assessed to be 756 km/s. At Alibag, SSC has an amplitude of 76 nT, whereas it has an amplitude of 100 nT at Tirunelveli (bottom panel of Fig. 4). The red star in the figure marks the local noon. Referring to the interplanetary
10-9 10-7 10-5Wa tts / m 2 6 12 18 0 6 12 18 0 6 12 18 UT (hr) 10-3 10-2 10-1 100 101 102 103 104 105 106 107 Pr o to n s /(c m 2 s r s Me V) 47-65 keV 112-187 keV 0.31-0.58 MeV 0.76-1.22 MeV 1.06-1.91 MeV Shock M7.4 M2
M1 1-8A X-Ray FluxGOES-8
0.5-4A
ACE Proton Flux 8-10 November 2000
8 Nov. 9 Nov. 10 Nov.
SOHO Proton Flux ---1.99-6.03 MeV
Fig. 5. Upper panel shows X-ray flux at two wavelengths 0.5–4
˚
A and 1–8 ˚A. Proton flux characteristics in various energy lev-els of 47–65 keV, 112–187 keV, 0.31–0.58 MeV, 0.76–1.22 MeV and 1.06–1.91 MeV (ACE) and 1.99–6.03 MeV (SOHO) for 8–10 November 2000 are shown in the lower panel.
conditions on 5 November, for a period of ∼6 h prior to SSC, the IMF Bzwas southward with a magnitude of ∼10 nT
(shaded portion), until a sharp southward traversal occurred at 01:25 UT on 6 November near the shock. This triggered the main phase of the storm as is evident by the sharp de-crease in 1HABG and 1HTIR. A significantly large and
steady southward IMF Bzwas observed for almost 4 h, and
it is probably responsible for the development of an intense main phase for this event. A peak value of Bz ∼−80 nT
was attained at 02:40 UT on the same day, simultaneously IMF |B| maximized to a large value of ∼80 nT; this led to
Dst ∼−300 nT for this storm. Before the complete
recov-ery of this intense main phase, there was a second phase of southward orientation of Bz with a peak value of ∼−20 nT
around 13:10 UT, a concurrent feeble decrease in, 1HABG
and 1HTIRis also evidenced.
0 10 20 30 n T |B| 10-11 November 2000 -20 0 20 n T By -20 0 20 n T Bz 0 10 20cm -3 Np 400 600 800 k m /s Vsw -100 0 n T Dst 0 6 12 18 0 6 12 18 UT (hr) -200 -100 0 100 n T ∆HABG Shock SSC ABG-50 nT TIR-93 nT 10 Nov. 11 Nov. ∆HTIR
Fig. 6. From top to bottom: IMF |B|, IMF By, IMF Bz, proton
density (Np), solar wind speed (Vsw), hourly averaged Dst index, 1-min digital magnetic data 1HABGand 1HTIRfor 10–11 Novem-ber 2000. Red star (*) depicts local noon.
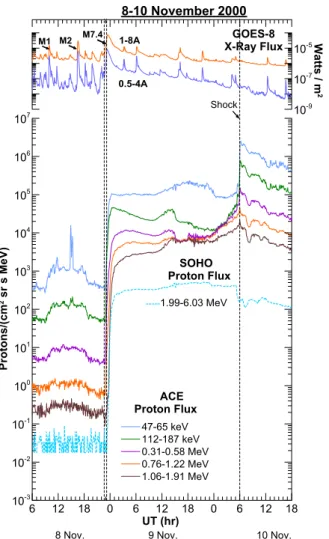
3.3 Case 3: 8 November 2000 3.3.1 Solar conditions and proton flux
The 8 November 2000 event was characterized by the oc-currence of three consecutive M-class solar flares of mag-nitudes M1.5, M2.9 and M7.4, respectively. A major M-class M7.4 flare onset was recorded by GOES-8 at 22:42 UT with a subsequent maximum at 23:28 UT on 8 November, as depicted in the upper panel of Fig. 5. This flare is as-sociated with the active region 9213 located at 10◦north
and 22◦west, which produced a major proton event shortly
after 23 min at 23:05 UT on 8 November. A significant enhancement in proton flux in all energy ranges is promi-nently visible (bottom panel in Fig. 5). High-energy (0.31– 6.03 MeV) particles exhibited a relatively greater magnitude of flux increase of the order of ∼104particles/cm2/s/sr/MeV in comparison to that at the 47–187 keV level increase of
∼102 particles/cm2/s/sr/MeV. A steady pattern is succes-sively observed in all energy ranges which persisted until
10-8 10-6 10-4W a tts / m 2 6 12 18 0 6 12 18 0 6 12 18 UT (hr) 10-3 10-2 10-1 100 101 102 103 104 105 106 107 Pr o to n s /(c m 2 s r s Me V) 47-65 keV 112-187 keV 0.31-0.58 MeV 0.76-1.22 MeV 1.06-1.91 MeV X2.6 1-8A 0.5-4A ACE Proton Flux Shock GOES-8 X-Ray Flux 24-26 September 2001
24 Sep. 25 Sep. 26 Sep.
SOHO Proton Flux
---1.99-6.03 MeV
Fig. 7. Upper panel shows X-ray flux at two wavelengths 0.5–4
˚
A and 1–8 ˚A. Proton flux characteristics in various energy lev-els of 47–65 keV, 112–187 keV, 0.31–0.58 MeV, 0.76–1.22 MeV and 1.06–1.91 MeV (ACE) and 1.99–6.03 MeV (SOHO) for 24–26 September 2001 are shown in lower panel.
another spike was observed at the time of the shock, at 06:00 UT on 10 November. During this enhancement pe-riod, particle fluxes in the 47–187 energy of keV ranges exhibited an increase by an order of magnitude of ∼101 particles/cm2/s/sr/MeV as compared to higher energy levels. 3.3.2 Interplanetary shock and geomagnetic storm A partial halo CME with a high speed of ∼1738 km/s was reported by LASCO at 22:50 UT. The CME driven interplan-etary shock (IPS) was observed at 06:05 UT on 10 Novem-ber at ACE. Figure 6 illustrates a prominent shock charac-terized by the abrupt increases in solar wind speed (Vsw)
from ∼630 km/s to about 850 km/s, proton density (Vp) from ∼7 protons cm−3to ∼20 protons cm−3and total interplane-tary magnetic field |B| from ∼9 nT to ∼25 nT. After 24 min of the IPS shock, a storm sudden commencement was ob-served at 06:29 UT, as recorded at Alibag (ABG), with a
0 20 40 n T |B| -20 0 20 n T By -20 0 n T Bz -100 0 n T Dst 0 6 12 18 0 6 12 18 0 6 12 18 UT (hr) -200 -100 0 100 n T ∆HABG 25-27 September 2001 SSC ABG-55 nT TIR-50 nT Shock
25 Sep. 26 Sep. 27 Sep.
400 600 800 km /s Vsw ∆HTIR
Fig. 8. From top to bottom: IMF |B|, IMF By, IMF Bz, solar wind
speed (Vsw), hourly averaged Dst index, 1-min digital magnetic data 1HABGand 1HTIRfor 25–27 September 2001. Red star (*) depicts local noon.
magnitude of 50 nT (bottom panel of Fig. 6) and of 93 nT at Tirunelveli (TIR). Local noon is shown by a red star in the figure. The interplanetary shock transit speed for this case was found to be 1040 km/s. The enhanced SSC ampli-tude at Tirunelveli is the influence of the local noon effect of the equatorial electrojet current. The correspondence in the main phase amplitude at TIR and ABG during local night conditions is perceptibly evident. The north-south compo-nent (Bz) of the interplanetary magnetic field was northward
at the shock time, but went over to a fluctuating IMF Bzwith
a dominantly southward directed condition after the shock passage. After the SSC at ground, the horizontal component of the geomagnetic field 1HABGstarted decreasing steadily
due to a ring current enhancement by the injection of low energy particles (47–187 keV), giving rise to a main phase with a magnitude of ∼176 nT. IMF Bz exhibited a
fluctuat-ing southward directed field, between the values of ∼+5 nT to ∼−15 nT, until a southward traversal occurred at 10:21 UT on 10 November. A noticeable feature observed in this case
was the persistence of the solar wind speed (Vsw) between
the values of 800 to 850 km/s, acquired at the shock pas-sage time for ∼22 h. Following this steady level another dis-tinct kink with Vsw, peaking to values of ∼950 km/s, was
noticed on 11 November at 04:09 UT, during the recovery phase of this storm. At the same time, some weak signatures of enhancements were also observed in the total interplane-tary field, |B|. The IMF Bz, however, was fluctuating from −3 nT to +5 nT in that period, thus curbing any significant geomagnetic activity.
3.4 Case 4: 24 September 2001 3.4.1 Solar conditions and proton flux
The active region 9632 located at 16◦south 23◦east on the solar disk produced an X-class solar flare of magnitude X2.6 on 24 September 2001 at 09:32 UT. The vertical dashed line marks the onset of the flare event (upper panel of Fig. 7). After about 37 min of solar flare maximum which occurred at 10:38 UT on 24 September, a proton event followed at 11:15 UT. In the higher energy ranges (0.31–6.03 MeV), higher orders (∼104particles/cm2/s/sr/MeV) of flux increase are seen compared to the low energy range (45–187 keV). Steady growth of the proton flux persisted for ∼32 h for all ranges, with another steep hike as observed at 19:25 UT on 25 September, due to the shock, followed by a gradual de-cay. Magnitude of this enhancement was higher in the 47– 187 keV range particle flux.
3.4.2 Interplanetary shock and geomagnetic storm The active Sun of 24 September 2001 produced a major solar flare and a subsequent proton shower, as explained in the sec-tion above. Associated with the solar flare on 24 September, a halo CME was recorded by LASCO/SOHO at 10:21 UT on same day, with a high speed of ∼2402 km/s. This Earth-directed CME led to an interplanetary (IP) shock which was observed by ACE at 20:00 UT on 25 September, as depicted in Fig. 8. At the shock passage time, the solar wind speed increased from ∼442 km/s to ∼748 km/s and the total IMF
|B| jumped from 7 nT to 32 nT. After about 27 min, this
inter-planetary shock, due to the fast halo CME, struck the magne-tosphere, resulting in a magnetopause compression that was marked by a storm sudden commencement (SSC) of ampli-tude 55 nT at Alibag and 50 nT at Tirunelveli at 20:27 UT on 25 September 2001. The storm occurred at local nighttime hours. After the shock (transit speed 920 km/s) impacted at the magnetosphere, the IMF Bzwas fluctuating from −25 nT
to +25 nT (Fig. 8). Subsequent to the storm sudden com-mencement for this storm event, an unsteady and very weak main phase developed (∼143 nT at Alibag), though the influx of high energy protons into the magnetosphere was plenty.
13 14 15 16 17 18 19 20 21 UT (hr) -400 -300 -200 -100 0 100 ∆ H (n T ) 1000 2000 3000 A E (n T ) -400 -200 0 ∆H (nT) 0 1000 2000 A E (n T ) 15 July 2000 Main Phase (1910-2134 UT)
ln(AE) = 0.003 * ∆H + 7.7 R=0.77 4 6 8 10 12 PCI 0 1000 2000 A E (n T ) SSC 15 July 2000 -60 -40 -20 0 20 40 B z(n T )
Fig. 9. Upper panel displays the correlations of the polar cap
magnetic activity (P C) index and low-latitude geomagnetic field
1HABG with auroral electrojet (AE) index for 15 July 2000 for “T 1” (19:10–21:34 UT) period. Bottom panel shows the variations of auroral electrojet index (AE) and horizontal component of geo-magnetic field at Alibag (1HABG) with corresponding interplane-tary magnetic field (IMF) north-south component Bz.
Table 1. The storm sudden commencement amplitude, main phase duration and main phase magnitude presented in the table are as
deter-mined from Alibag observatory records. Order of events is according to decreasing order of main phase magnitude for all cases. All the magnetic field measurements are given in nano Tesla (nT).
Datea SSC-amplitudeb T 1c MP-magnitude, Dstmind Statee Bzminf 14/07/2000 118 (15/1440 UT) 2.2 ∼–324, –301 Exists ∼–60
4/11/2001 76 (06/0153 UT) 1.1 ∼–279, –292 Exists ∼–80 8/11/2000 50 (10/0629 UT) 4.3 ∼–176, –96 No ∼–15 24/09/2001 55 (25/2027 UT) 3.1 ∼–143, –102 No ∼–21 aFirst column refers to the date of solar flare/coronal mass ejection occurrence.
bStorm sudden commencement amplitude (SSC-amp) recorded at Alibag and the date and time of SSC. cDuration of storm in hours between beginning of sharp depression in magnetic field (1H
ABG) and attainment of minimum value (“T1”). dMain phase magnitude (MP-mag) at Alibag along with minimum D
st(Dstmin) values attained. ePersistence of high proton flux post-shock duration.
fMinimum value of B
z(Bzmin).
4 Results
4.1 Proton flux characteristics and storm manifestation Acceleration of energetic particles at discontinuities in the interplanetary medium, such as the forward and reverse in-terplanetary shocks, leads to an enhancement of energetic particle flux (Mason et al., 1999; Reames, 1999). In the study of proton events done by Reames (1999), the type of events characterized by a hike near the shock passage time is classified as gradual. The four SEP events discussed in the current study exhibit a similar feature, as mentioned in the above reference, and hence can be sited as gradual solar en-ergetic particle events. The protons fed to the magnetosphere through the SEP events in the energy range of 47–187 keV, have been found to contribute substantially to the enhance-ment of the ring current, leading to the developenhance-ment of the main phase of magnetic storms. Recent work of Smith et al. (2004) has shown a good correspondence between dif-ferent threshold values of proton flux at low energy ranges and the storm intensity, using the Kp index during the
pe-riods of significant southward Bz. All four SEP events
dis-cussed here have maximum flux values of the order of >106 particles/cm2/s/sr/MeV for 47–187 keV energy ranges. Two intense SEP events of 14 July 2000 and 4 November 2001 are found to exhibit a peculiar pattern of broad maximum at flux magnitude >106particles/cm2/s/sr/MeV for all energy levels just after the shock for ∼4 h and ∼ 9 h, respectively (lower panels of Fig. 1 and Fig. 3). Both of these events were associated with intense magnetic storms. The observa-tion of persisting high proton fluxes at all energies after the shock passage may be one of the factors that can cause in-tense geomagnetic storms. Case studies presented here have clearly brought out the fact that SEP events with a persistence of high proton flux levels attained through acceleration by
shock waves can substantially contribute towards the inten-sity of the ensuing magnetic storms (July 2000 and Novem-ber 2001), unlike the SEP events having a rapid decay of high flux values after the shock (November 2000 and September 2001). Nevertheless, the role of interplanetary and solar wind parameters is to be taken into account for the intensity of storms. The association of SEP flux enhancement with coro-nal mass ejections and their geoeffectiveness has been dealt with in the recent works of Gleisner et al. (2006) and Smith et al. (2004), the latter suggested the existence of overlap-ping energetic ion enhancements (EIE) during a post shock period when a smaller EIE follows a larger one and a maxi-mum flux attained prevails for a longer duration, thus leading to the development of intense storms.
4.2 Interplanetary conditions and main phase development The interesting study of the correspondence between IMF pa-rameters and the intensity of geomagnetic storms has been done in detail for several decades. Burton et al. (1975) dis-cussed the significant role of southward interplanetary mag-netic fields with four geomagmag-netic storms using interplan-etary and solar wind data from Explorer 33 and 35, Dst
and AE indices. Later, Gonzalez and Tsurutani (1987) and Gosling et al. (1991) analyzed intense geomagnetic storms (Dst< −100 nT) for a period of 500 days and suggested
crit-ical values of IMF Bz(∼−10 nT) for a long duration (>3 h)
as an important interplanetary cause for intense geomag-netic storms. This crucial role of the southward interplane-tary magnetic field has been re-confirmed by Tsurutani et al. (1997), O’Brien et al. (2000) and Wang et al. (2003). In this work the existence of a threshold for IMF Bz was stressed
upon for the initiation and strengthening of the ring current. A significant increase in the ring current may not result even though IMF Bz, below threshold values, persists for a longer
1:00 1:30 2:00 2:30 UT (hr) -400 -300 -200 -100 0 100 ∆ H (n T ) 1000 2000 3000 A E (n T ) -400 -300 -200 -100 0 ∆H (nT) 0 1000 2000 3000 A E (n T ) 6 November 2001 Main Phase (0128-0241 UT)
ln(AE) = 0.01 * ∆H + 8.2 R=0.82 20 24 28 32 36 PCI 0 1000 2000 3000 A E (n T ) SSC -80 -60 -40 -20 0 B z (n T ) 6 November 2001
Fig. 10. Upper panel displays the correlations of polar cap magnetic
activity (P C) index and low-latitude geomagnetic field 1HABG with auroral electrojet (AE) index for 6 November 2001 for “T 1” (01:28-02:41 UT) period. Bottom panel shows the variations of auroral electrojet index (AE) and 1HABGwith corresponding IMF
Bz.
time. The four storm events under current study have been analyzed to bring out different evolution patterns of the main phase under varying interplanetary conditions. An important point to elucidate in the current study is that prior to the main
-150 -100 -50 0 50 ∆H (nT) 0 500 1000 1500 A E (n T ) -4 0 4 8 12 16 PCI 0 500 1000 1500 A E (n T ) 5 6 7 8 9 10 11 12 UT (hr) -200 -150 -100 -50 0 50 100 ∆ H (n T ) 0 500 1000 1500 A E (n T ) SSC 10nov 2000 Main Phase (0739-1204 UT)
-20 0 20 B z (n T ) 10 November 2000 R = 0.76 R = 0.46
Fig. 11. Upper panel displays the correlations of polar cap magnetic
activity (P C) index and low-latitude geomagnetic field 1HABG with auroral electrojet (AE) index for 10 November 200 for “T 1” (07:39–12:04 UT) period. Bottom panel shows the variations of AE index and 1HABGwith corresponding IMF Bz.
buildup of the storm, IMF Bzhad sustained southward
orien-tation for significant durations, with an average magnitude of ∼10 nT. Particularly for the intense events of 14–15 July 2000 and 4–6 November 2001, IMF Bz was southward for ∼8 h and ∼6 h, respectively, just before the shock impact on the magnetopause. Subsequently, the storm events of 15–16 July 2000 and 6–7 November 2001 are marked by prolonged and significantly large southward IMF Bzafter the shock,
re-sulting in the intense main phase development, whereas 8–10 November 2000 and 24–26 September 2001 are featured by a fluctuating Bz and a subdued intense main phase. Hence,
the above observations clearly bring out precursory condi-tions for the buildup of intense geomagnetic storms and can be stated as a smooth southward IMF Bzpersisting for long
duration prior to the shock impact and a continued south-ward orientation during the subsequent development of the storm are crucial factors for the buildup of intense geomag-netic storms. In the two intense event cases, the main phase
Fig. 12. Upper panel displays the correlations of polar cap magnetic
activity (P C) index and low-latitude geomagnetic field 1HABG with auroral electrojet (AE) index for 25 September 2001 for “T 1” (21:01–00:18 UT) period. Bottom panel shows the variations of AE index and 1HABGwith corresponding IMF Bz.
of the storm developed sharply and was followed by a rapid recovery, whereas in the weak events, the main phase devel-opment was a gradual process and decayed after a long time. Intricacies are associated with the manifestation and devel-opment of geomagnetic storms, as observed in the ground magnetic records following the unsteady conditions of the interplanetary parameters IMF By and Bz. The
differentiat-ing characteristics obtained by the current studies of the four SEPs are summarized in Table 1.
4.3 High-latitude low-latitude coupling process
The solar wind energy transferred into the magnetosphere, through the dominant mechanism of magnetic reconnection, is redistributed into different regions of the magnetosphere, owing to the varying interactions between energetic charged particles and ambient electric and magnetic fields, leading to the generation of various current systems. A fraction of this
4 5 6 7 8 9 10 11 12 13 0 500 1000 1500 2000 2500 PC AE(nT) 15 July 2000 (1910−0025 UT) −4500 −400 −350 −300 −250 −200 −150 −100 −50 500 1000 1500 2000 2500 ∆H(nT) AE(nT) AE = 120.04 (PC) − 185.15 R = 0.56 AE = −0.02 (∆H)2 + 11.5 (∆H) + 2504.7 R = 0.403
Fig. 13. For “T 2” duration (19:10–00:25 UT) for the 15 July 2000
storm event, correlations between polar cap (P C) index and auro-ral electrojet (AE) index are depicted in upper panel. Lower panel shows correlations between horizontal component of geomagnetic field at Alibag (1HABG) and AE index. Green colour symbols rep-resent correlations for AE values lying within 1500 nT and orange colour depicts correlations for AE values more than 1500 nT.
15 20 25 30 35 0 1000 2000 3000 4000 PC AE(nT) 6 November 2001 (0128−0500 UT) AE = 4.2 (PC)2 − 2.36.4 (PC) + 4285.3 R = 0.44 −3500 −300 −250 −200 −150 −100 −50 1000 2000 3000 4000 ∆H(nT) AE(nT)
Fig. 14. Illustrates correlations between P C and AE (upper panel)
and 1HABG and AE index (lower panel) during “T 2” period (01:28–05:00 UT) of the 6 November 2001 storm event. Green colour represents correlations for AE values lying within 2000 nT and orange colour depicts correlations for AE values more than 2000 nT.
energy is transferred to the high latitudes through charged particle precipitation. High-latitude magnetic field variations due to this energy transfer are defined by the auroral electro-jet (AE) index.
Criteria to express a well-defined correspondence between the high-latitude indices and the low-latitude geomagnetic field variations are discussed through Fig. 9 to Fig. 16. In
the case of events presented here, following the shock, the steady and sharp decrease in the H variation at Alibag com-menced in phase with the intense southward turning of IMF
Bz. Therefore, in current correlation analysis, the beginning
time for the correlation analysis is taken from the point where the actual depression in the ground magnetic data (H ) was recorded but the end times have been chosen under two cat-egories of time range. Time duration, defined as “T1”, cor-responds to the storm period from the onset of the actual de-pression in 1HABGto the time where the minimum value of 1HABG is attained. For respective storm events, the values
given in brackets specify “T1”, for example, 15 July 2000 (19:10–21:34 UT), 6 November 2001 (01:28–02:41 UT), 10 November 2000 (07:39–12:04 UT) and 25 September 2001 (21:01–00:18 UT). Figure 9 and Fig. 10 represent correla-tions obtained for the period of the main phase “T1” (shown by shaded portion) for the two intense events of 15 July 2000 (19:10–21:34 UT) and 6 November 2001 (01:28–02:41 UT), between low-latitude magnetic variations, polar cap mag-netic fields and auroral electrojets. Distinct scattered distri-butions are clearly seen between AE and P C indices in the both cases, as seen in the left sections of the upper panels (Fig. 9 and Fig. 10). AE and 1HABGfollow good
exponen-tial fits, describing an exponenexponen-tial decay of auroral activity with the buildup of the ring current with correlation coeffi-cients 0.77 and 0.82, respectively (right sections of the upper panels in Fig. 9 and Fig. 10). On the other hand, for the two weak storm events of 10 November 2000 and 25 September 2001, a clear scattering between the AE and P C indices and
1HABGis observed for the “T1” durations, 07:39–12:04 UT
and 21:01–00:18 UT respectively (top panels of Fig. 11 and Fig. 12). To summarize, a predominantly large correlation coefficient between the distinctly strong depression in the
1HABG and the auroral activity, as seen in the case of two
intense storm events, clearly explains the influence of the in-terplanetary conditions and persisting high flux on the low-latitude magnetic field variations. However, association be-tween auroral activity and polar cap field variations does not seem to follow any defined pattern for the time interval con-sidered.
The present work has brought out two classic examples of intense main phase storm events distinguished by varying in-terplanetary and the low-latitude ground magnetic fields. The event of 15 July 2000 is characterized by a 4 h 30 min long initial phase but with rapid fluctuations in IMF Bzand
low-latitude magnetic field at Alibag (1HABG) and Tirunelveli
(1HT I R). Correspondingly, during the same period the AE
index peaked to large values ∼3400 nT, though in an un-steady manner, and this can be attributed to the oscillations in IMF Bz, as clearly visible from the three lower panels of
Fig. 9. This result obtained for the 15 July 2000 event is in good conformity with a similar study carried out by Russell et al. (2000) for the case of 24 September 1998. Their work pointed out that there is an enhancement in activity of auro-ral electrojets during the oscillating IMF Bzperiods. In the
July 2000 event, the auroral electrojet index started decreas-ing just with the onset of the sharp main phase (19:25 UT, 15 July) when the IMF Bz became southward, as seen in
Fig. 9 (lower panel). A reasonable explanation for this ob-servation could be that before the buildup of the ring current, the energy transferred into the magnetosphere is utilized ex-clusively to maintain the auroral substorms and later the ring current energy is also supplied from the same reservoir, lead-ing to a decrease towards auroral electrojets. A noticeable feature seen for the 6 November 2001 storm is a sudden en-hancement in the AE index to values ∼3300 nT just at the time of the actual main phase onset, which corresponds to an increased southward magnitude of IMF Bz(bottom panel
in Fig. 10). The weak development of the main phase dur-ing the 10 November 2000 and 25 September 2001 events can be attributed to less energy input into the magnetosphere, as IMF Bzwas only −10 nT to +10 nT and was fluctuating,
and this produced an increase in the auroral index during the main phase (Fig. 11 and Fig. 12). This can also be explained in terms of energy input and redistribution into the magne-tosphere. In both the cases, the larger fraction of energy fed into the magnetosphere was extracted for auroral activ-ity; hence, a lesser portion was available for the ring current buildup, leading to only weak growth of the main phase. It is, however, not possible to estimate what fraction of input energy would go into auroral activity or into the ring current for any given interplanetary condition.
Investigations dealing with the association of the polar cap magnetic activity index (P C) with the auroral electrojet in-dex (AE) were carried out by Vassiliadis et al. (1996) and Troshichev et al. (2002). Their studies have shown the ex-istence of a good correlation between the P C index and the auroral electrojet (AE) indices, hence it was concluded that the relationship can be used for the specification of auroral geomagnetic activity and also for nowcasting the intensity of the auroral substorms. In order to examine the correspon-dence between the polar cap magnetic activity, auroral elec-trojet activity and ground signatures in a more defined man-ner, a different time interval “T2” is considered, which can be defined as the duration between the time at which the on-set of the depression of 1HABG was observed to the time
of the northward traversal of IMF Bz. For the respective
storms the “T2” durations are specified further: 15 July 2000 (19:10–00:25 UT), 6 November 2001 (01:28–05:00 UT), 10 November 2000 (07:39–12:05 UT) and 25 September 2001 (21:01–22:10 UT). In our results, for the July 2000 event, there exists a linear pattern (R=0.56) for the scatter between
P C and AE (Fig. 13), for AE values less than ∼1500 nT
(green symbols), above this range a clear scattering is seen (orange symbols in upper panel of Fig. 13). Similarly, for the intense events of November 2001 (Fig. 14), there exists a trend in the second order fit between P C and AE, until AE reached values of ∼2000 nT, whereas a scattered distribution for higher values of AE is seen, as depicted by green and orange symbols in the upper panel of Fig. 14, respectively.
The saturation feature for AE values observed in the July 2000 and November 2001 events is similar to the results ob-tained by Lu et al. (1998), where the cross polar cap poten-tial drop tends to saturate after AE exceeds about 1000 nT. On the other hand, for the weak storm events of 10 Novem-ber 2000 and 25 SeptemNovem-ber 2001, comparatively low auroral activity occurred during the “T2” period, with AE reaching only ∼1300 nT and ∼1700 nT, respectively (upper panels of Fig. 15 and Fig. 16). For intense storm events the correspon-dence between the AE and P C indices holds good until a threshold level.
The lower panels of Fig. 13 and Fig. 14 display the cor-relation between the geomagnetic field variations at Alibag (1HABG) and the auroral electrojet index (AE). A
sec-ond order fit trend with R=0.403, between 1HABGand AE,
seems to exist for storm event of 15 July 2000 (bottom panel of Fig. 13). For the 6 November 2001 event, there is a sud-den increase in AE until ∼3300 nT at the time of the main phase onset, as seen in the bottom panel of Fig. 14. Even for the slightly different main phase period considered for all events, it is found that in the storm event cases of 15 July 2000 and 6 November 2001, a common feature of the re-duction of the auroral electrojet index with the advancement of main phase of the storms stands out clearly (lower panels in Fig. 13 and Fig. 14). On the other hand, the two weak events of 10 November 2000 and 25 September 2001 are found to have increased in auroral activity with the progress of the storm main phase (“T2”). Particularly in the case of 10 November 2000, a significant correlation (R=0.77) between
1HABGand AE supports the above mentioned point.
5 Discussion and conclusions
Varying ranges of the storm intensity associated with the background proton events and interplanetary conditions are summarized as follows:
1) Investigations by Smith et al. (2004) and Gleisner and Watermann (2006) emphasized the discriminating contribu-tion of SEP flux characteristics to assess the geoeffective-ness of CMEs in producing strong magnetic storms. Our study shows that the SEP events with high flux levels or a “plateau” after the shock passage (i.e. 15 July 2000 and 6 November 2001) produce much more intense storms than the events where the SEP flux levels decrease after the shock pas-sage, i.e. 10 November 2000 and 25 September 2001, even when the maximum SEP flux achieved is similar. A probable explanation for this can be that during plateau SEP events, the magnetotail become pre-populated with large fluxes of energetic particles due to the dayside magnetic reconnection. Subsequent injecting of these energetic particles to the inner magnetosphere produces an intense ring current, leading to high |Dst|values.
2) For both 15 July 2000 and 6 November 2001 SEP events
−2 0 2 4 6 8 10 12 14 0 500 1000 1500 PC AE(nT) 10 November 2000 (0739−1205 UT) −140 −120 −100 −80 −60 −40 −20 0 20 40 0 500 1000 1500 ∆H(nT) AE(nT) AE = 46.2 (PC) + 404.1 R = 0.44 AE = 0.04 (∆H)2 + 0.7 (∆H) + 462.9 R = 0.77
Fig. 15. Correlations between P C and AE (upper panel) and
1HABGand AE index (lower panel) during “T 2” period (07:39-12:05 UT) of the 10 November 2000 storm event.
−2 −1 0 1 2 3 4 5 6 500 1000 1500 PC AE(nT) 25 September 2001 (2101−2210 UT) −100 −80 −60 −40 −20 0 20 400 600 800 1000 1200 1400 ∆H(nT) AE(nT)
Fig. 16. Correlations between P C and AE (upper panel) and
1HABGand AE index (lower panel) during “T 2” period (21:01-22:10 UT) of the 25 September 2001 storm event.
with high flux levels, during the main phase of the ensuing geomagnetic storms, the AE index decreased as the main phase developed. The converse was true for the SEP events where the flux level decreased after the shock (10 November 2000 and 25 September 2001).
3) For the two intense SEP events, a definite correlation pat-tern between the AE index and P C index was found when the AE index was below some threshold value. Above this threshold value, there is a large scatter and the correlation is poor.
4) A summary plot showing the effect of the duration of the southward IMF Bzjust before the shock impingement on the
development of magnetic storms for all four events is given in Fig. 17. To delineate the storm intensities corresponding
-10 -8 -6 -4 -2 0 2 Pre-shock southward Bz(hrs) -500 -400 -300 -200 -100 ∆ HA B Gm in (n T ) Nov00 Sep01 -400 -300 -200 -100 0 D s t m in (n T ) Nov01 Jul00 * Dst " ∆Η TS (Time of Shock)
Fig. 17. Illustrates correspondence of 1HABG minimum (filled
“+” signs) with a duration of southward Bzbefore shock and Dst min (filled square symbols) for four SEP events. “TS” indicates the shock time. The pre-shock hours with southward IMF Bz are marked with respect to the shock time. Red colour symbols depict two intense main phase events of July 2000 and November 2001. For intensity of these storms, see the degree of depression in the Alibag magnetic field and high level of auroral activity. Weak main phase events of November 2000 and September 2001 have been shown by blue symbols. These two cases can be identified by lower values of 1HABGminimum and AE values.
to the duration of southward Bzprior to storm onset, Alibag
magnetic variations (1HABG), as well as the Dst index, are
depicted against the duration of pre-shock negative Bz for
the four events examined. Red symbols indicated in the fig-ure are for the intense storms of 15 July 2000 and 6 Novem-ber 2001. Extended durations (∼ 8 h and ∼6 h , respectively) of pre-shock Bzis evident for the two storms in contrast to
the negligibly low pre-shock conditions of Bz for the other
two events. “TS” against “0” hr time is the shock time, with respect to which the negative Bz is considered. This result
could well be used to explain the precursory signature for the intense storm phenomena.
The conclusions from the present study are drawn from a limited number of events only. Examination of a greater number of events will certainly extend support to the validity of our conclusions concretely.
Acknowledgements. The authors are thankful to CELIAS/MTOF
experiment on the Solar Heliospheric Observatory (SOHO) space-craft for providing the solar wind and the interplanetary data. SOHO is a joint European Space Agency (ESA) and United States National Aeronautics and Space Administration (NASA) mission. We thank ACE SWEPAM instrument team and the ACE Science Center for providing the interplanetary data. We are also thankful to WIND instrument team for interplanetary data. We acknowl-edge WDC, Kyoto for providing the AE and Dstindices. We also thank NASA website from where coronal mass ejection
informa-tion was extracted. This CME catalog is generated and maintained by NASA and The Catholic University of America in cooperation with the Naval Research Laboratory. SOHO is a project of interna-tional cooperation between ESA and NASA. G. S. Lakhina would like to thank H. Matsumoto and Y. Omura for their kind hospitality at Research Institute for Sustainable Humanosphere, where a part of this work was done. G. S. Lakhina thanks the Council of Sci-entific and Industrial Research, Government of India, for providing support under Emeritus scientist scheme.
Topical Editor B. Forsyth thanks C. Cid and another referee for their help in evaluating this paper.
References
Akasofu, S.-I.: Energy coupling between the solar wind and the magnetosphere, Space Sci. Rev., 28, 121–190, 1981.
Bartels, J., Heck, N. H., and Johnston, H. F.: The three-hour-range index measuring geomagnetic activity, J. Geophys. Res., 44, 411–454, 1939.
Baumjohann, W., Kamide, Y., and Nakamura, R.: Substorms, storms and the near-Earth tail, J. Geomagn. Geoelect., 48, 177– 185, 1996.
Burton, R. K., McPherron, R. L., and Russell, C. T.: An empirical relationship between interplanetary conditions and Dst, J. Geo-phys. Res., 80, 4204–4214, 1975.
Cane, H. V., McGuire, R. E., and von Rosenvinge, T. T.: Two classes of solar energetic particle events associated with impul-sive and long duration soft x-ray flares, Astrophys. J., 301, 448– 459, 1986.
Cane, H. V., Reames, D. V., and von Rosenvinge, T. T.: The role of interplanetary shocks in the longitude distribution of solar ener-getic particles, J. Geophys. Res., 93, 9555–9567, 1988. Cliver, E. W., Kahler, S. W., and McIntosh, P. S.: Solar proton flares
with weak impulsive phases, Astrophys. J., 264, 699–707, 1983. Davis, T. N., and Sugiura, M.: Auroral electrojet activity index AE and its universal time variations, J. Geophys. Res., 71, 785–801, 1966.
Dungey, J. W.: Interplanetary magnetic field and the auroral zones, Phys. Rev. Lett., 6, 47–48, 1961.
Feldstein, Y. I., Dremukhina, L. A., Levitin, A. E., Mall, U., Alex-eev, I. I., and Kalegaev, V. V.: Energetics of the magnetosphere during the magnetic storm, J. Atmos. Sol. Terr. Phys., 65, 429– 446, 2003.
Forbush, S. E.: Three unusual cosmic-ray increases possibly due to charged particles from the Sun, Phys. Rev., 70, 771–772, 1946. Gleisner, H. and J. Watermann: Solar energetic particle
flux enhancement as an indicator of halo coronal mass ejection geoeffectiveness, Space Weather, 4, S06006, doi:10.1029/2006SW000220, 2006.
Gonzalez, W. D. mand Tsurutani, B. T.: Criteria of interplanetary parameters causing intense magnetic storms (Dst<−100 nT), Planet. Space, Sci., 35, 1101–1109, 1987.
Gonzalez, W. D., Joselyn, J. A., Kamide. Y., Kroehl, H. W., Ros-toker, G., Tsurutani, B. T., and Vasyliunas, V. M.: What is a geomagnetic storm?, J. Geophys. Res., 99, 5771–5792, 1994. Gonzalez, W. D., Tsurutani, B. T., and Cla de Gonzalez, A. L.:
Interplanetary origin of geomagnetic storms, Space Sci. Rev., 88, 529–562, 1999.
Gonzalez, W. D., Gonzalez, A. L. C., Sobral, J. H. A., Dal Lago, A., Vieira, L. E.: Solar and interplanetary causes of very intense geomagnetic storms, J. Atmos. Sol. Terr. Phys., 63, 403–412, 2001.
Gosling, J. T., McComas, D. J., Phillips, J. L., and Bame, S. J.: Geo-magnetic activity associated with Earth passage of interplanetary shock disturbances and coronal mass ejections, J. Geophys. Res., 96, 7831–7839, 1991.
Kahler, S. W., Cliver, E. W., Cane, H. V., McGuire, R. E., Stone, R. G., and Sheely, N. R.: Solar filament eruptions and energetic particle events, Astrophys. J., 302, 504–510, 1986.
Kahler, S. W.: Ann. Rev. Astron. Astrophys., 30, 113–141, 1992. Lu, G., Baker, D. N., McPherron, R. L., et al.: Global energy
depo-sition during the January 1997 magnetic cloud event, J. Geophys. Res., 103, 11 685–11 694, 1998.
Mason, G. M. and Sanderson T. R.: CIR associated energetic par-ticles in the inner and middle heliosphere, Space Sci. Rev., 89, 77–90, 1999.
O’Brien, T. P. and McPherron, R. L.: An empirical phase space analysis of ring current dynamics: Solar wind control of injection and decay, J. Geophys. Res., 105, 7701–7719, 2000.
Reames, D. V.: Space Sci. Rev., 90, 413–491, 1999.
Russell, C. T., Lu, G., and Luhmann, J. G.: Lessons from the ring current injection during the September 24, 25, 1998 storm, Geo-phys. Res. Lett., 27, 1371–1374, 2000.
Shea, M. A. and Smart, D. F.: Relativistic solar proton events- evi-dence for a dual-stage injection scenario, Proc. 3rd. SOLar con-nection with Transient Interplanetary Phenomena Symposium, 467–474, 1998.
Singer, S. F.: A new model of magnetic storms and aurorae, Eos Trans. AGU, 38, 175–190, 1957.
Smith, Z., Murtagh, W., and Smithtro, C.: Relationship be-tween solar wind low-energy energetic ion enhancements and large geomagnetic storms, J. Geophys. Res., 109, A01110, doi:10.1029/2003JA010044, 2004.
Sugiura, M. and Chapman, S.: The average morphology of geo-magnetic storms with sudden commencement, Abh. Akad. Wiss. G¨ottingen, Math.-phys., Kl., Sonderheft, Spec. Issue 4, 3–53, 1960.
Sugiura, M.: Hourly values of equatorial Dst for IGY, Annals of the International Geophysical Year, Pergamon Press, Oxford, 35, 945–948, 1964.
Takalo, J. and Timonen, J.: On the relation of the AE and P C indices, J. Geophys. Res., 103, 29 393–29 398, 1998.
Troshichev, O. A., Dmitrieva, N. P., and Kuznetsov, B. M.: Po-lar cap magnetic activity as signature of substorm development, Planet. Space Sci., 27, 217–221, 1979.
Troshichev, O. A., Andrezen, V. G., Vennerstrm, S., and Friis-Christensen, E.: Magnetic activity in the polar cap – A new in-dex, Planet. Space Sci., 36, 1095–1102, 1988.
Troshichev, O. A. and Lukianova, R. Yu.: Relation of P C index to the solar wind parameters and substorm activity in time of magnetic storms, J. Atmos. Sol. Terr. Phys., 64, 585–591, 2002. Tsurutani, B. T. and Gonzalez, W. D.: The interplanetary causes
of magnetic storms: A review, in Magnetic Storms, Geophys. Monogr. Ser., vol. 98, edited by: B. T. Tsurutani, W. D. Gonza-lez, Y. Kamide and J. K. Arballo, 77–89, AGU, Washington, D. C., 1997
Vassiliadis, D., Angelopoulos, V., Baker, D. N., and Klimas, A. J.: The relation between the northern polar cap and auroral electrojet geomagnetic indices in the wintertime, Geophys. Res. Lett., 23, 2781–2784, 1996.
Vennerstroem, S. and Friis-Christensen, E.: Comparison between the polar cap, P C, and the auroral electrojet indicex AE, AL and AU, J. Geophys. Res., 96 (A1), 101–113, 1991.
Wang, C. L., Shen, C. L., Wang, S., and Ye, P. Z.: An empirical formula relating the geomagnetic storm’s intensity to the inter-planetary parameters: -V Bz and 1t, Geophys. Res. Lett., 30, 2039–2042, 2003.
Zhang, M., Golub L., Deluca, E., and Burkepile, J.: The timing of flares associated with the two dynamical types of solar coronal mass ejections, Astrophys. J., 574, L97–L100, 2002.