HAL Id: hal-00318151
https://hal.archives-ouvertes.fr/hal-00318151
Submitted on 13 Sep 2006
HAL is a multi-disciplinary open access
archive for the deposit and dissemination of
sci-entific research documents, whether they are
pub-lished or not. The documents may come from
teaching and research institutions in France or
abroad, or from public or private research centers.
L’archive ouverte pluridisciplinaire HAL, est
destinée au dépôt et à la diffusion de documents
scientifiques de niveau recherche, publiés ou non,
émanant des établissements d’enseignement et de
recherche français ou étrangers, des laboratoires
publics ou privés.
data observed at Brazilian low latitude stations
F. Bertoni, Y. Sahai, W. L. C. Lima, P. R. Fagundes, V. G. Pillat, F.
Becker-Guedes, J. R. Abalde
To cite this version:
F. Bertoni, Y. Sahai, W. L. C. Lima, P. R. Fagundes, V. G. Pillat, et al.. IRI-2001 model predictions
compared with ionospheric data observed at Brazilian low latitude stations. Annales Geophysicae,
European Geosciences Union, 2006, 24 (8), pp.2191-2200. �hal-00318151�
Ann. Geophys., 24, 2191–2200, 2006 www.ann-geophys.net/24/2191/2006/ © European Geosciences Union 2006
Annales
Geophysicae
IRI-2001 model predictions compared with ionospheric data
observed at Brazilian low latitude stations
F. Bertoni1, Y. Sahai2, W. L. C. Lima1, P. R. Fagundes2, V. G. Pillat2, F. Becker-Guedes2, and J. R. Abalde2 1Centro Universit´ario Luterano de Palmas (CEULP/ULBRA), Palmas, Tocantins, Brazil
2Universidade do Vale do Para´ıba (UNIVAP), S˜ao Jos´e dos Campos, S˜ao Paulo, Brazil
Received: 31 March 2006 – Revised: 4 July 2006 – Accepted: 19 July 2006 – Published: 13 September 2006
Abstract. In this work, the F-region critical frequency (foF2) and peak height (hmF2) measured by digital ionoson-des at two Brazilian low-latitude stations, namely Palmas (10.17◦S, 48.20◦W, dip –10.80◦) and S˜ao Jos´e dos Cam-pos (23.20◦S, 45.86◦W, dip –38.41◦), are compared with the IRI-2001 model predictions. The comparison at the lat-ter station shows quite a reasonable agreement for both pa-rameters. The former station exhibits a better agreement for hmF2 than for foF2. In general, the model generates good results, although some improvements are still necessary to implement in order to obtain better simulations for equato-rial ionospheric regions.
Keywords. Ionosphere (Equatorial ionosphere; Modeling and forecasting; Instruments and techniques)
1 Introduction
A large number of papers deal with the comparisons between observed ionospheric data and the International Reference Ionosphere (IRI) model predictions (e.g. Abdu et al., 1996; Batista et al., 1996; Souza et al., 2003; Sethi et al., 2004; Batista and Abdu, 2004). It is well known that IRI is an empirical ionospheric model based on experimental observa-tions of the ionospheric plasma either by ground or in-situ measurements. The main purpose of IRI is to provide re-liable ionospheric densities, composition and temperatures (e.g. Bilitza, 2001; Bilitza et al., 1979). Two different com-puter programs have been used as sub-routines by IRI: one is called the CCIR model, which was developed by Comit´e Consultatif International des Radiocommunications (CCIR, 1967 and 1991); and the other is the URSI model, which was developed by Union Radio-Scientifique Internationale (URSI) (Rush et al., 1983, 1984, 1989; Fox and
McNa-Correspondence to: F. Bertoni
(bertoni@ulbra-to.br)
mara, 1988). These two models (CCIR and URSI) use all the compiled observational data (foF2, hmF2 and M(3000)F2), and generate numerical maps (or numerical coefficient maps) through the application of Fourier and Legendre series, pro-viding values for the variation of the ionospheric parame-ters for IRI. A joint task group of URSI and COSPAR reg-ularly update their numerical maps and coefficients as new data input is processed and added to the database and conse-quently a newer version of the IRI model, containing updated CCIR and URSI sub-routines, is released approximately ev-ery five years. As a result of this update and because we have compared foF2 and hmF2 ionospheric parameters in this pa-per, and not the ionospheric plasma densities, composition or temperatures, we have adopted the nomenclature CCIR and URSI IRI-2001, in order to refer to these two different models. All comparative studies give feedback for new im-provements of CCIR and URSI IRI models.
Data recorded by two digital ionosondes (Canadian Ad-vanced Digital Ionosondes (CADIs) (Grant et al., 1995) located at low-latitude Brazilian stations, namely Palmas (10.17◦S, 48.20◦W, dip −10.80◦, hereafter called PAL) and S˜ao Jos´e dos Campos (23.20◦S, 45.86◦W, dip −38.41◦, hereafter called SJC), were analyzed and compared with IRI-2001 predictions. PAL is located near the equatorial ion-ization anomaly (EIA) trough, while SJC is under its crest. Therefore, the studies presented in this work are interesting as they provide a comparison of the seasonal patterns of the ionospheric parameters obtained in the ionospheric anomaly region in the Brazilian sector and IRI-2001 model predic-tions.
2 Results and discussions
We have considered the observations taken in the months of July 2003, October 2003, January 2004 and April 2004 as representatives of the Southern Hemisphere winter, spring,
Table 1. Selected geomagnetically quiet days for different months with solar and geophysical indices. Month Year July 2003 Day 8 9 10 21 22 IG12 Rz12 F10.7 135.7 130.7 126.9 160.7 157.4 74 61.8 Oct 2003 Day 2 4 5 8 23 IG12 Rz12 F10.7 125.0 119.0 109.6 113.1 181.3 63.1 58.2 Jan 2004 Day 8 12 14 29 31 IG12 Rz12 F10.7 116.1 114.4 117.1 84.8 91.6 57.4 52 April 2004 Day 1 2 20 22 29 IG12 Rz12 F10.7 112.6 108.1 111.8 118.4 89.8 54.1 45.5
Sources: ftp://ftp.ngdc.noaa.gov/STP/SOLAR DATA/SOLAR RADIO/FLUX/DAILYPLT.ADJ, ftp://nssdcftp.gsfc.nasa.gov/models/ionospheric/iri/iri2001/fortran code/
summer and autumn seasons, respectively. Five magnetically quiet days of each of those months were selected, according to the availability of the observational data at the two sta-tions. Ionograms were recorded every 5 min on a routine basis. Ionospheric F-region parameters such as the critical frequency (foF2), minimum virtual height (h0F), true height of the electron density peak (hmF2), and virtual height at a frequency of 83.4% of foF2 (hpF2 – an estimate of the true height density peak) were scaled and averaged for the 5-selected days during each month (representing a particular season). The scaling of ionograms used the software devel-oped at Universidade do Vale do Para´ıba (UNIVAP) called the UNIVAP Digital Ionosonde Data Analysis (UDIDA) (Fa-gundes et al., 2005). The digital ionospheric data registered by the CADIs are displayed on a PC monitor screen for scal-ing of ionograms. The measurement accuracies usscal-ing this system are about ±3 km for the virtual height determina-tion and about ±0.1 MHz for the F-region critical frequency (foF2). However, sometimes the ionogram trace needs ex-trapolation to determine the virtual height and/or the criti-cal frequency. In this case, the measurement accuracies are less and are of the order of ±6 km for the virtual height and
±1.0 MHz for the critical frequency.
Solar activity was high to moderate, on the selected days. Table 1 shows solar flux and also the 12-month smoothed val-ues of the Ionospheric Global (IG12)and the sunspot number (Rz12)indices.
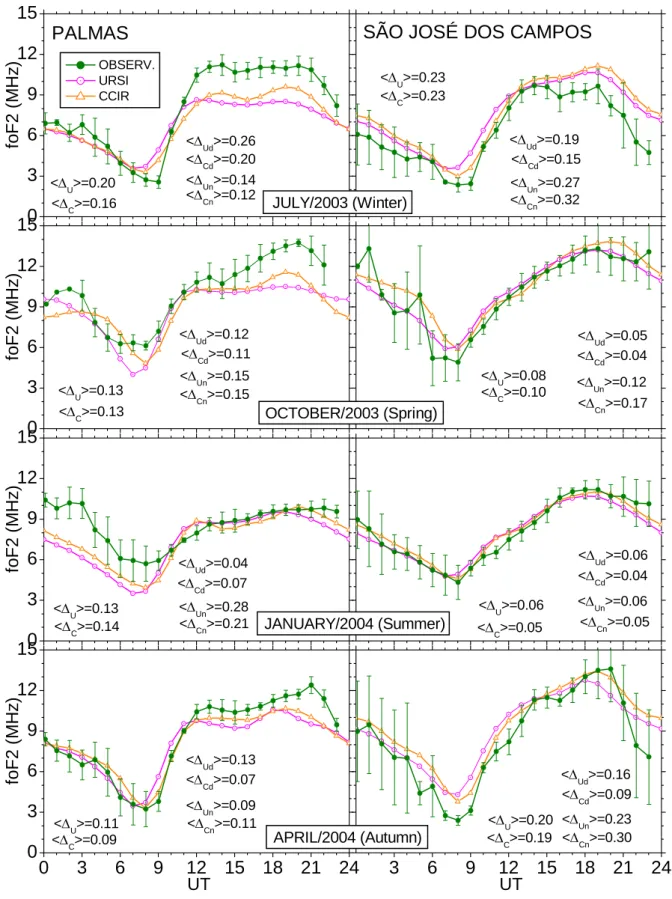
Figure 1a shows the diurnal variations for the different sea-sons of the observed and IRI-2001 predicted (using both the URSI and CCIR coefficients) foF2 values. The observed and modeled results for PAL are shown on the left hand side, while SJC is on the right-hand side. The observed foF2 mean value curves are shown with standard deviation bars. The
method of pure visualization of different curves plotted in a figure is sometimes not enough to make a good analysis. So, we applied a criterion called “relative deviation module mean” (rdmm), used by Bertoni (2004), in order to quantify the agreement/disagreement between the observed and mod-eled curves, and which is calculated according to the follow-ing expression: h1i = 1 N N X i=1 xio−xim xio , (1)
where xioand ximrepresent observed and modeled values, re-spectively, and N is the number of terms. This is a useful method to systemize the analysis of the results. We estab-lish two range times for each of the means: 09:00–21:00 UT (daytime; LT=UT−3 h) and 21:00–09:00 UT (nighttime; LT=UT−3 h). In this way, we can have a good estimate of the model performance for the day and night periods. We define
h1Ciand h1Uifor CCIR and URSI numerical maps, respec-tively, representing the total rdmm for that month, as well as, h1Cdi, h1Cni, h1U di, and h1U ni for CCIR/URSI day-time/nighttime periods. According to Bertoni (2004), model-ing generally exhibits a reasonable to good agreement when, besides visually, the rdmm reaches values equal to or less than 0.06, and a reasonable to poor agreement for higher val-ues.
From Fig. 1a, left panel, for the location of PAL, IRI-2001 predictions of foF2 generally exhibit a reasonable to poor agreement. The averaged rdmms of all of the means have val-ues higher than 0.06. It is observed that the best result relates to the simulation in the month of April 2004, where the total rdmm reached values of 0.11 (URSI) and 0.09 (CCIR). Sim-ulations for the months of October 2003 and January 2004
F. Bertoni et al.: IRI-2001 model predictions compared with ionospheric data 2193
0
3
6
9
12
15
0
3
6
9
12
15
0
3
6
9
12
15
3
6
9
12
15
18
21
24
0
3
6
9
12
15
18
21
24
0
3
6
9
12
15
<∆Cn>=0.32 <∆ Un>=0.27 <∆Cd>=0.15 <∆ Ud>=0.19 <∆C>=0.23 <∆ U>=0.23SÃO JOSÉ DOS CAMPOS
<∆Cn>=0.12 <∆Un>=0.14 <∆Cd>=0.20 <∆Ud>=0.26 <∆ C>=0.16 <∆U>=0.20 OBSERV. URSI CCIR JULY/2003 (Winter)
PALMAS
fo
F
2
(
M
H
z
)
<∆ Cn>=0.17 <∆ Un>=0.12 <∆Cd>=0.04 <∆Ud>=0.05 <∆ C>=0.10 <∆U>=0.08 <∆U>=0.13 <∆ Cn>=0.15 <∆Un>=0.15 <∆Cd>=0.11 <∆ Ud>=0.12 <∆C>=0.13 OCTOBER/2003 (Spring)fo
F
2
(
M
H
z
)
<∆Cn>=0.05 <∆Un>=0.06 <∆ Cd>=0.04 <∆Ud>=0.06 <∆U>=0.06 <∆ C>=0.05 <∆ Cn>=0.21 <∆ Un>=0.28 <∆Cd>=0.07 <∆Ud>=0.04 <∆ C>=0.14 <∆ U>=0.13 JANUARY/2004 (Summer)fo
F
2
(
M
H
z
)
<∆Cn>=0.30 <∆ Un>=0.23 <∆ Cd>=0.09 <∆ Ud>=0.16 <∆C>=0.19 <∆U>=0.20UT
<∆ Cn>=0.11 <∆ Un>=0.09 <∆Cd>=0.07 <∆Ud>=0.13 <∆C>=0.09 <∆U>=0.11 APRIL/2004 (Autumn)fo
F
2
(
M
H
z
)
UT
330
331
332
333
Figure 1a. Plots of the observed average ionospheric parameter foF2 variations for different
seasons at the Brazilian stations of Palmas and São José dos Campos. The IRI-2001 model
curves, using both URSI and CCIR coefficients, for different seasons are also shown along with
the relative deviation module mean (rdmm),
∆ , for URSI (U) and CCIR (C), as well as,
daytime (d) and nighttime (n) rdmms.
334
335
14
Fig. 1a. Plots of the observed average ionospheric parameter foF2 variations for different seasons at the Brazilian stations of Palmas and S˜ao
Jos´e dos Campos. The IRI-2001 model curves, using both URSI and CCIR coefficients, for different seasons are also shown along, with the relative deviation module mean (rdmm), h1i, for URSI (U) and CCIR (C), as well as daytime (d) and nighttime (n) rdmms.
-60
-40
-20
0
20
40
60
80
-60
-40
-20
0
20
40
60
80
-60
-40
-20
0
20
40
60
80
3
6
9
12
15
18
21
24
0
3
6
9
12
15
18
21
24
-60
-40
-20
0
20
40
60
80
SÃO JOSÉ DOS CAMPOS
URSI CCIR JULY/2003 (Winter)
PALMAS
OCTOBER/2003 (Spring) JANUARY/2004 (Summer)UT
(%)
foF2 percent deviation
APRIL/2004 (Autumn)
UT
336
337
338
339
Figure 1b. Plots of the percent deviation between the IRI (CCIR and URSI) model results and the
observed values of the F-region critical frequency (foF2) as a function of time of the day and
season at the stations PAL (left hand side panels) and SJC (right hand side panels).
15
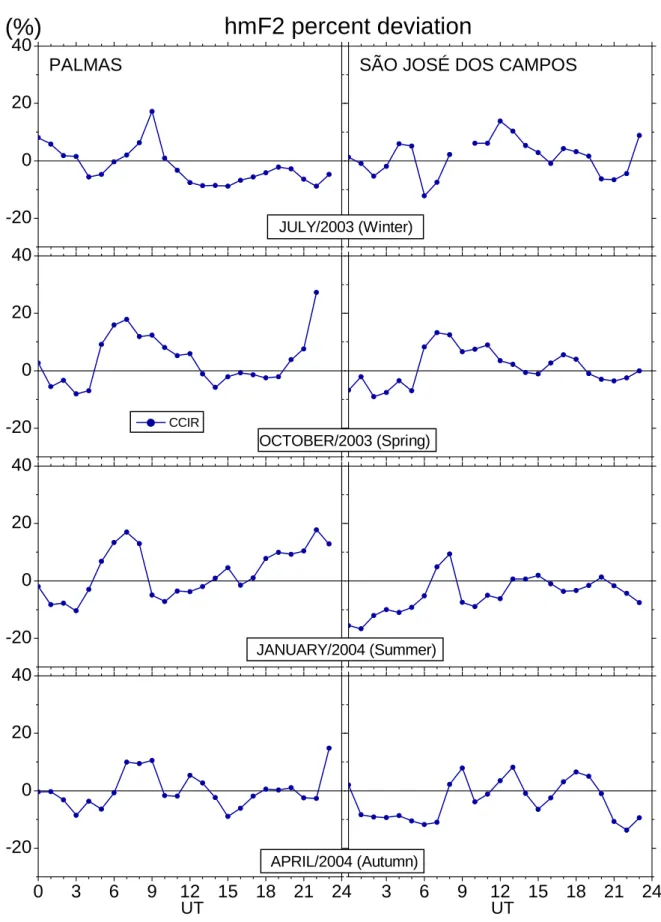
Fig. 1b. Plots of the percent deviation between the IRI (CCIR and URSI) model results and the observed values of the F-region critical
frequency (foF2) as a function of time of the day and season at the stations PAL (left-hand side panels) and SJC (right-hand side panels).
F. Bertoni et al.: IRI-2001 model predictions compared with ionospheric data 2195 have practically the same results viz. 0.13 for either URSI
or CCIR. Simulations for the month of July 2003 have total rdmm of 0.20 (URSI) and 0.16 (CCIR). Regarding the day-time/nighttime rdmms, the best agreement occurred for the month of January 2004, where the daytime rdmm reached 0.04 (URSI) and 0.09 (CCIR), however, the nighttime rdmm for that month exhibit higher values, indicating a disagree-ment between the observed and modeled curves. The occur-rence of Spread-F, during October 2003, contaminated the measured foF2, between 23:00 and 03:00 UT.
Figure 1b shows the percent deviation between the IRI (CCIR and URSI) model results and the observed values of the F-region critical frequency (foF2), as a function of time of day and season at the stations PAL (left-hand side panels) and SJC (right-hand side panels), according to the following equation:
σrel=
xio−xim
xim ×100 , (2)
where xioand ximrepresent the observed and modeled values, respectively. Regarding the results for the station PAL, one can notice positive differences (the model underestimates the foF2 values) along almost the whole 24 h for the months of October 2003 and January 2004. For the months of July 2003 and April 2004, besides the positive differences (the model underestimates the foF2 values) mainly between 12:00 and 24:00 UT, negative differences (the model overestimates the foF2 values) between 06:00 and 10:00 UT (July) and be-tween 00:00 and 12:00 UT (April) are observed. For the station SJC, negative differences for almost the whole 24 h can be observed for the months of July 2003 and April 2004. The best results are achieved for the month of January 2004 and October 2003. Comparing the results for these two sta-tions, the models provide better results for SJC.
It should be mentioned that Batista and Abdu (2004), in a similar comparative study between the observed and IRI modeled ionospheric parameters, pointed out that, for a high solar activity period, there is a good agreement between the IRI predictions and observed mean foF2, for the Brazilian equatorial station of S˜ao Lu´ıs (2.6◦S, 44.2◦W, dip −0.5◦), during the daytime. However, the authors pointed out that the F-layer critical frequency (foF2) after sunset is overesti-mated for the equatorial station S˜ao Lu´ıs. Our results gener-ally show that the parameter foF2 is underestimated, during the daytime and nighttime, for the station PAL, which is not so close to the magnetic equator as S˜ao Lu´ıs.
Bittencourt and Chryssafidis (1994) also carried out com-parative studies between the CCIR IRI predictions and ob-served data. The authors pointed out that the obob-served F-region peak electron densities, at the low-latitude station of Fortaleza (3.8◦S, 38◦W, dip −12◦), were higher than those predicted by CCIR IRI, during the representative winter and spring months (June and September, respectively), for high solar activity. Regarding the comparison of the observations
at PAL, CCIR and URSI IRI-2001 predictions usually under-estimate the foF2 values, during most of the day, generally from 10:00 to 24:00 UT.
Figure 1a shows that observed data, and the CCIR and URSI IRI-2001 predicted values of foF2 are quite reasonable for SJC, compared to PAL, for the months of October 2003 and January 2004, Southern Hemisphere spring and summer periods, respectively, since the daily rdmm has values of 0.10 (CCIR) and 0.08 (URSI) for spring, and 0.05 (CCIR) and 0.06 (URSI) for summer. The IRI-2001 predictions show less agreement with the observed values of foF2 for the months of July 2003 and April 2004. The agreement is slightly bet-ter in April 2004 (0.19 (CCIR)) and (0.20 (URSI)) than July 2003 (0.23 for both CCIR and URSI). Also, it is observed that the results of the model have better agreement during the daytime for all the months. The best agreement between the observed and predicted values, during either the daytime or nighttime, is for the month of January 2004. It is interesting to note that, although the model curves sometimes, depart from the observed averaged curves, they usually lie within the standard deviation bars. In other words, this is a good in-dication that the CCIR and URSI IRI-2001 models generate data within the characteristic variability of the F-region over the location of SJC.
Batista and Abdu (2004) show that, for the station Ca-choeira Paulista (near the equatorial ionization anomaly crest, like SJC), the parameter foF2 is generally in good agreement. Our results present the same trends for the station SJC, which is near Cachoeira Paulista. In addition, Batista and Abdu (2004) show that IRI/URSI overestimates the val-ues of foF2 compared to the measurements, around 9 UT, during the months of April and July.
Figures 1a and b also show that the CCIR and URSI IRI-2001 modeled curves exhibit a reasonable agreement be-tween them. CCIR has some advantage over URSI for both locations, since the CCIR rdmm values are lower than those presented by URSI.
We have applied the POLAN ionogram inversion tech-nique (Titheridge, 1985), in order to obtain hmF2 values for the days selected from PAL and SJC. In the present study, POLAN was run under the software UDIDA (Fagundes et al., 2005), to obtain the true height electron density profiles by conveniently choosing points in the ionograms. The pro-files were calculated on an hourly basis. Figure 2a shows the plots of hmF2 values simulated by IRI-2001 and derived from POLAN. The PAL hmF2 data are on the left side and SJC hmF2 data on the right side. Only the CCIR numerical map provides values of hmF2. Using the same criterion of the rdmm as mentioned earlier, it is noted that in five out of eight simulations presented, the observed hmF2 values ex-hibit <1> equal to or less than 0.06, which is indicative of a good agreement between the observed and modeled values. However, it is necessary to highlight some additional points. Comparisons at PAL exhibit a good agreement for the sea-sons represented by the months of July 2003, January and
April 2004. April 2004 shows the best comparative results for that parameter. In terms of daytime/nighttime rdmm, two simulations have better results for daytime (October 2003 and April 2004) and two for nighttime (July 2003 and Jan-uary 2004). In other words, PAL daytime simulations exhib-ited better results for both the autumn and spring seasons, and nighttime simulations for the winter and summer. The pre-reversal peak of the vertical ionospheric drift, near the magnetic equator, which is directly evidenced by the hmF2 increase (Fig. 2a), usually around 21:00 UT, is not well sim-ulated by IRI-2001. In other words, CCIR IRI-2001, in the equatorial ionospheric region, around the sunset hours, un-derestimates hmF2. Regarding the SJC modeling results, CCIR IRI-2001 provided good simulations for July and Oc-tober 2003, according to rdmm criterion, although visual analysis points out that the best result was reached for the latter month. SJC daytime simulations have presented better results than the nighttime simulations for the three seasons represented by the months October 2003, January and April 2004. Comparing PAL and SJC IRI-2001 simulations of the hmF2 parameter, two of them are better for PAL (January and April 2004) and two are better for SJC (July and October 2003). Figure 2a also shows that, around sunrise hours, there is another increase in the hmF2 values that is not reproduced by IRI-2001, either at PAL or SJC. In addition, from 00:00 to 04:00 UT, CCIR IRI-2001 usually overestimates hmF2 for both locations.
Figure 2b shows the percent deviation between the IRI (CCIR) model results and the calculated values of the F-region peak height (hmF2) as a function of time of day and season at the stations PAL (left-hand side panels) and SJC (right-hand side panels), according to Eq. (2). It should be mentioned, once more, that only the CCIR numerical map provides values of hmF2. It is noticed that the hmF2 sim-ulations for both stations exhibit less percent deviation than the foF2 simulations. Apparently, there is a trend of positive differences (the model underestimates the hmF2 values) be-tween roughly 03:00 and 12:00 UT for the two stations in all seasons, and the underestimation persists for the station PAL around sunset hours for the months of October 2003, January and April 2004.
Abdu et al. (1996) presented, among other results, a com-parison between monthly averaged hpF2 values for March– April (autumn) of the years 1991 and 1992 (high to moder-ate solar activity) for the low-latitude station Fortaleza (4◦S, 38◦W, dip −12◦), which is comparable in magnetic latitude to the station PAL. The ionospheric parameter hpF2 is ob-tained from ionograms and is an estimate of the true height of the F-layer density peak. The authors pointed out that IRI-90 did not adequately reproduce the F-layer height near sunset. So, the comparisons presented in Figs. 2a and b (this work) corroborate the same trends pointed out by Abdu et al. (1996).
Batista and Abdu (2004) showed that the F-layer peak height in the evening is underestimated by IRI for the
equa-torial station S˜ao Lu´ıs (2.6◦S, 44.2◦W). Once more, our re-sults reinforce this same characteristic.
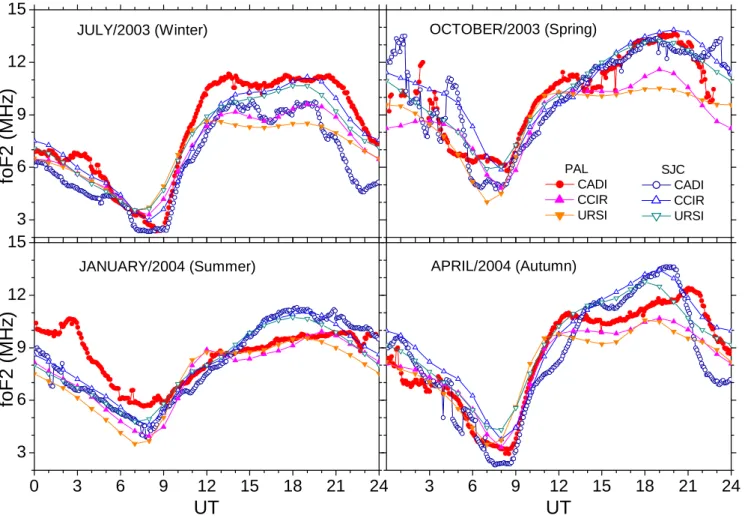
Observing the foF2 behavior pattern at those two loca-tions, one can infer the equatorial anomaly ionization (EIA) behavior, as well, since foF2 is directly proportional to the maximum electron density of the ionospheric plasma. Fig-ure 3 shows the observed average variations of foF2 values at PAL and SJC, together with the CCIR and URSI IRI-2001 simulations for the different seasons. It is noticed that the observed foF2 values are higher for PAL than for SJC, dur-ing almost the whole 24 h in July 2003. The CCIR and URSI IRI-2001 models do not predict such behavior. It is proba-bly related to the pattern of the magnetic meridional winds over those locations, which causes the well-known asym-metry of the EIA. As a result, the ionization over Palmas (closer to the EIA trough) is denser than that predicted by the models. In October 2003 (spring), between 13:00 and 19:00 UT, no significant difference between ionization over those two locations is observed, and it is noticeable that the CCIR and URSI IRI-2001 simulations have underestimated the foF2 values for PAL, apparently due to the same charac-teristic asymmetry caused by the magnetic meridional wind patterns. In January 2004, the best results for the simula-tion of the EIA are observed between 13:00 and 21:00 UT. Finally, in April 2004, the EIA is also well simulated, al-though with a lower agreement compared to the simulation in January 2004; the ionospheric parameter foF2 was under-estimated for PAL, between 11:00 and 24:00 UT.
Earlier papers by Lyon et al. (1963) and Shastri et al. (1996) suggest that there is a differential shift of the EIA crests with solar activity for different seasons in different lon-gitude sectors. Shastri et al. (1996) have presented compari-son between the observed data and predictions of the IRI-90 in the Indian sector. In this work, we have presented com-parative studies of the seasonal and latitudinal variations be-tween the observed data at two stations in the Brazilian sector and the predictions by the CCIR and URSI IRI-2001 models. Our results point out that the model overestimates the EIA trough in the Brazilian sector, that is, it underestimates the ionospheric parameter foF2 for the station PAL. The present study suggests that the CCIR and URSI IRI-2001 models should be improved for predictions for the EIA shape in the Brazilian longitude sector.
3 Conclusions
Comparative studies presented in this work showed that the IRI-2001 model provided data with different degrees of agreement relative to the digital ionosonde observed data, de-pending on the location. Analyses were carried out in two ways: visually and quantitatively. The latter consists of ap-plying a criterion called “relative deviation module mean” (rdmm) (Bertoni, 2004). We have selected five magnetically quiet days in the months of July 2003, October 2003, January
F. Bertoni et al.: IRI-2001 model predictions compared with ionospheric data 2197
100
200
300
400
500
100
200
300
400
500
100
200
300
400
500
3
6
9
12
15
18
21
24
0
3
6
9
12
15
18
21
24
100
200
300
400
500
<∆n>=0.05 <∆d>=0.05 <∆>=0.05SÃO JOSÉ DOS CAMPOS
<∆n>=0.05 <∆d>=0.07 <∆>=0.06
hm
F
2
(
k
m
)
JULY/2003 (Winter)PALMAS
<∆n>=0.06 <∆d>=0.04 <∆>=0.05 <∆ n>=0.10 <∆ d>=0.04 <∆>=0.07hm
F
2
(
k
m
)
OCTOBER/2003 (Spring) <∆d>=0.04 <∆>=0.07 POLAN IRI-2001 <∆n>=0.10 <∆n>=0.05 <∆d>=0.07 <∆>=0.06 JANUARY/2004 (Summer)hm
F
2
(
k
m
)
<∆ n>=0.10 <∆d>=0.04 <∆>=0.07UT
<∆n>=0.05 <∆d>=0.04 <∆>=0.04 APRIL/2004 (Autumn)hm
F
2
(
k
m
)
UT
340
341
342
Figure 2a. Plots of the average ionospheric parameter hmF2 for different seasons derived from
POLAN using observations at Palmas and São José dos Campos with hmF2 obtained from the
IRI-2001 model for these two stations. Also, the relative deviation module mean (rdmm),
∆
:
daytime (d) and nighttime (n) are presented.
343
344
16
Fig. 2a. Plots of the average ionospheric parameter hmF2 for different seasons derived from POLAN using observations at Palmas and S˜ao
Jos´e dos Campos with hmF2 obtained from the IRI-2001 model for these two stations. Also, the relative deviation module mean (rdmm),
h1i: daytime (d) and nighttime (n) are presented.
-20
0
20
40
-20
0
20
40
-20
0
20
40
3
6
9
12
15
18
21
24
0
3
6
9
12
15
18
21
24
-20
0
20
40
SÃO JOSÉ DOS CAMPOS
JULY/2003 (Winter)
PALMAS
OCTOBER/2003 (Spring) CCIR JANUARY/2004 (Summer)UT
(%)
hmF2 percent deviation
APRIL/2004 (Autumn)UT
345
346
347
348
349
Figure 2b. Plots of the percent deviation between the IRI (CCIR) model results and the calculated
values of the F-region peak height (hmF2) as a function of time of the day and season at the
stations PAL (left hand side panels) and SJC (right hand side panels).
17
Fig. 2b. Plots of the percent deviation between the IRI (CCIR) model results and the calculated values of the F-region peak height (hmF2)
as a function of time of day and season at the stations PAL (left-hand side panels) and SJC (right-hand side panels).
F. Bertoni et al.: IRI-2001 model predictions compared with ionospheric data 2199
3
6
9
12
15
0
3
6
9
12
15
18
21
24
3
6
9
12
15
3
6
9
12
15
18
21
24
JULY/2003 (Winter)fo
F
2
(
M
H
z
)
PAL CADI CCIR URSI SJC CADI CCIR URSI OCTOBER/2003 (Spring) JANUARY/2004 (Summer)fo
F
2
(MHz
)
UT
APRIL/2004 (Autumn)UT
350
351
352
353
354
Figure 3. Plots of the average observed ionospheric parameter foF2, measured at the Brazilian
stations of Palmas and São José dos Campos, by digital ionosondes type Canadian Advanced Digital
Ionosonde (CADI), at five-minute intervals, during the months of July and October 2003, January
and April 2004 (representing different seasons). Also, the IRI-2001 simulations are superposed.
18
Fig. 3. Plots of the average observed ionospheric parameter foF2, measured at the Brazilian stations of Palmas and S˜ao Jos´e dos Campos,
by digital ionosondes type Canadian Advanced Digital Ionosonde (CADI), at five-minute intervals, during the months of July and October 2003, January and April 2004 (representing different seasons). Also, the IRI-2001 simulations are superposed.
2004 and April 2004 as representatives of the winter, spring, summer and autumn seasons, respectively, according to the availability of the observational data at the two stations. So-lar activity during the periods was high to moderate.
Regarding the low-latitude station Palmas (PAL), the CCIR and URSI IRI-2001 models presented reasonable to poor simulations of the ionospheric parameter foF2 by ei-ther visual analysis or rdmm criterion. The visual analysis reveals that the models usually underestimate this parameter, for all the seasons represented by different months in the time interval of 10:00 to 24:00 UT. The rdmms exhibited values higher than 0.06, reinforcing the reasonable to poor agree-ment between the modeled and observed curves. The best result was obtained for January 2004 (summer), during the daytime (09:00 to 20:00 UT).
On the other hand, the IRI-2001 model provides reason-able to good values for foF2 for the station S˜ao Jos´e dos Campos (SJC), during most of the 24 h and for all the sea-sons. Either visually or through the results of rdmm, the
CCIR and URSI IRI-2001 models provided good results for October 2003, and January 2004, and reasonable results for July 2003 (winter) and April 2004 (autumn). Usually pre-dicted values lie within the deviation bars, indicating that the IRI-2001 model generates data within the characteristic vari-ability of the F-region over the location of SJC.
CCIR and URSI IRI-2001 models generated similar re-sults, since there is reasonable agreement between their curves. However, CCIR model results are a little better com-pared with URSI model for SJC.
True height profiles derived by POLAN (Titheridge, 1985), running under the software UDIDA (Fagundes et al., 2005), provided values of the ionospheric parameter hmF2. Comparisons carried out in this work suggest that in general, the CCIR IRI-2001 model simulates very reasonably hmF2, for both locations. Simulations during the daytime exhibit better results for the station SJC.
The ionospheric parameter foF2 is directly related to the maximum electron density of the ionospheric plasma. Since
this parameter was generally underestimated by the CCIR and URSI IRI-2001 simulations compared to the observed data, for the station Palmas, and generally was in good agree-ment with the observed data for the station S˜ao Jos´e dos Campos, the models apparently did not reproduce adequately the EIA shape over the Brazilian sector, as they should pro-vide higher foF2 values for the low-latitude station Palmas in the representative months of July 2003 (winter), October 2003 (spring) and April 2004 (autumn), between 10:00 and 24:00 UT. Better results were achieved in the simulations for January 2004 (summer), between 13:00 and 21:00 UT (LT=UT−3 h).
Ionospheric measurements carried out at geomagnetic low-latitude stations around the world are important for the improvements in CCIR and URSI numerical maps, in order to obtain better and more realistic results for the modeling of such regions and for the characteristic ionospheric parame-ters given by the International Reference Ionosphere.
Acknowledgements. This work was supported by the Brazilian
funding agency CNPq, DCT/SEPLAN-TO and CEULP/ULBRA under grant 350448/2004-3. Thanks are due to the Brazilian fund-ing agencies CNPq and FAPESP for the partial financial support through grants: 301222/2003/7 (CNPq); 2004/10104-9 (FAPESP). Authors thank I. S. Batista for helpful discussions.
Topical Editor M. Pinnock thanks N. Balan and K. J. W. Lynn for their help in evaluating this paper.
References
Abdu, M. A., Batista, I. S, and de Souza, J. R.: An overview of IRI-observational data comparison in American (Brazilian) sec-tor low latitude ionosphere, Adv. Space Res., 18, 13–22, 1996. Batista, I. S. and Abdu, M. A.: Ionospheric variability at Brazilian
low and equatorial latitudes: comparison between observations and IRI model, Adv. Space Res., 34, 1894–1900, 2004. Batista, I. S., Abdu, M. A., de Medeiros, R. T., and de Paula, E.
R.: Comparison between IRI predictions and digisonde measure-ments at low latitude station, Adv. Space Res., 18, 49–52, 1996. Bertoni, F.: Derivas Ionosf´ericas em Latitudes Equatoriais:
Observac¸˜oes e Modelagem, Ph.D. Thesis (available only in Por-tuguese Language), Instituto Nacional de Pesquisas Espaciais (INPE), S˜ao Jos´e dos Campos, Brazil, 2004.
Bilitza, D.: International Reference Ionosphere 2000, Radio Sci., 36, 261–275, 2001.
Bilitza, D., Sheikh, N. M., and Eyfrig, R.: A global model for the height of the F2-peak using M(3000)F2 values from the CCIR numerical map, Telecomm. J., 46, 549–553, 1979.
Bittencourt, J. A. and Chryssafidis, M.: On the IRI model predic-tions for the low-latitude ionosphere, J. Atmos. Terr. Phys., 56, 995–1009, 1994.
CCIR: Atlas of ionospheric characteristics, Comit´e Consultatif International des Radiocommunications, Report 340-6, Int. Telecommun. Union, Geneva, 1991.
CCIR: Atlas of Ionospheric Characteristics, Comit´e Consultatif International des Radiocommunications, Report 340-4, Int. Telecommun. Union, Geneva, 1967.
Fagundes, P. R., Pillat, V. G., Bolzan, M. J. A., Sahai, Y., Becker-Guedes, F., Abalde, J. R., Aranha S. L., and Bittencourt J. A.: Observations of F-layer electron density profiles modulated by planetary wave type oscillations in the equatorial ionospheric anomaly region, J. Geophys. Res., 110, A12302, 1–8, 2005. Fox, M. W. and McNamara, L. F.: Improved World-Wide Maps
of Monthly Median foF2, J. Atmos. Terr. Phys., 50, 1077–1086, 1988.
Grant, I. F., MacDougall, J. W., Ruohoniemi, J. M., Bristow, W. A., Sofko, G. J., Koehler, J. A., Danskin, D., and Andre, D.: Com-parison of plasma flow velocities determined by the ionosonde Doppler drift technique, SuperDARN radars, and patch motion, Radio Sci., 30, 1537–1549, 1995.
Lyon, A. J. and Thomas, L.: The F2-region equatorial anomaly in the African, American and East Asian sectors during sunspot maximum, J. Atmos. Terr. Phys., 25(7), 373–386, 1963. Rush, C.M., Fox, M., Bilitza, D., Davies, K., McNamara, L.,
Stew-art, F., and PoKempner, M.: Ionospheric mapping: an update of foF2 coefficients, Telecomm. J., 56, 179–182, 1989.
Rush, C. M., PoKempner, M., Anderson, D. N., Perry, J. C., Stew-art, F. G., and Reasoner, R.: Maps of foF2 Derived from Obser-vations and Theoretical Data, Radio Sci. 19, 1083–1097, 1984. Rush, C. M., PoKempner, M., Anderson, D. N., Stewart, F. G., and
Perry, J.: Improving Ionospheric Maps Using Theoretically De-rived Values of foF2, Radio Sci. 18, 95–107, 1983.
Sethi, N. K., Dabas, R. S., and Vohra, V. K.: Ddiurnal and sea-sonal variations of HmF2 deduced from digital ionosonde over New Delhi and its comparison with IRI 2001, Ann. Geophys., 22, 453–458, 2004,
http://www.ann-geophys.net/22/453/2004/.
Shastri, S., Aggarwal, S., and Sethi, N. K.: Performance of IRI model predictions of F-region for Indian latitudes, Adv. Space Res., 18, 41–44, 1996.
Souza, J. R. de, Bailey, G. J., Abdu, M. A., and Batista, I. S.: Comparison of low latitude F region peak densities, heights and equatorial ExB drift from IRI with observational data and the Sheffield University plasmasphere ionosphere model, Adv. Space Res., 31, 501–505, 2003.
Titheridge, J. E.: Ionogram analysis with the generalized pro-gram POLAN, Report UAG-93, World Data Center A for Solar-Terrestrial Physics, U.S. Dept. of Commerce, Boulder CO, 80301 USA, 1985.