HAL Id: hal-01726794
https://hal.univ-lorraine.fr/hal-01726794
Submitted on 8 Mar 2018HAL is a multi-disciplinary open access archive for the deposit and dissemination of sci-entific research documents, whether they are pub-lished or not. The documents may come from teaching and research institutions in France or abroad, or from public or private research centers.
L’archive ouverte pluridisciplinaire HAL, est destinée au dépôt et à la diffusion de documents scientifiques de niveau recherche, publiés ou non, émanant des établissements d’enseignement et de recherche français ou étrangers, des laboratoires publics ou privés.
gammarid species: evaluation with a Laird–Gompertz
model
Christophe Piscart, Simon Devin, Jean-Nicolas Beisel, Jean-Claude Moreteau
To cite this version:
Christophe Piscart, Simon Devin, Jean-Nicolas Beisel, Jean-Claude Moreteau. Growth-related life-history traits of an invasive gammarid species: evaluation with a Laird–Gompertz model. Canadian Journal of Zoology, NRC Research Press, 2003, 81 (12), pp.2006-2014. �10.1139/Z03-188�. �hal-01726794�
Growth-related life history traits of an invasive gammarid species:
evaluation with a Laird-Gompertz model.
Christophe Piscart, Simon Devin, Jean-Nicolas Beisel and Jean-Claude Moreteau
C. Piscart, S. Devin1, J.-N. Beisel and J.-C. Moreteau. Université de Metz - Laboratoire
Biodiversité et Fonctionnement des Ecosystèmes (LBFE) - Campus Bridoux, Av. du Général Delestraint, 57070 Metz, France
1
Corresponding author : devin@sciences.univ-metz.fr Tel: (33) 03 87 37 84 31/ Fax: (33) 03 87 37 84 23
C. Piscart, S. Devin, J.-N. Beisel and J.-C. Moreteau: Growth-related life history traits of an invasive gammarid species: evaluation with a Laird-Gompertz model.
Abstract: Although the invasive gammarid Dikerogammarus villosus (Crustacea, Amphipoda) is
a recent successful invader of Western Europe’s lakes and rivers, and a threat to North American aquatic ecosystems, its biology is scarcely known. Different growth models for each sex were established for the first time for a natural population of a freshwater gammarid. The Laird-Gompertz growth curve was used, on account it fit the best to our data, and was associated with an environmental forcing function to adjust the growth rate according to seasonal variations of environmental conditions. It was applied to a length decomposition obtained using the
Bhattacharya’s method, realised on data obtained from a one-year population dynamics study. The models allowed an assessment of biological traits such as life span, the age of sexual maturity, the potential number of generations per year and the growth rate depending on environmental conditions. Growth-rate differences between males and females were consistent with biological processes such as the allocation of energy for reproduction. D. villosus had higher rates of growth and earlier sexual maturity than all other taxa, demographics that perhaps explain it’s invasive tendencies and its ability to colonise numerous new ecosystems, thus to become a cosmopolitan freshwater species.
C. Piscart, S. Devin, J.-N. Beisel and J.-C. Moreteau: Growth-related life history traits of an invasive gammarid species: evaluation with a Laird-Gompertz model.
Résumé: Bien que le Gammaridae invasif Dikerogammarus villosus (Crustacea, Amphipoda)
soit une espèce ayant récemment colonisé avec succès les hydrosystèmes d’Europe de l’Ouest, et qu’il constitue une menace pour les écosystèmes dulçaquicole d’Amérique du Nord, sa biologie reste méconnue. Des modèles de croissance ont été construits pour la première fois pour chaque sexe d’une population naturelle de gammare dulçaquicole. La courbe de croissance de Laird-Gompertz a été utilisée, associée à une fonction de forçage environnemental permettant d’ajuster la croissance aux variations saisonnières du milieu. Ces fonctions ont été appliquées à une décomposition de taille obtenue par la méthode de Bhattacharya obtenue sur des données provenant d’une étude de dynamique des populations menée sur un an. Ces modèles ont permis de déterminer des traits biologiques tels que l’espérance de vie, l’age de maturité sexuelle, le nombre potentiel de générations par an et le taux de croissance en fonction des conditions environnementales. Les différences de taux de croissance entre mâles et femelles cadrent avec des processus biologiques tels que l’allocation d’énergie pour la reproduction. Une comparaison des caractéristiques biologiques de différents gammares d’eau douce ou saumâtre a souligné le caractère invasif de D. villosus (fort taux de croissance et maturité sexuelle précoce) et sa capacité à coloniser de nombreux nouveaux écosystèmes, donc de devenir une espèce cosmopolite en eau douce.
Introduction
The freshwater gammarid Dikerogammarus villosus Sowinsky is a Ponto-Caspian species first observed in the Rhine Basin in 1995 (bij de Vaate and Klink 1995) and in one of its main tributaries, the Moselle River, in 1999 (Devin et al. 2001). The ability of D. villosus to colonise new lakes and rivers easily after introduction has already been suggested by several studies (Nesemann et al. 1995; Kelleher et al. 1998). The consequence of its introduction into an ecosystem on the macroinvertebrate community can be significant, in particular because it is a competitive species exhibiting a large size and predatory behaviour (Dick and Platvoet 2000; Dick et al. 2002).
In spite of the importance of this species, its main biological, physiological and ecological traits are not well known. To date, results have been published about its reproduction (Ciolpan 1987; Muskó 1990; Kley and Maier 2003; Devin et al. in press), its geographical distribution (Devin et al. 2001; bij de Vaate et al. 2002) and its wide tolerance to salinity and temperature (Bruijs et al. 2001; Wijnhoven, 2003). However, no studies have been carried out to date on the growth of D. villosus, though growth-rate is generally assumed to play a central role in the biological invasion process (Ricciardi and Rasmussen 1998; Kolar and Lodge 2001).
Growth models based on the length of individuals have not thus far been used to describe the population dynamics of freshwater gammarids in natural conditions. In the past, logistic models were used to describe weight increase for Gammarus pulex (L.) (Sutcliffe et al. 1981),
Gammarus roeselii Gervais and Gammarus fossarum Koch (Pöckl 1992, 1995) under laboratory
conditions. In the natural environment, two models are generally used to describe growth of a species (Gamito 1998): the Laird-Gompertz growth model and the Von Bertalanffy linear growth
equation. In this study, we innovate in modelling growth-at-length of natural populations of an invasive freshwater gammarid. The chosen model was associated with a temporal function to describe seasonal changes in D. villosus growth rates. The Cloern and Nichols (1978) is a
function that could be integrated in a model to express time as a sinusoid. A lot of environmental parameters evolve with time, so we state that such a function integrates a whole range of
ecological parameters such as temperature, chlorophyll-a concentration and dissolved oxygen levels. It has already been used successfully in several studies (Appeldoorn 1987; Le Gallo and Moreteau 1988).
A mathematical model could be a powerful tool in determining the mechanisms that underlie a biological invasion process. Moreover, associated with a traditional study of the life history of D. villosus (Devin et al. in press), growth modelling of a natural population allowed us to assess different biological life-history traits such as the reproduction period (by
retro-calculation computing), age of sexual maturity, life-span and the potential number of generations per year, each parameter recognised as playing an important role during an invasion process (Ricciardi and Rasmussen 1998; Kolar and Lodge 2001).
The results found with the growth model for D. villosus will be discussed in the light of similar modelling approach for other gammarid species.
Materials and Methods
Sampling protocol
D. villosus was studied at Argancy, a sampling station on the Moselle River in France
and twice a month between March 2001 and December 2001. Two kinds of artificial substrates, with volumes of 2 and 5 liters and aperture surfaces ranging between 46 and 122 cm², were used. It allowed us to optimise the sorting of the individuals when very rich densities were reached in the substrates. For each date, both substrates were oriented vertical to the river bottom at approximately 0.5-2 m from the bank. The river temperature was recorded on each sampling occasion. Main physicochemical parameters for our study site were obtained from a regional freshwater database, the ‘Banque de l’Eau Rhin-Meuse - Réseau National des Données sur l’Eau’.
Each D. villosus collected was measured to the nearest 0.1 mm from the tip of the rostrum to the base of the telson using a stereo-microscope fitted with an eyepiece micrometer. Adult individuals (longer than 6 mm) were sexed, the others were categorised as juveniles. The animals thus collected were used to adjust the growth-at-length model of D. villosus.
Analysis of monthly length-frequency structures
To separate a complex length-frequency distribution into cohorts, each cohort being defined as those individuals of the same age, a preliminary analysis indicated that the Bhattacharya method (Bhattacharya 1967) was particularly efficient with our data. The
Bhattacharya graphical method consists of separating normal distributions, each representing a cohort of D. villosus, from the overall distribution, starting on the left-hand side of the total distribution. Once the first normal distribution has been determined, it is removed from the total distribution and the same procedure is repeated as many times as possible (Fig. 1). For each cohort, the mean size of the individuals, the corresponding standard deviation and the individual number were estimated.
Model choice
A preliminary analysis tested whether it is the Laird-Gompertz or the von Bertalanffy model that fit the best with the growth increment calculated. Coefficients of determination were respectively of 0.858 and 0.832. These values were not statistically different (t-test, p=0.35), thus this criteria is not sufficient to choose a model. However, the von Bertalanffy model provides a linear adjustment, so that the growth speed never decrease, while the growth increment of D.
villosus is lower for large individuals. The only model that allow such a decrease in growth rate is
the Laird-Gompertz model, thus we select this one.
Growth model equation
Growth of D. villosus was modelled by fitting a Laird-Gompertz curve to the length-at-date data using the Non-Linear module of the Statistica software (StatSoft 2000). According to Ricker (1979), the Gompertz equation used was:
[1] Lt = L0 exp(k(1-e-at ))
Where L0 corresponds to length at t =0, k is the growth rate of the population, a is a
dimensionless parameter such that ka is the growth rate at t = 0 and Lt is the length at a given age
t expressed in weeks.
The differences observed for each mean length of cohorts between two successive sampling dates were used to determinate the weekly growth rate. Growth rates were obtained by using the derived function of the Laird-Gompertz equation (Debouche 1979; Tanaka and Kikuchi 1980) :
[2]
dt
where L∞ is the asymptotic length of the population studied.
An efficient model had to take into account seasonal variations in environmental conditions, with suitable conditions for growth during spring and summer and slower growth during winter. To this end, a sinusoidal equation called the environmental forcing function (Ef) was used. The Ef must always be greater than or equal to zero because the growth cannot be negative. The selected environmental forcing function used, derived from the Cloern and Nichols (1978) equation (Le Gallo and Moreteau, 1988), is expressed as:
[3] Ef = exp(α*sin(2*π/52*(WS-β)))
Where α and β are the adjusting constants of the model in time and WS is the time in weeks. By combining equations 2 and 3, a general model for the D. villosus growth rate has been developed:
[4]
dt
dL k*Lt* ln(L∞ / Lt)*exp[α*sin(2*π/52*(WS-β))]
The parameters of this model will be determined with the non-linear module of Statistica software (StatSoft 2000), using the quasi-Newton estimation method, which tends to minimise least squares during the process of adjustment of the model.
Results
Sexual differentiation and monthly length-frequency structures identified
A total of 2,710 males and 4,095 females were collected and measured during the
The mean length of males is higher than the mean length of females (t = -27.03, df=6803, p < 0.0001), this length difference being of 15 ± 3 %.
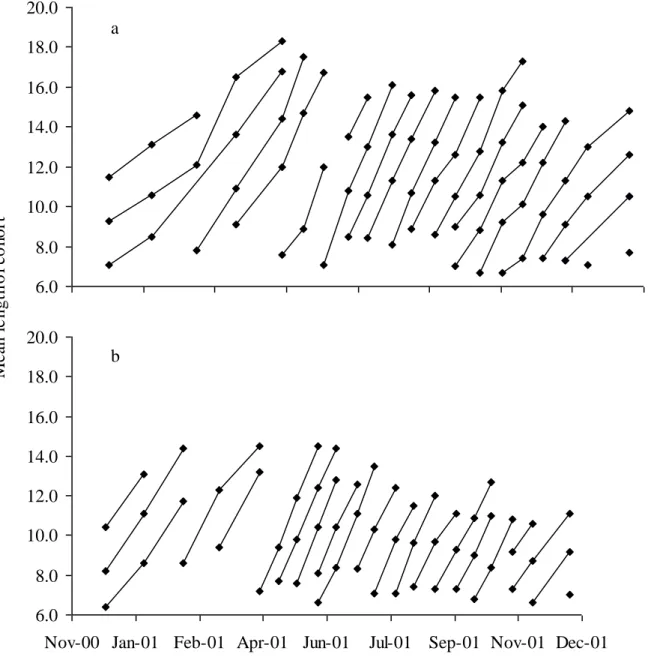
The maximum length for males of D. villosus was 22.8 ± 0.1 mm (sampled in June 2001) and 18.6 ± 0.1 mm for females (sampled in March 2001). We chose to fix the asymptotic length at 23 mm for males. Females being 15 % shorter than males, we fixed female asymptotic length at 20 mm. For a full year survey, 19 cohorts for each sex were identified using the Bhattacharya method. The progression of the mean length considered for each cohort is reported in Fig. 2. The tracking of each cohort over time corresponds to compromises which follow four rules: (1) a cohort has a size which cannot decrease in the lapse of time considered, (2) the growth rate is not faster in winter than in summer, (3) the number of new cohorts observed after births should be the same for both sexes, (4) the variation in the growth rate over time must be biologically coherent (the size increase much fit with those classically encountered for freshwater gammarids and the growth rate variations shouldn’t be too abrupt in regard to seasonal one).
Growth rates and environmental factors
The growth rates (G) were determined with [(Lt - Lt-1) / (WSt – WSt-1)] values for males
and females. The values of growth per week ranged between 0.3 mm and 1.6 mm for males, this last value being observed for individuals measuring between 7 and 12 mm in spring. For females, the growth rates varied between 0.4 mm and 1.2 mm per week, the maximum value being
observed in spring and summer (temperatures always above 12 °C) for individuals measuring between 7 and 13 mm. The minimum rates for males (0.3 mm per week) and females (0.4 mm per week) were observed for all sizes during the winter periods 2000 and 2001 when water temperatures fall below 12°C.
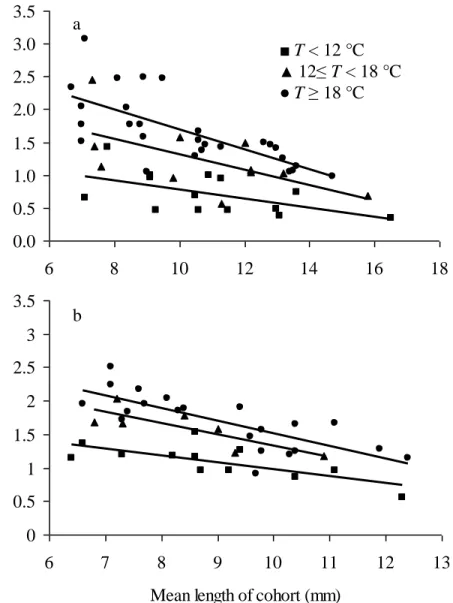
Instantaneous or specific growth rates (Gs, % Lt. day-1, an expression of growth) were determined and were correlated significantly for males and females with the mean length of animals (Fig. 3 and Table 1). As can be expected from these observations, specific growth rates were highest for young adults and Gs decreased with body size. The Gs-values ranged between 0.3 % and 3.1% for males and between 0.6 % and 2.5 % for females (Fig. 3). The mean
growth-rate is 1.3 % ± 0.6 % Lt. day-1 for males and 1.5 % ± 0.4 % Lt. day-1 for females. Moreover,
Gs-values depended on the temperature, the highest Gs-values being estimated for the highest temperatures (Fig. 3). A comparison of linear regression models corresponding to the three temperature levels chosen arbitrarily ( T ≤ 12°C, 12 < T ≤ 18°C and T >18 °C) show that the Gs-values of males are not significantly different from those of females when water temperatures
exceed 18 °C (ANCOVA: slope comparison F1,45=0.423, p=0.519 and intercept comparison
F1,46=2.686, p=0.108), corresponding to May-October 2001 period and for temperatures between
12 °C and 18 °C (ANCOVA: slope comparison F1,15=0.225, p= 0.642 and intercept comparison
F1,16=0.152, p=0.702). When water temperatures drop below 12°C, the female Gs-values are
significantly higher than male Gs-values (ANCOVA: slope comparison F1,23=0.477, p=0.497 and
intercept comparison F1,24=4.481, p=0.045 for intercept).
A seasonal variation in water temperature was considered, with the highest value during the summer (mid July, 24.4°C) and lowest during winter 2001 (mid-December 2001, 3.2°C). Optimal growth temperatures were found between June and August (Fig. 4), when water temperatures ranged between 20 and 22 °C. In winter and early spring, when the temperatures were below 12°C, the absolute growth rates of females were higher than those of males (Fig. 4) agreeing with the results found with the specific growth rates (Fig. 3).
Several environmental factors, such as concentrations of Ca2+ ions (mg.l-1) and dissolved
(µS.cm-1) were measured, but only Chlorophyll a concentration was correlated to the variations in
the growth rate (Spearman rank correlation, rspearman=0.495, p < 0.0001 for males and
rspearman=0.319, p = 0.015 for females).
Application of the Gompertz model with an environmental forcing function
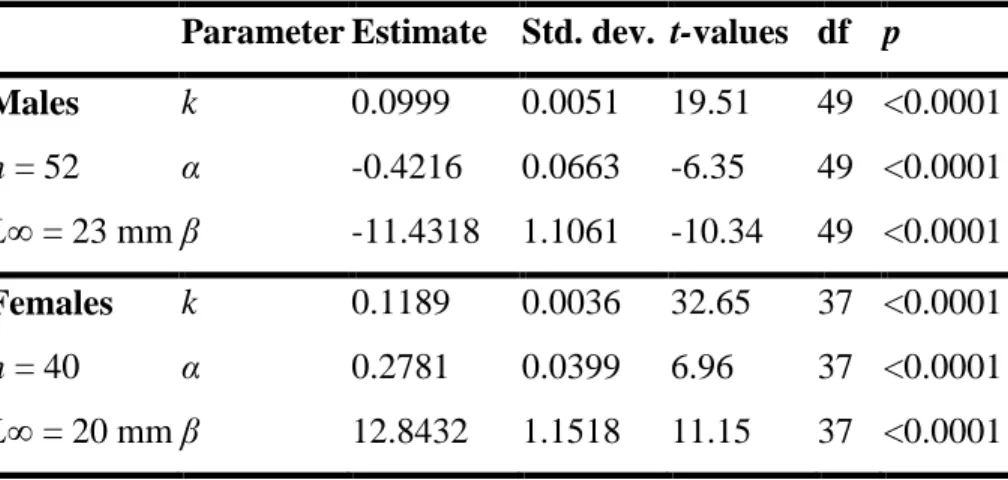
Values of the parameters for males and females in equation 4 are presented in Table 2. The Laird-Gompertz model coupled with an environmental forcing function resulted in a good fit to length data, as shown by the determination coefficient (r = 0.50 for males and r = 0.56 for females) and p values (p < 0.0001) for the overall growth parameters (Table 2).
The variations in the growth rate k(t) over the course of a year (Fig. 4) showed that the amplitude of the seasonal variation was lower for females than for males. The growth of females was higher in winter but fell below that of males when the water temperature exceeded 15 °C in May 2001. After mid-October 2001, the water temperature dropped below 15°C and the growth of females again overtook the growth of males.
The curves calculated from observed sizes of cohorts obtained during the reproductive peak were plotted (Fig. 5). Newborn D. villosus measure approximately 1.8 mm (Devin et al. in press). The construction of an S-shaped model shows three phases: the exponential phase in the beginning, the linear phase around the inflection point and the satiation phase, when the final size is asymptotically approximated.
Our simulations for each cohort highlighted the regular arrival of new cohorts each 15 to 25 days from February to November (Fig. 2 and results not shown). However, the number of newborns at each date allowed us to consider that D. villosus presents three main reproductive periods, in mid-April, July, and in September-October (Fig. 5). During these three periods, reproduction increased and contributed to the large majority of individuals (Devin et al. in press).
The simulations with the Laird-Gompertz model were realised for these three reproduction peaks (Fig. 5), and highlighted seasonal growth differences.
Discussion
To our knowledge, the use of growth models to describe the growth of a freshwater gammarid in natural conditions has not been published to date. We have shown that the Laird-Gompertz growth model associated with an environmental forcing function efficiently described the growth at length of the invasive species D. villosus. This model can be used to determine certain biological traits such as the growth rate depending on environmental conditions, life span, age of sexual maturity and the potential number of generations per year.
The mean length observed in this study shows that males of D. villosus are longer than females. This difference has already been observed for D. villosus in the Danube river
(Nesemann et al. 1995), for Gammarus fossarum and Gammarus roeselii (Pöckl 1995) and for
Gammarus pulex (Sutcliffe et al. 1981; Gee 1988). In the literature, the maximum length of D. villosus cited was 30 mm (Nesemann et al. 1995) but the maximum lengths observed in the
Moselle River were 22.8 0.1mm for males and 18.6 0.1 mm for females.
Mean growth rates of each of the D. villosus cohorts were estimated and were found very important compared to that of other gammarid species. Logically, the rate changes according to the season and to body length, thus, the use of the environmental function in the model appears necessary. The maximum observed rates were 1.6 and 1.2 mm per week for males and females respectively. The maximum rate observed is associated with medium-sized individuals (between
7 and 13 mm), these sizes corresponding to the linear phase around the inflection point of the growth curve.
Study of major environmental factors shows that the growth rate was strongly correlated with the water temperature, which is an important parameter usually related to amphipod life history traits (Kinne 1961; Pöckl 1995; Rajagopal et al. 1999). Recently, Bruijs et al. (2001) showed the role of this factor for D. villosus populations and particularly for the colonisation process and species maintenance in new temperate areas.
An alternative form of analysis is the commonly used relative, specific growth rate, which is conveniently expressed as a percentage rate of growth, Gs. According to the temperature level, linear regressions of the Gs-values against Lt gave good fits for males and females. Thus, Gs declined with increasing Lt until the animals reached asymptotic maximum length. For D.
villosus, the average growth rate is 1.3 % ± 0.5 % Lt.day-1 for males and 1.5 % ± 0.4 % Lt. day-1 for females. Above 12°C, no differences between the sexes being observed, the growth rate of D.
villosus can be compared to that of other species. Specific growth rates were reported or
calculated with length measures collected in the literature (Table 3). The comparison between the values cited in the literature and values in this study remains rather difficult because data
concerning the Gs-values were generally obtained with fixed temperatures and under laboratory conditions. However, in comparing the same temperatures and the same sizes, the Gs-values of mature D. villosus are higher than those of others freshwater gammarids such as G. fossarum and
Gammarus duebeni Lilljeborg as well as estuarine gammarids such as Gammarus zaddachi
Sexton and Gammarus salinus Spooner (Table 3).
Under laboratory conditions, there are some contrasting results concerning the life spans of various gammarid species. For example, Welton and Clarke (1980) predict for G. pulex a lifespan of 17-23 months for females and up to 30 months for males at lower temperatures (4-17
°C) while Teichmann (1982) found lifespan between 14 and 18 months at 5-20 °C. Hynes (1955), in natural populations of G. pulex, found that at relatively high temperatures males and females normally live for 12-15 months. Starting from our model, with temperatures ranging between 3.2 °C and 22.2°C, we can estimate the D. villosus lifespan at 11-17 months for males and 10-11 months for females. Considering the river temperature regime and the specific growth rate in length, which increased with temperature, the predicted life spans appear rather long. Males would live longer than females, which explain the higher total number of cohort/date
combinations for males compared to females (N=52 and 40 respectively). This difference has already been observed for G. fossarum (Pöckl 1992) and for G. pulex (Welton and Clark 1980) probably because males are less physiologically stressed than females. Furthermore, the
disappearance of females after a reproductive period may limit overlap of generations (Fig. 5), reducing within-population competition and thus favouring the invasive ability of D. villosus. Such a lack of intraspecific competition has been shown to enhance species invasiveness (Holway et al. 1998).
With regard to the onset of sexual maturity, the smallest ovigerous females was observed at a size of 6 mm, which can be defined as the potential size of sexual maturity of D. villosus. This size corresponded to an age ranging between 33 and 55 days according to the date of birth. The age of sexual maturity for various freshwater gammarids was determined in several studies under laboratory conditions. For G. pulex, it is 87.5 days at 20 °C and 133 days at 15 °C (Welton and Clarke 1980; Sutcliffe et al., 1981). For G. fossarum, sexual maturity was reached in 115 days at 20.2°C and 250 days at 12°C and ranged between 80 days at 20.2°C and 210 days at 12 °C for G. roeselii (Pöckl 1995). For Gammarus tigrinus Sexton, sexual maturity was reached in 42 days at 25°C and 91 days at 16 °C (Hynes 1955), while Savage (1982) found it occurring in 39
days at 25°C and 61 days at 15°C. In comparison with other freshwater gammarids, D. villosus females are the most precocious in terms of reaching sexual maturity.
A total of 19 cohorts was observed between December 2000 and December 2001 with an appearance frequency generally ranging from 15 to 25 days (data obtained by retrocalculation, not shown). However, the number of juveniles sampled highlighted three main reproductive periods, though obviously the species reproduces all year long (Fig. 5). The growth model provided proof that each of these main generations could be traced to the reproduction of
individuals recruited from the preceding main reproductive period. The size necessary for sexual maturity was quickly attained regardless of the season and allowed for egg development to produce a new generation that was observed in a peak of juveniles. Hence, D. villosus can be considered a multivoltine species. Two alternative hypotheses can be proposed to explain the significant number of cohorts. First, egg development can be very fast and the same female can reproduce twice within a short time period. Clemens (1950) has shown that the incubation period for Gammarus fasciatus Say ranged between 7 days at 24 °C and 21 days at 15 °C and Savage (1982) showed that for G. tigrinus the number of generations was approximately 50% greater at 25°C than at 15°C, results confirmed by Pöckl and Timischl (1990) for G. fossarum and G.
roeselii. It is biologically possible that two successive reproductions could take place during the
time observed between successive cohorts. Chambers (1977) has shown for example that
theoretically, G. tigrinus could produce 16 broods during the breeding season between March and November. Pöckl (1992) reported that adult females of G. fossarum and G. roeselii released a brood approximately six to ten times. The second hypothesis supposes that females produced their broods in several waves one after another. According to Devin et al. (in press) the maximum relative abundance of ovigerous females observed was 32.6 % of the total number of females. Thus there are at least 67.4 % of females at each date that were not ovigerous. Those females can
became ovigerous and produce a brood at any time, explaining that there are a so high number of cohorts.
The seasonal changes in the study of the theoretical growth of males and females shows that the differences between the sexes are strongly correlated with water temperature. An important threshold in D. villosus growth appeared at 15°C, the growth of females dropping below that of males above this temperature. This result can be explained by the reproductive cycle during which female resources are, for the most part, allocated to egg production. A study of Dikerogammarus haemobaphes Eichwald reproduction showed that females began egg production when the water temperature exceeded 17°C (Muskó 1993) and an other Ponto-Caspian amphipod, Corophium curvispinum Sars, was found to extend egg production when water temperature exceeded 10°C (Rajagopal et al. 1999) or 12°C (Muskó 1993), depending on the ecosystem.
The general conclusion from the analysis of growth at length presented is that a mathematical model can be useful in order to check certain hypotheses formulated during classical analyses of population dynamics. However, the choice of an appropriate growth model is important as it may have a decisive effect on the simulation results of a dynamic ecological model. The use of a model allowed us to describe the growth of immature individuals, showing that mature D. villosus females were much younger than other freshwater gammarids. Moreover, we have shown that D. villosus has a short generation time and a rapid growth rate (particularly among the younger animals). These three attributes are very important in the biological invasion process (Ricciardi and Rasmussen 1998; Kolar and Lodge 2001). Bruijs et al.(2001) highlighted a wide environmental tolerance and finally Devin et al. (in press) show that this abundant and widely distributed species also has a high reproductive capacity. Our contribution confirms the
invasive potential of D. villosus and suggests its ability to maintain itself in newly colonised areas, becoming a cosmopolitan species in freshwater ecosystems.
Acknowledgements
We would like to thank the ‘Banque de l'Eau Rhin-Meuse - Réseau National des Données sur l’Eau’ for the physicochemical data and Anna Cartier for her linguistic corrections. This study is supported by the French Ministry of Ecology and Sustainable Development , as part of the INVABIO – Biological Invasions 2001-2003 program.
References
Appeldoorn, R.S. 1987: Modification of a seasonally oscillating growth function for use with mark-recapture data. Journal du Conseil international pour l'Exploration de la Mer 43: 194-198.
Bhattacharya, C.G. 1967: A simple method of resolution of a distribution into Gaussian components. Biometrics 23: 115-135.
Bij de Vaate, A., Jazdzewski, K., Ketelaars, H.A.M., Gollasch, S., and Van der Velde, G. 2002: Geographical patterns in range extension of Ponto-Caspian macroinvertebrates species in Europe. Can. J. Fish. Aquat. Sci. 59: 1159-1174.
Bij de Vaate, A., and Klink, A.G. 1995: Dikerogammarus villosus SOWINSKY (Crustacea: Gammaridae) a new immigrant in the Dutch part of the Lower Rhine. Lauterbornia 20: 51-54.
Bruijs, M.C.M., Kelleher, B., van der Velde, G., and bij de Vaate, A. 2001: Oxygen consumption, temperature and salinity tolerance of the invasive amphipod
Dikerogammarus villosus: indicators of further dispersal via ballast water transport. Arch.
Hydrobiol. 152: 633-646.
Chambers, M.R. 1977: The population ecology of Gammarus tigrinus (Sexton) in the reeds beds of the Tjeukemeer. Hydrobiologia 53: 155-164.
Ciolpan, O. 1987: Zur Fortpflanzung von Dikerogammarus villosus (Sow.) Mart. (Crustacea -Amphipoda) im Eisernes Tor-Stausee (Bahna-Golf, 1983-1984). Rev. Roum. Biol. 32: 71-74.
Clemens, P. 1950: Life cycle and Ecology of Gammarus fasciatus Say. Ohio State University, Columbus, Ohio.
Cloern, J.E., and Nichols, F.H. 1978: A von Bertalanffy growth model with a seasonally varying coefficient. J. Fish. Res. Board Can. 35: 1479-1482.
Debouche, C. 1979: Présentation coordonnée de différents modèles de croissance. Revue de Statistiques appliquées 27: 5-22.
Devin, S., Beisel, J.-N., Bachmann, V., and Moreteau, J.C. 2001: Dikerogammarus villosus (Amphipoda: Gammaridae): Another invasive species newly established in the Moselle River and French hydrosystems. Annls Limnol.- Int. J. Limnol. 37: 21-27.
Devin, S., Piscart, C., Beisel, J.-N., and Moreteau J.-C. : Life history traits of the invader
Dikerogammarus villosus (Crustacea: Amphipoda) in the Moselle River, France. Int. Rev.
Hydrobiol. In press.
Dick, J.T.A., and Platvoet, D. 2000: Invading predatory crustacean Dikerogammarus villosus eliminates both native and exotic species. Proc. R. Soc. Lond. B Biol. 267: 977-983.
Dick, J.T.A., Platvoet, D., and Kelly, D.W. 2002: Predatory impact of the freshwater invader,
Dikerogammarus villosus (Crustacea: Amphipoda). Can. J. Fish. Aquat. Sci. 59:
Gamito, S. 1998: Growth models and their use in ecological modelling: an application to a fish population. Ecol. Model. 113: 83-94.
Gee, J.H.R. 1988: Population dynamics and morphometrics of Gammarus pulex L.: Evidence of seasonal food limitation in a freshwater detritivore. Freshwater Biol. 19: 333-343.
Holway, D.A., Suarez, A.V., and Case, T.J. 1998: Loss of intraspecific aggression in the success of a widespread invasive insect. Science 282: 949-952.
Hynes, H.B.N. 1954: The ecology of Gammarus duebeni Lilljeborg and its occurence in fresh water in Western Britain. J. Anim. Ecol. 23: 38-84.
Kelleher, B., Bergers, P.J.M., van den Brink, F.W.B., Giller, F.W.B., van der Velde, G., and bij de Vaate, A. 1998: Effects of exotic amphipod invasions on fish diet in the Lower Rhine. Arch. Hydrobiol. 143: 363-382.
Kinne, O. 1960: Gammarus salinus, einige Daten über den Umwelteinfluss auf Wachtum, Häutungsfolge, Herzfrequenz und Eientwicklungsdauer. Crustaceana 1: 208-217.
Kinne, O. 1961: Growth, molting frequency, heart beat, number of eggs and incubation time in
Gammarus zaddachi exposed to different environments. Crustaceana 2: 26-36.
Kley, A., and Maier, G. 2003: Life history characteristics of the invasive freshwater gammarids
Dikerogammarus villosus and Echinogammarus ischnus in the river Main and the
Main-Donau canal. Arch. Hydrobiol. 156: 457-469.
Kolar, C.S., and Lodge, D.M. 2001: Progress in invasion biology: predicting invaders. Trends Ecol. Evol. 16: 199-204.
Le Gallo, J.M., and Moreteau, J.C. 1988: Croissance et productivité d'une population du
Sphaerium corneum (L.) (Bivalvia : Pisidiidae). Can. J. Zool. 66: 439-445.
Muskó, I.B. 1990: Qualitative and quantitative relationships of Amphipoda (Crustacea) living on macrophytes in Lake Balaton (Hungary). Hydrobiologia 191: 269-274.
Muskó, I.B. 1993: The life history of Dikerogammarus haemobaphes (EICHW.) (Crustacea: Amphipoda) living on macrophytes in Lake Balaton (Hungary). Arch. Hydrobiol. 127: 227-238.
Nesemann, H., Pöckl, M., and Wittmann, M. 1995: Distribution of epigean Malacostraca in the middle and upper Danube (Hungary, Austria, Germany). Miscnea Zool. Hung. 10: 49-68. Pöckl, M. 1992: Effects of temperature, age and body size on moulting and growth in the
freshwater amphipods Gammarus fossarum and G. roeseli. Freshwater Biol. 27: 211-225. Pöckl, M. 1995: Laboratory studies on growth, feeding, moulting and mortality in the freshwater
amphipods Gammarus fossarum and G. roeseli. Arch. Hydrobiol. 134: 223-253.
Pöckl, M., and Timischl, W. 1990: Comparative study of mathematical models for the relationship between water temperature and brood development time of Gammarus
fossarum and G. roeseli (Crustacea: Amphipoda). Freshwater Biol. 23: 433-440.
Rajagopal, S., van der Velde, G., Paffen, B.G.P., van den Brink, F.W.B., and bij de Vaate, A. 1999: Life history and reproductive biology of the invasive amphipod Corophium
curvispinum (Crutacea: Amphipoda) in the Lower Rhine. Arch. Hydrobiol. 144: 305-325.
Ricciardi, A., and Rasmussen, J.B. 1998: Predicting the identity and impact of future biological invaders: a priority for aquatic resource management. Can. J. Fish. Aquat. Sci. 55: 1759-1765.
Ricker, W.E. 1979: Growth rates and models. Fish Physiol. 8: 677-743.
Savage, A.A. 1982: The survival and growth of Gammarus tigrinus Sexton (Crustacea: Amphipoda) in relation to salinity and temperature. Hydrobiologia 94: 201-212.
Sutcliffe, D.W., Carrick, T.R., and Willoghby, G.W. 1981: Effects of diet, body size, age and temperature on growth rates in the amphipod Gammarus pulex. Freshwater Biol. 11: 183-214.
Tanaka, M., and Kikuchi, T. 1980: Growth curves in Theotra lubrica (Semelidae). I: Fitting of several growth curves. Publ. Amakusa Mar. biol. Lab. 5: 201-214.
Teckelmann, U. 1974: Temperaturwirkungen auf Wachstum und Stoffwechsel kaltstenothermer Fließwassertiere. Arch. Hydrobiol. 74: 479-527.
Teichmann, W. 1982: Lebensläufe und Zeitpläne von Gammariden unter ökologishen Bedingungen. Arch. Hydrobiol. Suppl 64: 240-306.
Welton, J.S., and Clarke, R.T. 1980: Laboratory studies on the reproduction and growth of the Amphipod, Gammarus pulex (L.). J. Anim. Ecol. 49: 581-592.
Wijnhoven, S., van Riel, M.C., and van der Velde, G. 2003: Exotic and indigenous freshwater gammarid species: physiological tolerance to water temperature in relation to ionic content of the water. Aquat. Ecol. 37: 151-158.
Table 1 : Regression equations for the relationship between specific
growth rates, Gs. (% Lt.day-1) and mean size of cohorts. The
Gs-values were separated into 3 categories according to water
temperature T: T < 12°C; 12 ≤ T < 18°C; T ≥ 18 °C. n is the number of cohort, constants a and b are obtained with Gs = b .Lt + a, and r is the coefficient of determination.
T (°C) n b estimate a estimate r p Males T < 12 14 -0.071 1.488 0.57 0.0175 12 ≤ T < 18 11 -0.116 2.479 0.61 0.0235 T ≥ 18 27 -0.153 3.228 0.71 <0.0001 Females T < 12 7 -0.104 2.017 0.71 0.0357 12 ≤ T < 18 12 -0.167 3.004 0.80 0.0005 T ≥ 18 21 -0.187 3.382 0.76 <0.0001
Table 2 : Estimates of growth parameters of the equation 4. L∞ was
fixed to 23 mm for males and 20 mm for females. n is the number of observed growth rates. The coefficients of determination r for males (r = 0.50) and females (r = 0.56) are highly significant (p < 0.0001).
Parameter Estimate Std. dev. t-values df p
Males k 0.0999 0.0051 19.51 49 <0.0001 n = 52 α -0.4216 0.0663 -6.35 49 <0.0001 L∞ = 23 mm β -11.4318 1.1061 -10.34 49 <0.0001 Females k 0.1189 0.0036 32.65 37 <0.0001 n = 40 α 0.2781 0.0399 6.96 37 <0.0001 L∞ = 20 mm β 12.8432 1.1518 11.15 37 <0.0001
Table 3 : Mean Gs-values (Gs % Lt.day-1) observed in experimental conditions
Species Gs-values ages temperatures Sex Literature sources
G. duebeni 1.6 - 2.4% Juveniles 19-20°C Juveniles Kinne, 1959
G. duebeni 0.3 - 0.7% Young adults 19-20°C Males/Females Kinne, 1959
G. fossarum 0.8 % Young adults 20°C Males/Females Teckelmann, 1974
G. fossarum 1.3 % Young adults 20°C Males Pöckl, 1995
G. fossarum 1.1 % Young adults 20°C Females Pöckl, 1995
G. fossarum 0.9 % Young adults 15°C Males/Females Teckelmann, 1974
G. fossarum 1.1 % Young adults 15°C Males Pöckl, 1995
G. fossarum 0.9 % Young adults 15°C Females Pöckl, 1995
G. fossarum 0.9 % Young adults 12°C Males Pöckl, 1995
G. fossarum 0.7 % Young adults 12°C Females Pöckl, 1995
G. fossarum 0.6 % Young adults 10°C Males/Females Teckelmann, 1974
G. fossarum 0.7 % Young adults 8°C Males Pöckl, 1995
G. fossarum 0.6 % Young adults 8°C Females Pöckl, 1995
G. fossarum 0.2 % Young adults 5°C Males/Females Teckelmann, 1974
G. salinus 9.9 % Young juveniles 19-20°C Juveniles Kinne, 1960
G. salinus 6 % Juveniles 19-20°C Juveniles Kinne, 1960
G. zaddachi 9.4 % Young juveniles 19-20°C Juveniles Kinne, 1961
G. zaddachi 5 % Juveniles 19-20°C Juveniles Kinne, 1961
G. salinus 1 % Adults 19-20°C Males/Females Kinne, 1960
G. zaddachi 1 % Adults 19-20°C Males/Females Kinne, 1961
D. villosus 0.5 - 1.5% Young adults 7-8°C Males This study
D. villosus 1.1 - 1.3% Young adults 7-8°C Females This study
D. villosus 1 - 2.4% Young adults 13-16°C Males This study
D. villosus 1.6 - 1.8% Young adults 13-16°C Females This study
D. villosus 1.6 - 2.6% Young adults 18-22°C Males This study
Fig. 1: Example of a decomposition of a size-frequency distribution into several normal
distributions with the Battacharya method. The distribution provided is that of males, the first of September.
Fig. 2: Evolution of the mean length of the cohorts of males (a) and females (b) identified
between December 2000 and December 2001 using the Bhattacharya method. The isolated points were estimated using the Bhattacharya method, but could not be connected.
Fig. 3: Specific growth rates (Gs % Lt.day-1) plotted against mean length of cohort for D. villosus
males (a) and females (b). The curves for specific growth rates are drawn from the constants of the linear equations in Table 1. The Gs-values were separated into 3 categories according to water temperature T.
Fig. 4: Seasonal changes of the theoretical k(t)-values found with the Gompertz growth model for males and females along one year according to the temperatures.
Fig. 5: Simulation of growth for the three reproduction peaks for males (a) and females (b) using the Laird-Gompertz model associated with the environmental function. The dotted line represents the frequency of juveniles in the population.
Figure 1. Piscart et al. 0.00 2.00 4.00 6.00 8.00 10.00 12.00 14.00 16.00 18.00 5.00 6.00 7.00 8.00 9.00 10.00 11.00 12.00 13.00 14.00 15.00 16.00 17.00 18.00 19.00 Length (mm) N um be r of i ndi vi dua ls Raw date Normal distribution 3 Normal distribution 4 Normal distribution 5 Normal distribution 1 Normal distribution 2 0.00 2.00 4.00 6.00 8.00 10.00 12.00 14.00 16.00 18.00 5.00 6.00 7.00 8.00 9.00 10.00 11.00 12.00 13.00 14.00 15.00 16.00 17.00 18.00 19.00 Length (mm) N um be r of i ndi vi dua ls Raw date Normal distribution 3 Normal distribution 4 Normal distribution 5 Normal distribution 1 Normal distribution 2 Raw date Raw date Normal distribution 3 Normal distribution 3 Normal distribution 4 Normal distribution 4 Normal distribution 5 Normal distribution 5 Normal distribution 1 Normal distribution 1 Normal distribution 2 Normal distribution 2
Figure 2. Piscart et al. 6.0 8.0 10.0 12.0 14.0 16.0 18.0 20.0
Nov-00 Jan-01 Feb-01 Apr-01 Jun-01 Jul-01 Sep-01 Nov-01 Dec-01 6.0 8.0 10.0 12.0 14.0 16.0 18.0 20.0 M e a n l e n g th o f c o h o rt a b
Figure 3. Piscart et al. Gs -v a lu e s (% Lt .d a y-1) 0.0 0.5 1.0 1.5 2.0 2.5 3.0 3.5 6 8 10 12 14 16 18 0 0.5 1 1.5 2 2.5 3 3.5 6 7 8 9 10 11 12 13
Mean length of cohort (mm) a
b
■ T < 12 °C
▲12≤ T < 18 °C ● T ≥ 18 °C
Figure 4. Piscart et al. 0.2 0.4 0.6 0.8 1 1.2 1.4 1.6
Jan Feb Mar Apr May Jun Jul Aug Sep Oct Nov Dec Date k( t) 0 5 10 15 20 25 30 T em pe ra tu re ( °C ) Males Females Temperature
Figure 5. Piscart et al. F req u e n c y o f ju v e n il es L e n g th o f ad u lt s (m m ) 6 8 10 12 14 16 18 20 22 0 0.1 0.2 0.3 0.4 0.5 0.6 0.7 0.8 0.9 1 6 8 10 12 14 16 18 20 22 Jan-01 Mar-01 May-01 Jul-01 Sep-01 Nov-01 Jan-02 Mar-02 May-02 Jul-02 Sep-02 0 0.1 0.2 0.3 0.4 0.5 0.6 0.7 0.8 0.9 1 a b