HAL Id: hal-00304745
https://hal.archives-ouvertes.fr/hal-00304745
Submitted on 1 Jan 2002HAL is a multi-disciplinary open access archive for the deposit and dissemination of sci-entific research documents, whether they are pub-lished or not. The documents may come from teaching and research institutions in France or abroad, or from public or private research centers.
L’archive ouverte pluridisciplinaire HAL, est destinée au dépôt et à la diffusion de documents scientifiques de niveau recherche, publiés ou non, émanant des établissements d’enseignement et de recherche français ou étrangers, des laboratoires publics ou privés.
estuarine sediment cores and implications for the use of
sediment quality standards
K. L. Spencer, C. L. Macleod
To cite this version:
K. L. Spencer, C. L. Macleod. Distribution and partitioning of heavy metals in estuarine sediment cores and implications for the use of sediment quality standards. Hydrology and Earth System Sciences Discussions, European Geosciences Union, 2002, 6 (6), pp.989-998. �hal-00304745�
Distribution and partitioning of heavy metals in estuarine sediment cores: implications for sediment quality standards Hydrology and Earth System Sciences, 6(6), 989–998 (2002) © EGS
Distribution and partitioning of heavy metals in estuarine
sediment cores and implications for the use of sediment quality
standards
K.L. Spencer
1and C.L. MacLeod
21Department of Geology, Royal Holloway, University of London, Egham, TW10 OEX, UK
2Centre for Contaminated Land Remediation, Natural Resources Institute, The University of Greenwich, Chatham Maritime, ME4 7TB, UK Email for corresponding author: [email protected]
Abstract
Total metal concentrations in surface sediments and historically contaminated sediments were determined in sediment cores collected from three estuaries (Thames, Medway and Blackwater) in south-east England. The partitioning behaviour of metals in these sediments was also determined using a sequential extraction scheme. These data were then compared with sediment quality values (SQVs) to determine the potential ecotoxicological risk to sediment dwelling organisms. When total metal concentrations in surface sediments are examined, no risk to biota in any of the estuaries is indicated. However, when historically contaminated sediments at depth are also considered, risks to biota are apparent and are greatest for the Thames, followed by the Medway and then the Blackwater. This suggests that regulatory authorities should examine vertical metal profiles, particularly in estuaries that are experiencing low sediment accumulation rates where historically contaminated sediments are in the shallow sub-surface zone and where erosion or dredging activities may take place. When metal partitioning characteristics are also considered, the risk to biota is comparable for the Medway and the Blackwater with the potentially bioavailable fraction presenting no ecotoxicological risk. Conversely, over 70% of metals are labile in the Thames Estuary sediments and toxic effects are probable. This suggests that the application of SQVs using total sediment metal concentrations may over- or under-estimate the risk to biota in geochemically dissimilar estuarine sediments.
Keywords: sediment quality values, estuarine sediments, metal contamination, partitioning, sequential extraction.
Introduction
Sources of environmental contaminants to the coastal system are numerous and may enter the estuarine environment via a number of pathways. Metals may be present in the estuarine system as dissolved species, as free ions or forming organic complexes with humic and fulvic acids. Additionally, many metals e.g. Pb associate readily with particulates and become adsorbed or co-precipitated with carbonates, oxyhydroxides, sulphides and clay minerals. Consequently, sediments accumulate contaminants and may act as long-term stores for metals in the environment. Exposure of sediment-dwelling organisms to metals may then occur via uptake of interstitial waters, ingestion of sediment particles and via the food chain (Luoma, 1989). The relationship between water quality and effects on biota
is well understood and has led to the development of UK Environmental Quality Standards for water. There is however, a poor correlation between total sediment metal concentrations and biological effects (Allen, 1996). Further understanding of this relationship is clearly required to make effective, economic and scientifically justified decisions on the need for the remediation of contaminated sediments (Chapman et al., 1999) and for the disposal and beneficial re-use of dredged sediment.
A multi-tiered assessment approach is widely recognised as being the most effective way to conduct an ecological risk assessment (ERA) (Hill et al., 2000). The number and content of tiers may vary between administrative bodies but, in principle, the first tier should include a screening-level risk assessment (SLRA) followed by a detailed-level risk
assessment (DLRA) in the subsequent tiers. The SLRA should be broad in scope and aim to identify all contaminants of potential concern. At this level it may be appropriate to use formal prescriptive screening values and these should be highly conservative to ensure that no risks are underestimated and consequently, have a high level of uncertainty (Hill et al., 2000). This leaves the subsequent tiers of the ERA to focus on obtaining reliable risk estimates, hence reducing uncertainties. A full ERA framework for evaluating contaminated sediments may be extremely effective but can be prohibitively expensive to apply routinely to all situations (Chapman and Mann, 1999). Consequently, it is also of considerable importance that the screening values used are not overly conservative and this can be a difficult balance to achieve.
A variety of sediment quality standards (SQSs), guidelines (SQGs) and screening values (SQVs) exists for metals around the world. In the UK, no sediment quality values exist as yet. However, an appraisal of how SQVs have been derived around the world and an understanding of their limitations will undoubtedly provide a basis for the development of legislative guidelines in the UK.
There are two basic approaches used to derive SQVs. The first, an empirical approach, involves matching sediment chemistry with biological effects and principally involves the use of bioassays or toxicity testing. The second, a mechanistic approach, is based on the application of equilibrium partitioning (EqP) (Chapman et al., 1999) which combines with water quality criteria to obtain sediment contaminant concentrations that, in theory, would give rise to water quality concentrations equivalent to the set criterion. These data are frequently normalised to sediment organic carbon concentrations in an attempt to compensate for differences in the bioavailability of contaminants in different samples (e.g. Webster and Price, 1994). However, the inappropriate application of EqP has received some criticism (Wang et al., 1999). As an example, although no national methodologies have yet been employed in the US, NOAA (National Oceanographic and Atmospheric Administration) has developed a comprehensive set of SQVs. These, derived after consultation with numerous US and Canadian authorities, are based on a number of international approaches and are likely to be the basis for USEPA guidelines. Their SQVs are primarily effects based using a combination of laboratory sediment bioassays and in situ biological effects observed in organisms. The USEPA guidelines are also likely to include the use of EqP for certain non-polar chemicals.
The use of such formal conservative sediment screening values in the first tier of an ERA is not site specific and as such cannot take into consideration site specific factors such
as bioavailability. Bioavailability will vary depending on the nature of metal particle associations, the mechanisms of metal release from sediments and variation in exposure routes (Chapman et al., 1998). Consequently, toxicological effects may vary considerably between sediments with different physicochemical parameters, such as acid volatile sulphide (AVS), organic carbon content and grain size (Ankley et al., 1993). Clearly, there is a need to incorporate more site specific information into the later tiers of an ERA during the risk assessment and decision making process, but it may also be important to consider some physicochemical parameters during SLRA to avoid over conservatism.
The Netherlands and a number of other countries include only surface sediments in the SLRA procedure. However, there is a strong relationship between AVS and toxicity and, as AVS varies with depth through the sediment profile, it is important to look at horizon specific chemical data rather than homogenised or surface samples as this may not reflect the true exposure to sediment dwelling organisms (Ankley
et al., 1996). Additionally, examination of surface samples
does not account for reworking of older, possibly historically contaminated sediments and the potential release of metals back to the aquatic environment.
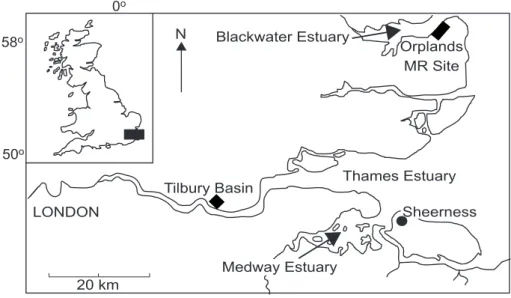
Here, sediment metal data collected during three independent studies of estuarine sediments in south-eastern England (Fig. 1) are compared. Vertical and spatial sediment metal data from all three sites have been published previously (Spencer, 2002; Spencer et al., in press; O’Reilly Wiese et al., 1997; Emmerson et al., 1997, 2000) but have not been considered with respect to sediment quality. The sites are from three different regimes within the Greater Thames Estuary. The Medway Estuary, Blackwater Estuary (Orplands Farm Managed Retreat Site) and Thames Estuary (Tilbury Basin) were chosen to highlight the effects of differences in depositional regime, pollutant inputs and sediment partitioning characteristics. Both the Thames and the Medway have experienced considerable historical contaminant inputs with expanding industrialisation and human population growth in south-eastern England throughout the 19th and 20th centuries (Wood, 1980). Consequently, metal concentrations are elevated at depth within these sediments (Spencer et al., in press). Due to rising sea level, most estuaries along the east coast of England are suffering extensive erosion (Pye and French, 1993) and, therefore, taking into account the historical record of industrial pollution in the local area (French, 1993), pollutants may be released into the water body. Therefore, evaluation of sediment chemistry at depth may be important for the three study sites. Many of these historically contaminated sediments are being dredged and disposal of
Distribution and partitioning of heavy metals in estuarine sediment cores: implications for sediment quality standards
dredged materials remains a concern for the local ports authorities. There is a desire to re-use the sediments within the estuaries either as fill material on shore or to re-establish some of the eroding salt marshes. Additionally, the ports authorities wish to use water injection dredging (WID), whereby bottom sediments are fluidised and then moved under gravity by water jets. The impact that re-deposited sediment may have on local sediment quality is as yet unknown.
In this study, total and partitioned sediment data have been compared with marine sediment screening values used by NOAA. These screening values are based on a wide range of international approaches and are widely available. Additionally, total metal concentrations have been examined at depth to determine whether historically contaminated sediments may present a risk to biota and, hence, should be considered when setting SQVs.
Study sites
MEDWAY ESTUARY, KENT
The Medway Estuary has been chosen for this study as it represents an estuary with low but appreciable levels of metal contamination. Values for metals in mud flat and salt marsh sediments are within the mid to lower range of values observed for UK estuarine sediments (Bryan and Langston, 1992) and therefore present an ‘average’ for estuaries in the UK (Spencer, 2002). The Medway Estuary has never been a major fishery; however, it is an important breeding ground and nursery for several species of fish. In recent years, the fish population has begun to increase in numbers
and species diversity (Kent County Council, 1997). The River Medway is a major tributary of the River Thames, joining it at Sheerness, Isle of Sheppey (Fig. 1). The River Medway drains an area of 1761 km2 (Pethick, 1993) and
opens downstream into a flat-floored valley up to 8 km across.
Historically, the Medway Estuary has received pollution from many sources. Since the 1600s, a naval seaport has been situated on the coast at Rochester and there is extensive archaeological evidence in the salt marshes indicating Cu smelting during Roman times (Kent County Council, 1997). Halfway through the 19th century, extensive dockyards were built at Chatham and Rochester, housing a variety of industries and by the late 1800s three large Naval basins had also been excavated (Preston, 1977). A legacy of contamination in the old naval dockyards, has been a focus for recent remediation and regeneration in the area. More recently, many industrial facilities have been established in the lower reaches of the estuary, including a power station at Kingsnorth and an oil refinery on the Isle of Grain. Sheerness is a large and expanding port receiving large volumes of river traffic daily. At the mouth of the estuary, there are inputs from chemical works and metal refineries. Within the main estuary, two sewage treatment works were permitted until 2000 to discharge primary treated effluent directly to the estuary. The main discharges from upstream within the catchment area are effluents from a large pesticide plant, paper and chemical industries, timber treatment plants and a number of private and public sewage treatment works (National Rivers Authority, 1991). Four sediment cores, up to 70 cm in depth, were selected from mature vegetated salt marsh and inter-tidal mud flat sites within the Estuary.
Thames Estuary Medway Estuary LONDON Sheerness 0o 50o 58o Blackwater Estuary Orplands MR Site Tilbury Basin 20 km N
ORPLANDS FARM, BLACKWATER ESTUARY, ESSEX The Blackwater is a small estuary connecting the River Chelmer and River Blackwater with the outer Thames Estuary and southern North Sea (Fig. 1). It drains an area of c.1200 km2 with predominantly agricultural land use.
Orplands Farm is on the southern shore of the estuary and comprises 44 hectares of reclaimed salt marsh. Economic appraisals of this stretch of coastline indicated that repair of decaying sea walls was no longer viable and, as a result, in 1995 Orplands Farm was selected for the first full-scale trial of managed realignment (MR) in the UK. Since controlled breaching of the sea walls in 1995, there has been an increase in sediment deposition and increased loadings of both heavy metals (except Cd) and marine associated metals to the sediments (MacLeod et al., 1999). Levels of metals in the sediments of the Blackwater Estuary are low with the main inputs being from the Bradwell nuclear power station, urban run-off and sewage treatment works (Emmerson et al., 1997). Until the late 20th century this estuary was a major oyster fishery in the UK. However, disease, thought to be associated with poor sediment quality devastated the oyster population and it has yet to recover. The estuary remains a popular fishing ground for a number of species of fish.
The 30 cm core discussed in this paper was collected two years after breaching. Prior to breaching, this site was used as grazing pasture and was covered with thick meadow grasses.
TILBURY BASIN, THAMES ESTUARY, ESSEX
Tilbury Basin is a disused dock on the Thames Estuary where a considerable depth of sediment has accumulated (Fig. 1). It was built in the 1880s, was dredged periodically until 1967 and is in open connection with the mud reaches of the Thames. Sediment metal concentrations here are high, probably as a result of intense industrial activity along this stretch of the estuary including a battery recycling and neutralising plant, cement works, paper mills and metal refining. However, there has been a general decline in industry along this stretch of the Thames since the mid 1970s (North Sea Task Force, 1993). Additionally, Beckton and Crossness, two of the largest sewage treatment works in Europe, are situated approximately 20 km upstream. The decay of the Thames Estuary in the 19th and 20th centuries and its impact on the fish population has been well documented (e.g. Andrews and Rickard, 1980). Improvements to water quality in the 1980s have led to an increase in the number and diversity of fish; salmon have now been observed in the Thames Estuary and their numbers are continuing to increase (Wood, 1980).
A 10 m sediment core was collected from Tilbury Basin for analysis.
Experimental procedures
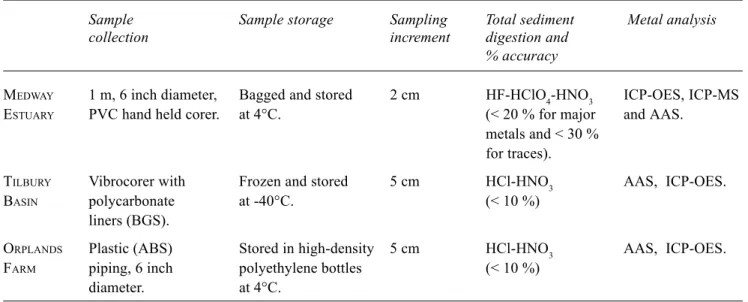
Methods for sediment collection, storage, preparation and total metal analysis vary for each study (Table 1) and full details are presented elsewhere (O’Reilly Wiese et al., 1997; MacLeod et al., 1999; Spencer et al., in press). Data quality control procedures were similar for all three studies. Analytical precision was monitored by running triplicates and was generally <15% relative standard deviation (RSD) for major and trace elements. Accuracy was assessed by comparing reference sample determinations (PACS-1: National Research Council of Canada, CRM-270, 277, 320 and 367: Community Bureau of Reference) with recorded values. Percentage accuracy is given in Table 1 and is poorest for the HF-HClO4 digestion scheme. Typically, the rate of recovery for some metals e.g Cr may be low where an HF-HClO4 digestion scheme has not been used due to the incomplete dissolution of refractory minerals (Cook et al., 1997). However, this does not appear to be an issue for this study. All three studies used the same sequential extraction scheme and this is detailed below.
Wet sediment samples from each depth increment were leached sequentially using a five-step extraction scheme developed by Tessier et al. (1979). Samples were not collected or digested under an oxygen free environment; hence, metal sulphides may have been oxidised during storage or solubilised during steps 1-3 of the extraction scheme (Rapin et al., 1986). The use of sequential extraction schemes has been studied widely and a number of drawbacks makes the interpretation of data difficult (Martin et al., 1987). However, sequential extraction schemes can still be used to provide first order information regarding sediment-metal associations and to differentiate between sediments with similar bulk chemistry but differing physicochemical characteristics (Li et al., 1995). Additionally, sequential extraction schemes are increasingly considered useful tools for assessing potential metal mobility, bioavailability and toxicity in contaminated sediments and soils (Bryan and Langston, 1992; Davidson et al., 1998). The procedure used here extracts metals selectively from sediment phases using successively aggressive reagents [MgCl2 (exchangeable), NaOAc (carbonates), NH2OH.HCl (Fe/Mn oxides), H2O2 (organic/sulphidic) and HF-HClO4 (residual)]. The final stage of the extraction scheme was replaced with an HCl-HNO3 digest for samples collected from Tilbury Basin and Orplands Farm to retain consistency with the total metal digestion procedure used for those sites. Although it is recognised that the sequential extraction procedure is
Distribution and partitioning of heavy metals in estuarine sediment cores: implications for sediment quality standards
defined operationally, the metal associations frequently described are shown in parenthesis. These terms will be used throughout this paper. The extractants were converted to a HNO3 matrix following the procedure of Li et al. (1995) to reduce matrix effects and allow analysis of the extractants by ICP-OES, ICP-MS and flame AAS techniques. Precision was measured by running all samples in duplicate or triplicate. Percentage RSDs were <20% for trace metals.
Results
Total metal sediment data for the Medway Estuary, Orplands MR site and Tilbury Basin are presented as core averages in Table 2. The data from four inter-tidal sites for the Medway indicate that there is considerable spatial variability between sites within the estuary. Highest values for metals are generally found in mud flat cores located close to Chatham Dockyards. This spatial variability is due to
different proximities to contaminant sources and is discussed in detail elsewhere (Spencer, 2002). As seen in Table 2, the difference between the core mean metal concentration and the surface concentration is not large while the range of concentrations measured with depth can vary significantly. Mean and surface concentrations of Cr, Cu and Zn are highest for Tilbury Basin and the Medway Estuary and lower concentrations are found in the Orplands MR site. Nickel concentrations are comparable at all three sites and are similar to Ni concentrations in pre-industrial sediments in a dated sediment core collected from the Medway Estuary (Spencer et al., in press); this suggests that this metal is present at local geochemical background concentrations for south-east England. Lead concentrations are more variable but again generally show highest concentrations in Tilbury Basin. These results are consistent with the known industrial histories of the three study sites. The range of metal values for the Orplands MR site is quite small suggesting that metal
Table 1. Comparison of techniques used for sample collection, preservation and analysis.
Sample Sample storage Sampling Total sediment Metal analysis collection increment digestion and
% accuracy
MEDWAY 1 m, 6 inch diameter, Bagged and stored 2 cm HF-HClO4-HNO3 ICP-OES, ICP-MS ESTUARY PVC hand held corer. at 4°C. (< 20 % for major and AAS.
metals and < 30 % for traces).
TILBURY Vibrocorer with Frozen and stored 5 cm HCl-HNO3 AAS, ICP-OES.
BASIN polycarbonate at -40°C. (< 10 %)
liners (BGS).
ORPLANDS Plastic (ABS) Stored in high-density 5 cm HCl-HNO3 AAS, ICP-OES.
FARM piping, 6 inch polyethylene bottles (< 10 %)
diameter. at 4°C.
Table 2. Concentration of metals observed in sediment cores collected from the Medway Estuary, Orplands MR site
and Tilbury Basin (after O’Reilly Wiese et al., 1997; Emmerson et al., 2003; Spencer, 2000).
MEDWAY ORPLANDS TILBURY
Concentration (µg g–1)
mean range surface mean range surface mean range surface
Cr 91 31–144 78 32 19–46 33 NA NA NA
Cu 53 21–343 47 21 13–39 26 89 32–145 69
Ni 33 14–49 31 34 18–44 38 46 30–70 30
Pb 96 20–296 79 21 7–116 17 144 25–204 130
Zn 175 61–338 172 87 66–144 90 290 107–411 203
concentrations vary little with depth.
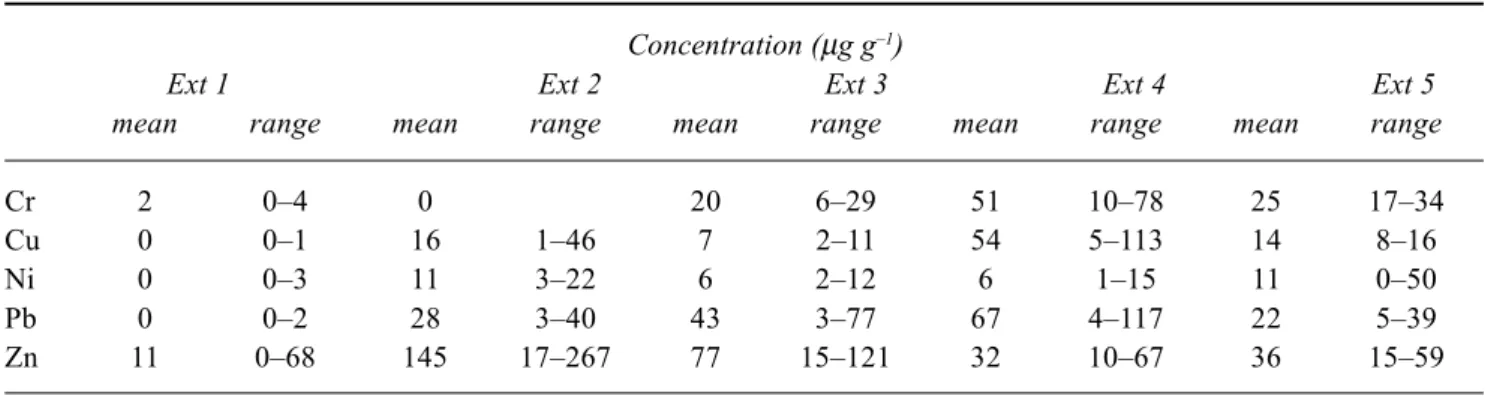
Partitioning data for sediment cores collected from the Tilbury Basin, Medway Estuary and Orplands MR site are given in Tables 3, 4 and 5, respectively. In this study, increased mobility has been estimated by calculating the percentage of metals that were partitioned in extracts 1–4 (Fig. 2); this may also provide an indication of potential bioavailability. While this is not an accurate prediction of bioavailability, stronger correlations exist between chemical extractions and bioavailability than between total metal concentrations and bioavailability (Luoma, 1989). By examining those metals in extracts 1–4, metal forms which are relatively immobile and therefore probably unavailable, have been excluded allowing comparison between sediments with differing physicochemical characteristics.
Percentage ‘potential bioavailability’ for all metals is greatest in sediments collected from Tilbury Basin with over 70% of metals partitioned towards fractions 1–4 (Fig. 2). Notably, although mean and surface metal concentrations are higher in the Medway Estuary than the Orplands MR site, metals are potentially more bioavailable in the Orplands MR site. For the sediments collected from the Medway Estuary, the final residue was digested using a HF-HClO4 total sediment digest which has higher recoveries of most metals compared with the HCl digest used for the other two sites (Cook et al., 1997). This higher recovery may lead to a slightly lower estimate of potential bioavailability for the Medway sediments, although this is unlikely to alter the trends observed significantly.
Discussion
COMPARISON WITH SEDIMENT QUALITY VALUES Sediment quality values are a useful tool for evaluating the
potential for contaminants within sediments to induce biological effects. Here, metal data from the Medway Estuary, Orplands MR site and Tilbury Basin have been compared with SQUIRT (screening quick reference table) to assess whether these inter-tidal sediments would breach these values and, hence, require further investigation under an ERA framework. SQUIRT was developed by NOAA for screening purposes. The guideline values are divided into five increasing categories of observable effects (Table 6) which have been derived through the use of several different approaches (Buchman, 1999).
Many regulatory authorities apply SQVs only to surface sediments. Comparing total metal concentrations in surface sediments to the probable effects levels (PEL) in Table 7, all the sediments tested would lie below the PEL except for Pb in the Tilbury Basin surface sediments. The average surficial Pb concentration at Tilbury is >112 µg g–1 indicating
that any organisms living within this sediment could potentially experience adverse effects. However, previous work (Spencer et al., in press; O’Reilly Wiese et al., 1997) indicates that maximum sediment metal concentrations at these sites may lie at depth in the sediments, reflecting earlier industrial inputs. By comparing maximum total metal concentrations in the sediments to SQUIRT guidelines in Table 7, both sediments from the Medway Estuary and Tilbury Basin would lie above the PEL for Cu, Ni, Pb and Zn, while no sediments from Orplands would fail.
Increased input of metals to the Medway and Thames began in the 1850s and then continued throughout the mid 20th century as a result of increased population growth and industrialisation. However, sediment accumulation rates calculated for the Medway Estuary and Tilbury Basin vary considerably (Spencer et al., in press; O’Reilly Wiese et
al., 1997) resulting in peak metal concentrations occurring
at very different depths. In the Medway Estuary
0 10 20 30 40 50 60 70 80 90 Cr Cu Ni Pb Zn Tilbury Medway Orplands % metal in the bioavailable fraction
Distribution and partitioning of heavy metals in estuarine sediment cores: implications for sediment quality standards
Table 3. Partitioning of metals (Tilbury Basin)
Concentration (µg g–1)
Ext 1 Ext 2 Ext 3 Ext 4 Ext 5 mean range mean range mean range mean range mean range
Cr 2 0–4 0 20 6–29 51 10–78 25 17–34
Cu 0 0–1 16 1–46 7 2–11 54 5–113 14 8–16
Ni 0 0–3 11 3–22 6 2–12 6 1–15 11 0–50
Pb 0 0–2 28 3–40 43 3–77 67 4–117 22 5–39
Zn 11 0–68 145 17–267 77 15–121 32 10–67 36 15–59
Table 4. Partitioning of metals (Medway Estuary)
Concentration (µg g–1)
Ext 1 Ext 2 Ext 3 Ext 4 Ext 5 mean range mean range mean range mean range mean range
Cr nd nd nd nd 2 1–4 5 3–11 26 23–46
Cu nd nd nd nd 1 0–3 1 1–9 18 10–23
Ni nd nd nd nd 4 2–7 3 2–5 14 9–18
Pb nd nd nd nd 19 3–138 7 1–51 19 8–66
Zn nd nd nd nd 26 9–40 18 3–61 76 54–101
nd = below detection limit
Table 5. Partitioning of metals (Orplands MR site)
Concentration (µg g–1)
Ext 1 Ext 2 Ext 3 Ext 4 Ext 5 mean range mean range mean range mean range mean range
Cr 0 — 2 1–2 2 1–3 4 2–5 14 3–25
Cu 0 0-1 0 0–1 0 0–1 2 1–4 6 2–9
Ni 1 0-2 1 0–1 3 1–5 2 1–3 5 1–9
Pb 0 0-1 1 1–3 4 2–8 4 2–8 6 1–11
Zn 1 0-3 1 1–2 12 5–19 6 2–17 18 4–30
Table 6. Sediment guidelines and definitions used in SQUIRT
SEDIMENT GUIDELINE
Threshold Effects Level Maximum concentration at which no effects are observed Effects Range Low 10th percentile values in effects
Probable Effects Level Lower limit of the range of concentrations at which adverse effects are always observed Effects Range Median 50th percentile value in effects
accumulation rates are low and variable (0.18-0.33 cm yr-1)
with sub-surface maxima occurring at 10–16 cm depth. Sediments at these depths may easily be inhabited by sediment dwelling organisms such as Macoma balthica, which may burrow up to 40 cm deep suggesting that an understanding of sediment quality at depth at this site is very important and should be considered in the first tier of an ERA. Inter-tidal mud flat and salt marsh sites in the Medway Estuary are also eroding, potentially releasing contaminated sediments back to the estuarine system (Pethick, 1993; Pye and French, 1993). Additionally, the Medway Ports Authority is carrying out an extensive programme of traditional dredging and water injection dredging which may also disturb sub-surface sediments.
Conversely, Tilbury Basin has experienced very high sediment accumulation rates varying from 0.1–3.8 m yr–1
since 1966 (O’Reilly Wiese et al., 1997). Consequently, maximum metal concentrations occur several metres below the sediment surface. In comparison with the Medway Estuary, it is less likely to present a risk to burrowing organisms and these sediments are far less likely to be disturbed by dredging activities. Hence, although average and surface metal concentrations are lower in the Medway Estuary, contaminated sediments at relatively shallow depths in an estuary experiencing erosion may present considerable risk to sediment dwelling biota.
One of the key aims in developing SQVs is to predict and minimise risk to biota. Therefore, an understanding of the relationship between sediment metal concentrations and toxicity to biota is important. Assessment of mean total metal sediment data for the study sites indicates that sediments from Tilbury Basin present the greatest risk to biota, followed by the Medway Estuary and then Orplands MR site. Analysis of the partitioning of metals in these sediments indicates that the percentage of metals associated with extracts 1–4 differs considerably between sites and this may indicate relative differences in bioavailability. Total mean
metal concentrations are much higher in the Medway Estuary than Orplands MR site but, due to differences in metal partitioning behaviour, comparable concentrations of metals were extracted during stages 1–4 of the sequential extraction scheme. This suggests that analysis of total metal data may not reflect, accurately, potential bioavailability in these sediments and hence is not a good parameter to measure for assessing risk to biota. By examining the concentrations in the bioavailable fractions it is seen that for both the Medway Estuary and Orplands MR site, the bioavailable concentrations for all metals are less than the threshold effects level (TEL) indicating that no adverse biological effects are likely to occur. However, > 70% of the metals in the Tilbury Basin sediments are potentially bioavailable. The average concentration of the Tilbury Basin bioavailable fraction for all metals indicates that toxic effects are probable and in the instance of the redevelopment of this site it would suggest that a full ERA should be performed. This is a stronger indication than was observed with the total metal data suggesting that when developing SQVs for the UK partitioning data may be useful.
Conclusions
The application of SQVs to surface sediments alone may under-estimate the risk to burrowing organisms if either low sediment accumulation rates or recent inputs of metals to the estuarine system result in metal maxima in the shallow sub-surface zone. This is of particular pertinence when the primary use for these SQVs is in the initial screening of sediments in the early stages of an ERA, where hazard identification and conservatism are important. Additionally, in areas of south-east England where inter-tidal sediments are being eroded or dredged, there is a risk that these historically contaminated sediments may be released to the aquatic environment. Therefore, it is important for regulatory authorities to consider metal variability within the vertical
Table 7. Screening Quick Reference Table for heavy metals in marine sediment (Buchman, 1999).
All concentrations in µg g–1.
Threshold Effect Probable Effects Effects Range Apparent Effects Threshold Effects Level Range Low Level (PEL) Median (AET)
(TEL) (ERL) (ERM)
Cr 52.3 81.0 160 370 62 (Neanthes)
Cu 18.7 34.0 108 270 390 (Microtox & Oyster Larvae)
Ni 15.9 20.9 42.8 51.6 110 (Echinoderm Larvae)
Pb 30.2 46.7 112 218 400 (bivalve)
Distribution and partitioning of heavy metals in estuarine sediment cores: implications for sediment quality standards
core profile rather than homogenised or surface samples, as they may not reflect the true exposure of aquatic organisms to metal contamination.
It is recognised that toxicological effect varies with changing physicochemical characteristics in sediments (Ankley et al., 1996). In this study, it was not possible to compare characteristics such as organic carbon or AVS content due to the variability in methodologies used. However, these sediments do show considerable differences in the way that metals are partitioned to different sediment fractions. Initial investigation of these sediments suggests that potential for risk to biota would be greatest for Tilbury Basin, followed by the Medway Estuary and then Orplands MR site based on analysis of total metal sediment data. However, analysis of sequential extraction data suggests that concentrations of mobile and therefore potentially bioavailable metals are similar for the Medway Estuary and Orplands MR site. Hence, analysis of total metal data alone may have over-estimated the risk to biota for the Medway Estuary sediments by comparison with Orplands MR site. This highlights the need for a greater understanding of metal behaviour in sediments and the incorporation of these data into SQVs if accurate predictions of sediment toxicity are to be made.
Acknowledgements
K. Spencer would like to thank Dr David Wray and the University of Greenwich, School of Earth and Environmental Sciences for a research studentship. C. MacLeod would like to thank the Essex Local Flood Defence Committee and the UK Environment Agency for financial support.
References
Allen, H.E., 1996. Standards for metals should not be based on total concentrations. SETAC News, 19, 6, 18–19.
Andrews, M.J. and Rickard, D.G., 1980. Rehabilitation of the inner Thames Estuary. Mar. Pollut.Bull., 11, 327–332.
Ankley, G.T., Mattson, V.R., Leonard, E.N., West, C.W. and Bennett, J.L., 1993. Predicting the acute toxicity of copper in freshwater sediments: Evaluation of the role of acid volatile sulphides. Environ. Toxicol. Chem., 12, 315–320.
Ankley, G.T., Di Toro, D.M., Hansen, D.J. and Berry, W.J., 1996. Technical basis and proposal for deriving sediment quality criteria for metals. Environ. Toxicol. Chem., 15, 2056–2066. Anon., 1999. Environmental Risk Limits in the Netherlands, RIVM
report 601640001, Parts I-IV. Dutch National Institute of Public Health and the Environment (RIVM), Bilthoven, The Netherlands.
Bryan, G.W. and Langston, W.J., 1992. Bioavailability, accumulation and effects of heavy metals in sediments with special reference to United Kingdom estuaries: a review.
Environ. Pollut., 76, 89–131.
Buchman, M.F., 1999. NOAA screening quick reference tables. NOAA HAZMAT Report 99-1, Seattle, WA, Coastal Protection and Restoration Division, National Oceanic and Atmospheric Administration, 12 pp.
Chapman, P.M. and Mann, G.S., 1999. Sediment quality values (SQVs) and ecological risk assessment. Mar. Pollut. Bull., 38, 339–344.
Chapman P. M., Wang, F. Y., Janssen, C., Persoone, G. and Allen, H. E., 1998. Ecotoxicology of metals in aquatic sediments: binding and release, bioavailability, risk assessment, and remediation. Can. J. Fiseries Aquat. Sci., 55, 2221–2243. Chapman, P.M., Allard, P.J. and Vigers, G.A., 1999. Development
of sediment quality values for Hong Kong special administrative region: A possible model for other juridictions. Mar. Pollut.
Bull., 38, 161-169.
Cook, J.M., Gardener, M.J., Griffiths, A.H., Jesseps, M.A., Ravenscroft, J.E. and Yates, R., 1997. The comparability of sample digestion techniques for the determination of metals in sediments Mar. Pollut. Bull., 34, 637–644.
Davidson, C. M., Duncan, A. L., Littlejohn, D., Ure, A. M. and Garden, L. M., 1998. A critical evaluation of the three-stage BCR sequential extraction procedure to assess the potential mobility and toxicity of heavy metals in industrially-contaminated land. Anal. Chim. Acta., 363, 45–55.
Emmerson, R.H.C., O’Reilly-Wiese, S.B., MacLeod, C.L. and Lester, J.N., (1997), A multivariate assessment of metal distribution in inter-tidal sediments of the Blackwater Estuary, UK. Mar. Pollut. Bull., 34, 960–968.
French, P.W., 1993. Post-industrial pollutant levels in contemporary Severn estuary inter-tidal sediments, compared to pre-industrial levels. Mar. Pollut. Bull., 26, 30–35. Hill, R.A., Chapman, P.M., Mann, G.S. and Lawrence, G.S., 2000.
Level of detail in ecological risk assessments. Mar. Pollut. Bull.,
40, 471–477.
Kent County Council, 1997. The North Kent Marshes Initiative:
Medway Estuary and Swale Management Plan. Kent County
Council, Tonbridge, Kent.
Li, X., Coles, B.J., Ramsey, M.H. and Thornton, I., 1995. Sequential extraction of soils for multi-element analysis by ICP-AES. Chem. Geol., 124, 109–123.
Luoma, S.N., 1989. Can we determine the biological availability of sediment-bound trace metals. Hydrobiologia, 176/177, 379– 396.
MacLeod, C.L., Scrimshaw, M.D., Emmerson, R.H.C., Chang, Y.-H. and Lester, J.N., 1999. Geochemical changes in metal and nutrient loading at Orplands Farm Managed Retreat Site, Essex, UK (April 1995-1997). Mar. Pollut. Bull., 38, 1115–1125. Martin, J.M., Nirel, P. and Thomas, A.J., 1987. Sequential extraction schemes: promises and problems. Mar. Chem., 22, 313–341.
National Rivers Authority, 1991. River Medway Catchment
Management Plan Phase 1. NRA, Southern Region, Worthing,
Sussex, UK.
North Sea Task force, 1993. North Sea Quality Status Report 1993. Oslo and Paris Commissions, HMSO, London.
O’Reilly Wiese, S.B., Emmerson, R.H.C., MacLeod, C.L. and Lester, J.N., 1997. Trends in mobility of metals in the Thames Estuary in recent decades and the implications with regard to metal transport to Essex salt marsh areas. Estuaries, 18, 494– 503.
Pethick, J.S., 1993. The Medway Estuary; Coastal Processes and
Conservation. Insitute of Coastal and Estuarine Studies,
University of Hull, Hull.
Preston, J.M., 1977. Industrial Medway, an Historical Overview, W & J Mackay Ltd., Chatham.
Pye, K. and French, P.W., 1993. Erosion and accretion processes
on British saltmarshes. A final report to MAFF, Vol 1–5,
Cambridge Environmental Research Consultants, Cambridge, UK.
Rapin, F., Tessier, A., Campbell, P.G.C. and Carignan, R., 1986. Potential artifacts in the determination of metal partitioning in sediments by a sequential extraction procedure. Environ. Sci.
Tech., 20, 836–840.
Shea, D., 1988. Developing national sediment quality criteria.
Environ. Sci. Tech, 22, 1256–1261.
Spencer, K.L., 2002. Spatial variability of metals in the inter-tidal sediments of the Medway Estuary, Kent, UK. Mar. Pollut. Bull., 44, 933–944.
Spencer, K.L., Cundy, A.B. and Croudace, I.W., Heavy metal distribution and early-diagenesis in salt marsh sediments from the Medway Estuary, Kent, U.K. Estuar.Coast. Shelf Sci., (in press).
Tessier, A., Campbell, P.G.C. and Bisson, M., 1979. Sequential extraction for the speciation of particulate trace metals. Anal.
Chem., 51, 844–851.
Wang, F., Chapman, P.M. and Allen, H.E., 1999. Misapplication of equilibrium partitioning coefficients to derive sediment quality values. Mar. Pollut. Bull., 38, 423–425.
Webster, J. and Ridgeway, I., 1994. The application of the equilibrium approach for establishing sediment quality criteria at two UK sea disposal and outfall sites. Marine Pollut. Bull.,
28, 653–661.
Wood, L.B., 1980. The rehabilitation of the tidal River Thames.