HAL Id: hal-00304938
https://hal.archives-ouvertes.fr/hal-00304938
Submitted on 1 Jan 2004HAL is a multi-disciplinary open access archive for the deposit and dissemination of sci-entific research documents, whether they are pub-lished or not. The documents may come from teaching and research institutions in France or abroad, or from public or private research centers.
L’archive ouverte pluridisciplinaire HAL, est destinée au dépôt et à la diffusion de documents scientifiques de niveau recherche, publiés ou non, émanant des établissements d’enseignement et de recherche français ou étrangers, des laboratoires publics ou privés.
on gley soils: the Nant Tanllwyth, Plynlimon mid-Wales
C. Neal, B. Reynolds, M. Neal, H. Wickham, L. Hill, B. Williams
To cite this version:
C. Neal, B. Reynolds, M. Neal, H. Wickham, L. Hill, et al.. The water quality of streams draining a plantation forest on gley soils: the Nant Tanllwyth, Plynlimon mid-Wales. Hydrology and Earth System Sciences Discussions, European Geosciences Union, 2004, 8 (3), pp.485-502. �hal-00304938�
The water quality of streams draining a plantation forest on gley
soils: the Nant Tanllwyth, Plynlimon mid-Wales
Colin Neal
1, Brian Reynolds
2, Margaret Neal
1, Heather Wickham
1, Linda Hill
1and Bronwen
Williams
21Centre for Ecology and Hydrology, Wallingford, OXON, OX10 8BB, UK
2Centre for Ecology and Hydrology, University of Wales Bangor, Deniol Road, Bangor, Gwynedd, LL57 2UP, UK
Email for corresponding author: [email protected]
Abstract
The water quality of the Nant Tanllwyth stream in the Plynlimon region of mid-Wales is related to the key hydrobiogeological controls and the effects of conifer harvesting based on an analysis of rain, cloud, stream and groundwater measurements. The results show the normal patterns of stream water quality response to hydrology. Thus, there is a high damping of atmospheric inputs due to storage in a highly heterogeneous soil and groundwater system. Correspondingly, there is a highly dynamic response for components such as calcium, bicarbonate and aluminium. This response links to the relative inputs of acidic and aluminium-bearing soil waters under high flow conditions and base enriched bicarbonate bearing waters from the groundwater areas under baseflow conditions. The introduction of a deep borehole near the main stem of the river opened up a groundwater flow route to the stream and other parts of the catchment. There were two aspects to this. Firstly, it caused a change to the stream water quality, particularly under baseflow conditions, by increasing the concentrations of calcium and magnesium and by reducing the acidity. The monitoring shows that this change has persisted for over eight years and that there is no sign of reversion to pre-borehole times. Secondly, it caused a change in the groundwater level and chemistry at a borehole on the other side of the river. This feature shows that the fracture system is of hydrogeochemical and hydrogeological complexity. The effects of conifer harvesting are remarkable. At the local scale, felling leads to the expected short term increase in nitrate, ammonium and phosphate from the disturbance of the soil and the reduction in uptake into the vegetation. Correspondingly, there is a reduction in sodium and chloride linked to reduced scavenging of atmospheric inputs from cloud water by the vegetation and also due to increased dilution potential due to reductions in transpiration by the trees. However, within the main stream, virtually no change is observed in stream water quality with felling, except for a decrease rather than an expected increase in nitrate concentration. It seems that the increase in phosphate, for a system that is essentially phosphate limiting, has stimulated biological activity in the stream leading to increased uptake of nitrate and ammonium. However, there is little change in the sodium and chloride in the stream and there are important issues of the representative nature of studying small scale drainage areas. Boreholes, introduced to assess the impacts of the felling programme, show unexpected variations in groundwater chemistry. These variations are associated with the complexity of both flow routing and the chemical reactivity within the groundwater and lower soil zones, rather than changes that can be linked specifically to felling. The implications of the study are discussed in relation to both process understanding and forestry management practices.
Keywords: water quality, acidification, conifer, harvesting, pH, nitrate, ammonium, phosphate, nutrients, alkalinity, Plynlimon, Wales,
Tanllwyth, streams, groundwater
Introduction
An important environmental concern for the UK uplands relates to one of the major forms of historically recent land-use change, the introduction of extensive plantations of exotic conifers (e.g. Sitka spruce, Lodgepole pine, Douglas Fir) onto acidic and acid sensitive soils between the 1920s and 1960s. These plantations have now reached maturity
and are being felled or are being replanted for second or subsequent rotations (Hudson et al., 1997a). There has been a major impetus for stream water quality monitoring to determine the impacts of forest development and forest harvesting (e.g. Stoner and Gee, 1985; Harriman et al., 1994; Neal and Reynolds, 1998). In terms of felling, recent results have shown that while there can be deteriorations in water
quality, the impacts are often of little practical concern at the catchment scale due to the site management policies adopted by the forest industry to maintain and improve the environment (Neal et al., 1998a,b; FC, 1993).
The results of a study of the water quality changes following conifer harvesting are described for a site within the Plynlimon experimental catchments of the Centre for Ecology and Hydrology (CEH) in mid-Wales, the Nant Tanllwyth. The catchment has stagno-humic gley soils, a situation where the worst environmental impacts might be expected given:
l The soils are highly acidic (with soil pH values (in
water) throughout the profile of around 4.0 and base saturation values of around 10%) and aluminium bearing, and soil perturbations might lead to greater stream acidity;
l The soils are highly reducing and so soil disturbance
may lead to releases of iron, reduced forms of nitrogen (ammonium in particular) and phosphorus to the streams which can be environmentally harmful;
l The soils are of low permeability and hence there is
greater risk of the discharge of acidic and nutrient-rich soil water to the streams during rainfall events. The information presented in this paper complements other studies of conifer harvesting at Plynlimon and other parts of Wales that deal with felling responses for podzolic soils (Reynolds et al., 1988; Stevens et al., 1988; Neal et al., 1992a,b, 2003a) and brown earth soils (Neal et al., 1997a, 2003b), thereby infilling information to cover all the major soil types for the region. The data also show that even for catchments with soils that have a high potential for water quality deterioration, the impacts of felling on stream water quality can be minimal.
Study area
The study area is part of the headwaters of the River Severn. The Nant Tanllwyth drains into the Afon Hafren (the Welsh name for the River Severn) near its confluence with the other main tributary of the upper River Severn, the Afon Hore. The Afon Hafren and the Afon Hore drain a hill top plateau dominated by acid moorland in the upper portion of the catchment (Pumlumon Fawr) and the Hafren Forest. The catchment of the Nant Tanllwyth is wedged between these two catchments, such that the top is pinched out and does not extend far onto the upper plateau region. The altitude range for the Nant Tanllwyth is about 335 to 540 m a.s.l. and its catchment area is 0.916 km2. The Tanllwyth
catchment is dominated by thin stagno-humic (peaty) gley
soils overlying bedrock comprised of fractured Lower Palaeozoic mudstones, shales and grits. The Tanllwyth catchment was planted overall with Sitka spruce (Picea sitchensis) in various phases from the mid 1940s through to the late 1960s. About three-quarters of the southern half of the catchment (the southern side of the river channel), was felled in February 1996 where only the tree stem was removed from site leaving the felling debris (stumps, branches and needles) behind. There was also some limited felling during 1993 and 2002.
The sites comprising this study are described below. Further details of the locations of the sites together with other background information are provided in Neal and Kirchner (2000).
Atmospheric inputs
Rainfall is collected weekly from open gauges at the top of the Hafren and bottom of the adjacent Gwy catchment. Cloud-water is collected using a passive lidded harp type system at one site near the top of the catchment on a weekly basis (Wilkinson et al., 1997). Monitoring of rainfall began in 1983 and for cloud-water in September 1990.
Nant Tanllwyth
The main stem of the Nant Tanllwyth was monitored near its confluence with the Hafren. Weekly grab-samples have been collected since September 1991 from a point 10 m upstream of the Tanllwyth flume which is maintained by CEH hydrologists. In May 1994, a deep (95 m) borehole was drilled about 10m to the north and about 10m upstream of the Nant Tanllwyth stream monitoring site (Neal et al., 1997b). This resulted in the opening of blocked fissures in the rock into the stream which released increased quantities of calcium laden groundwaters of high Gran alkalinity. The groundwater input is specifically important under baseflow conditions in terms of chemistry and the change was first noticed the following spring (N.B. in terms of hydrology, the borehole is artesian during wet conditions and the borehole had to be capped to avoid groundwater release to the surface at such times). Because of the influence of the borehole on water quality, the stream monitoring site was relocated 25 m upstream of the borehole. Monitoring at the new location began on 26th September 1995. For the present analysis, the data affected by the introduction of the borehole are excluded from the analysis of the time series (a period from 7th March 1995 to 26th September 1995). However, the effects of the borehole were monitored with continued sampling for pH and Gran alkalinity at the upstream and downstream sites. The upstream data collected after the introduction of the borehole is probably representative of a continuum of the downstream data prior to the introduction
of the borehole (the additional input of water from catchment sources draining into the river between the two monitoring points is insignificant). No monitoring was undertaken between 20th February 2001 and 22nd May 2001 due to an outbreak of foot and mouth disease which ravaged the UK around that time.
Tanllwyth: small stream drainage areas and associated groundwaters
A pair of small sub-catchments, with areas of less than 1ha, was introduced in spring-summer 1994 to examine the interaction between soil type and forest harvesting on water quality. Monitoring of the streams began 28th April 1994 while monitoring of the boreholes began 9th August 1994 (after allowing time for the effects of borehole introduction on water quality to subside). There was one control and one manipulation (harvesting) site located to the north and south of the main stem of the Nant Tanllwyth, respectively. The entire sub-catchment of the manipulated site was clearfelled at the same time as the main Tanllwyth in February 1996. For the paired sites, both streams and boreholes were monitored fortnightly. In the case of the manipulation site, the monitoring of the stream continued up to 14th February 2001, whilst sampling was curtailed at the control site and the boreholes on the 27th April 1999 due to lack of sufficient funds to maintain them.
All the samples were filtered through 0.45 mm membranes in the field and stored in a combination of 10% acid washed polyethylene bottles, chromic acid washed glass bottles and distilled water washed glass bottles prior to analysis. On return from the field, the samples were stored in the dark at 4oC in the case of samples for trace element analysis
concentrated nitric acid (ARISTAR grade) was added to a 1% v/v to avoid sample deterioration. Samples were initially analysed at the Plynlimon and later at the CEH Bangor laboratories for pH and Gran alkalinity using electrometric techniques described in Neal et al., (1997a). Other determinands were measured at CEH Wallingford using a combination of automated colorimetry, ion chromatography and inductively coupled plasma optical emission and mass spectrometry techniques (Neal et al., 1997a). Within the later part of the dataset, no values are available for several of the trace elements and for bromine. The trace element shortfall results from the loss of the ICPMS facility (from 17th November 1998) while bromine, the loss of the colorimetrically based autoanalyzer methodology (method of Moxon and Dixon, 1980) from 1st December 1999 meant that a new methodology had to be introduced and the data loss was based on ion chromatography. Comparisons of results for the old and new methodologies show marked differences with the new methodology typically showing
concentrations half those of the earlier methodology and a yearly cyclical pattern has been lost. It may be that the earlier methodology picked up an organo-bromine signal from the humic acids present in the water: the ion chromatography method specifically determines only bromide.
Results and discussion
The data for the main stem of the Nant Tanllwyth are presented here, followed by a summary for the paired catchment dataset. This separation is needed as the monitoring periods differ in length and quite different features are observed.
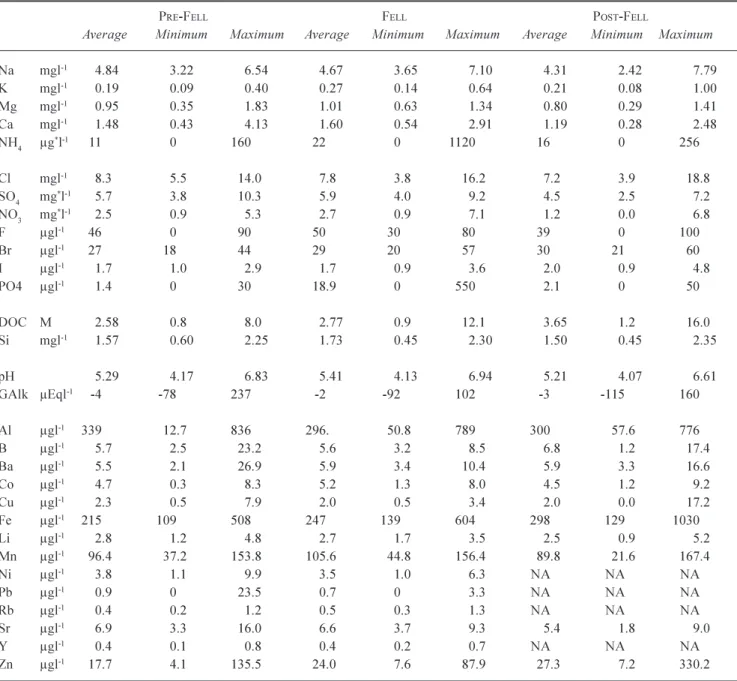
THE MAIN STEM OF THE NANT TANLLWYTH Tables 1a, 2 and 3 summarise the water quality of the main stem of the Nant Tanllwyth: Table 1b shows the equivalent information for rainfall and cloud-water. For these tables, the data are subdivided into three groups: (1) the pre-fell periods (from the start of monitoring until the onset of felling at the end of February 1996, (2) the period of fell, a two year period starting with the onset of felling, and (3) the post-fell period, from two years after the onset of felling and up to the end of the current data record, the end of December 2002. Table 1 gives the average and range (minimum and maximum) concentrations, while Table 2 shows the average baseflow and stormflow concentrations; the averages for the baseflow and stormflow periods cover the lowest 10% and the highest 10%, respectively, of flows for each of the pre-fell, fell and post-fell periods. Table 3 provides a summary of the flow weighted concentrations of the various water quality determinands, an assessment of the total wet deposition and the net uptake or export of chemicals to or from the catchment.
To do this, four steps were involved. Firstly, the flow-weighted average concentration was taken as the sum of the products of the concentration and flow divided by the sum of the flows. In the case of the rainfall and cloud-water components, the flow used for the flow weighting was the volume of catch while for the streams, the flow is the instantaneous flow at the time of sampling. Secondly, the total wet deposition comprises rainfall and cloud-water. However, there is no direct measurement of cloud-water input to the catchment: the collector is designed specifically as an efficient collector of cloud-water rather than a representative aerially averaged volume of catch representative of vegetation surfaces: at times, the cloud-water catch could be over ten times higher than that for rainfall. The catch area for the cloud-water collector depends on the volume of air that passes through the strings, which
Table 1a. A summary of averages and minima and maxima for stream water quality, for the periods pre-fell, at the time of fell (and for
the next two years), and the period post two years after fell. All concentrations are as atomic rather than species weight except for the
* terms ammonium (µg-NH4 l-1), sulphate (mg-SO
4 l-1) and nitrate (mg-NO s:3 l-1).
PRE-FELL FELL POST-FELL
Average Minimum Maximum Average Minimum Maximum Average Minimum Maximum
Na mgl-1 4.84 3.22 6.54 4.67 3.65 7.10 4.31 2.42 7.79 K mgl-1 0.19 0.09 0.40 0.27 0.14 0.64 0.21 0.08 1.00 Mg mgl-1 0.95 0.35 1.83 1.01 0.63 1.34 0.80 0.29 1.41 Ca mgl-1 1.48 0.43 4.13 1.60 0.54 2.91 1.19 0.28 2.48 NH4 µg*l-1 11 0 160 22 0 1120 16 0 256 Cl mgl-1 8.3 5.5 14.0 7.8 3.8 16.2 7.2 3.9 18.8 SO4 mg*l-1 5.7 3.8 10.3 5.9 4.0 9.2 4.5 2.5 7.2 NO3 mg*l-1 2.5 0.9 5.3 2.7 0.9 7.1 1.2 0.0 6.8 F µgl-1 46 0 90 50 30 80 39 0 100 Br µgl-1 27 18 44 29 20 57 30 21 60 I µgl-1 1.7 1.0 2.9 1.7 0.9 3.6 2.0 0.9 4.8 PO4 µgl-1 1.4 0 30 18.9 0 550 2.1 0 50 DOC M 2.58 0.8 8.0 2.77 0.9 12.1 3.65 1.2 16.0 Si mgl-1 1.57 0.60 2.25 1.73 0.45 2.30 1.50 0.45 2.35 pH 5.29 4.17 6.83 5.41 4.13 6.94 5.21 4.07 6.61 GAlk µEql-1 -4 -78 237 -2 -92 102 -3 -115 160 Al µgl-1 339 12.7 836 296. 50.8 789 300 57.6 776 B µgl-1 5.7 2.5 23.2 5.6 3.2 8.5 6.8 1.2 17.4 Ba µgl-1 5.5 2.1 26.9 5.9 3.4 10.4 5.9 3.3 16.6 Co µgl-1 4.7 0.3 8.3 5.2 1.3 8.0 4.5 1.2 9.2 Cu µgl-1 2.3 0.5 7.9 2.0 0.5 3.4 2.0 0.0 17.2 Fe µgl-1 215 109 508 247 139 604 298 129 1030 Li µgl-1 2.8 1.2 4.8 2.7 1.7 3.5 2.5 0.9 5.2 Mn µgl-1 96.4 37.2 153.8 105.6 44.8 156.4 89.8 21.6 167.4 Ni µgl-1 3.8 1.1 9.9 3.5 1.0 6.3 NA NA NA Pb µgl-1 0.9 0 23.5 0.7 0 3.3 NA NA NA Rb µgl-1 0.4 0.2 1.2 0.5 0.3 1.3 NA NA NA Sr µgl-1 6.9 3.3 16.0 6.6 3.7 9.3 5.4 1.8 9.0 Y µgl-1 0.4 0.1 0.8 0.4 0.2 0.7 NA NA NA Zn µgl-1 17.7 4.1 135.5 24.0 7.6 87.9 27.3 7.2 330.2
is a function of wind speed and the moisture content of that air. Hence, the cloud-water component had to be estimated following Wilkinson et al. (1997) who determined that the volume of cloud-water deposition in the upper parts of Plynlimon amounted to 33 mm yr1 for moorland and
140 mm yr1 for forest. Thirdly, because of doubts about
the reliability of the rainfall measurements, the water balance is uncertain (Hudson et al., 1997b) to the degree required for chemical flux estimation (Neal and Kirchner, 2000). Further, uncertainties of water residence times for the catchment mean that there may be significant errors for the
shorter lengths of data such as those presented in this paper. To calculate the wet deposition input-output balances, the flow weighted concentrations for a total wet deposition estimate have been compared with the stream water on the basis that there is a net balance for the chemically conservative ion chloride. The input-output relationship is estimated for individual components (X) as % loss of the wet deposition input (rainfall and cloud water) by:
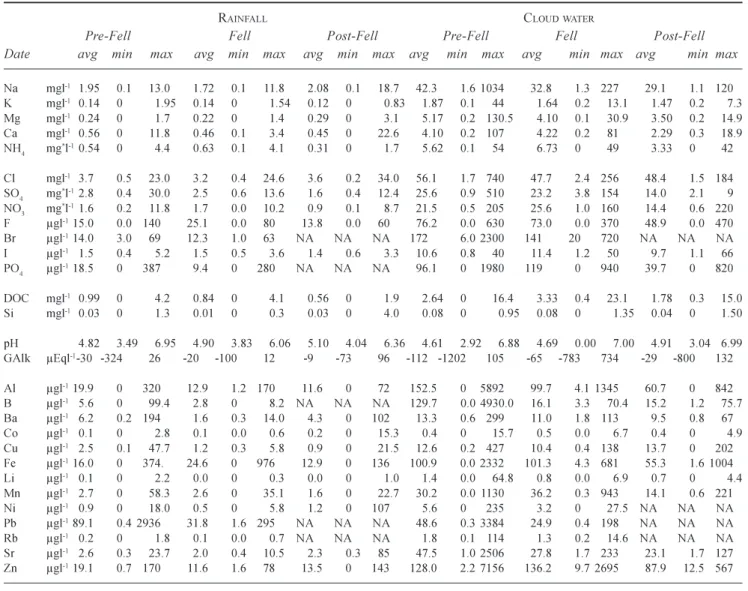
Table 1b. A summary of averages and minima and maxima for rainfall and cloud water quality, for the periods pre-fell, at the time of fell
(and for the next two years), and the period post two years after fell. All concentrations are as atomic rather than species weight except for the * terms ammonium (µg-NH
4 l-1), sulphate (mg-SO4l-1) and nitrate (mg-NO3l-1).
RAINFALL CLOUDWATER
Pre-Fell Fell Post-Fell Pre-Fell Fell Post-Fell Date avg min max avg min max avg min max avg min max avg min max avg min max
Na mgl-1 1.95 0.1 13.0 1.72 0.1 11.8 2.08 0.1 18.7 42.3 1.6 1034 32.8 1.3 227 29.1 1.1 120 K mgl-1 0.14 0 1.95 0.14 0 1.54 0.12 0 0.83 1.87 0.1 44 1.64 0.2 13.1 1.47 0.2 7.3 Mg mgl-1 0.24 0 1.7 0.22 0 1.4 0.29 0 3.1 5.17 0.2 130.5 4.10 0.1 30.9 3.50 0.2 14.9 C a mgl-1 0.56 0 11.8 0.46 0.1 3.4 0.45 0 22.6 4.10 0.2 107 4.22 0.2 81 2.29 0.3 18.9 NH4 mg*l-10.54 0 4.4 0.63 0.1 4.1 0.31 0 1.7 5.62 0.1 54 6.73 0 49 3.33 0 42 C l mgl-1 3.7 0.5 23.0 3.2 0.4 24.6 3.6 0.2 34.0 56.1 1.7 740 47.7 2.4 256 48.4 1.5 184 SO4 mg*l-12.8 0.4 30.0 2.5 0.6 13.6 1.6 0.4 12.4 25.6 0.9 510 23.2 3.8 154 14.0 2.1 9 NO3 mg*l-11.6 0.2 11.8 1.7 0.0 10.2 0.9 0.1 8.7 21.5 0.5 205 25.6 1.0 160 14.4 0.6 220 F µgl-115.0 0.0 140 25.1 0.0 80 13.8 0.0 60 76.2 0.0 630 73.0 0.0 370 48.9 0.0 470 Br µgl-114.0 3.0 69 12.3 1.0 63 NA NA NA 172 6.0 2300 141 20 720 NA NA NA I µgl-1 1.5 0.4 5.2 1.5 0.5 3.6 1.4 0.6 3.3 10.6 0.8 40 11.4 1.2 50 9.7 1.1 66 PO4 µgl-118.5 0 387 9.4 0 280 NA NA NA 96.1 0 1980 119 0 940 39.7 0 820 DOCmgl-1 0.99 0 4.2 0.84 0 4.1 0.56 0 1.9 2.64 0 16.4 3.33 0.4 23.1 1.78 0.3 15.0 Si mgl-1 0.03 0 1.3 0.01 0 0.3 0.03 0 4.0 0.08 0 0.95 0.08 0 1.35 0.04 0 1.50 pH 4.82 3.49 6.95 4.90 3.83 6.06 5.10 4.04 6.36 4.61 2.92 6.88 4.69 0.00 7.00 4.91 3.04 6.99 GAlk µEql-1-30 -324 26 -20 -100 12 -9 -73 96 -112 -1202 105 -65 -783 734 -29 -800 132 Al µgl-119.9 0 320 12.9 1.2 170 11.6 0 72 152.5 0 5892 99.7 4.1 1345 60.7 0 842 B µgl-1 5.6 0 99.4 2.8 0 8.2 NA NA NA 129.7 0.0 4930.0 16.1 3.3 70.4 15.2 1.2 75.7 Ba µgl-1 6.2 0.2 194 1.6 0.3 14.0 4.3 0 102 13.3 0.6 299 11.0 1.8 113 9.5 0.8 67 Co µgl-1 0.1 0 2.8 0.1 0.0 0.6 0.2 0 15.3 0.4 0 15.7 0.5 0.0 6.7 0.4 0 4.9 Cu µgl-1 2.5 0.1 47.7 1.2 0.3 5.8 0.9 0 21.5 12.6 0.2 427 10.4 0.4 138 13.7 0 202 Fe µgl-116.0 0 374. 24.6 0 976 12.9 0 136 100.9 0.0 2332 101.3 4.3 681 55.3 1.6 1004 Li µgl-1 0.1 0 2.2 0.0 0 0.3 0.0 0 1.0 1.4 0.0 64.8 0.8 0.0 6.9 0.7 0 4.4 Mn µgl-1 2.7 0 58.3 2.6 0 35.1 1.6 0 22.7 30.2 0.0 1130 36.2 0.3 943 14.1 0.6 221 Ni µgl-1 0.9 0 18.0 0.5 0 5.8 1.2 0 107 5.6 0 235 3.2 0 27.5 NA NA NA Pb µgl-189.1 0.4 2936 31.8 1.6 295 NA NA NA 48.6 0.3 3384 24.9 0.4 198 NA NA NA Rb µgl-1 0.2 0 1.8 0.1 0.0 0.7 NA NA NA 1.8 0.1 114 1.3 0.2 14.6 NA NA NA Sr µgl-1 2.6 0.3 23.7 2.0 0.4 10.5 2.3 0.3 85 47.5 1.0 2506 27.8 1.7 233 23.1 1.7 127 Zn µgl-119.1 0.7 170 11.6 1.6 78 13.5 0 143 128.0 2.2 7156 136.2 9.7 2695 87.9 12.5 567
For this equation the subscripts Stream and WD refer to the stream and wet deposition, respectively, while Cl refers to chloride. Finally, it must be appreciated that the estimates are only an approximation. Indeed, much more detailed measurements of cloud-water deposition, spatial coverage and chemistry of rainfall and stream responses to storm events would be required to determine the actual flux changes. In the present case, the estimated evapo-transpiration based on the chloride concentrations in total wet deposition and in the stream amounts to about 47, 10 and 35% of the input, for the pre-fell, fell and post-fell periods, while the corresponding volumetric estimates (based on hydrological measurements of flow, coupled with the cloud-water deposition estimates of Wilkinson et al. (1997) are 16, 23 and 19%: the longer term average for moorland and forest based on hydrological data at Plynlimon
is 20 and 25% for moorland and forest, respectively: Neal and Kirchner, 2000). The higher evapotranspiration estimates based on chloride measurements could reflect either from an overestimation of the cloud-water component (the Tanllwyth catchment is at lower altitude than the top of the Severn where Wilkinson et al. 1997, made their estimates of volumetric deposition) or some high chloride events in the stream have been missed (with relatively low permeable soils, the Nant Tanllwyth has hydrologically a particularly flashy catchment) and thus prone to such errors.
The tables contain no data for the trace elements Be, Cd, Ce, Cr, Cs, La, Mo, Pr, Sb, Sc, Th, U or the lanthanides because the concentrations were all less than 0.5µg l1; these
concentrations are at or below the detection limits for the methods of analysis used.
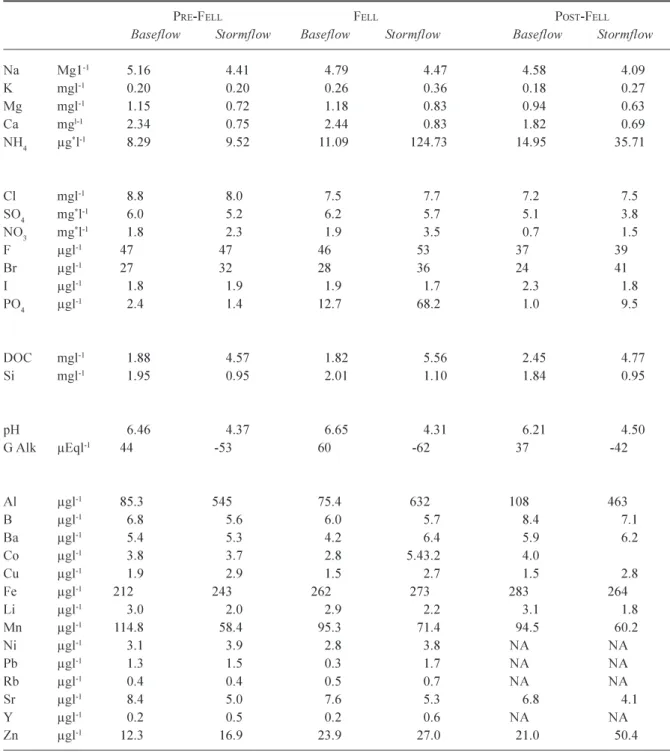
Table 2. A summary of baseflow and stormflow chemistries for the Nant Tanllwyth, for the periods pre-fell, at the time of
fell (and for the next two years), and the period post two years after fell. All concentrations are as atomic rather than species weight except for the * terms ammonium (µg-NH
4 l-1), sulphate (mg-SO4 l-1) and nitrate (mg-NO3 l-1).
PRE-FELL FELL POST-FELL
Baseflow Stormflow Baseflow Stormflow Baseflow Stormflow
Na Mg1-1 5.16 4.41 4.79 4.47 4.58 4.09 K mgl-1 0.20 0.20 0.26 0.36 0.18 0.27 Mg mgl-1 1.15 0.72 1.18 0.83 0.94 0.63 Ca mgl-1 2.34 0.75 2.44 0.83 1.82 0.69 NH4 µg*l-1 8.29 9.52 11.09 124.73 14.95 35.71 Cl mgl-1 8.8 8.0 7.5 7.7 7.2 7.5 SO4 mg*l-1 6.0 5.2 6.2 5.7 5.1 3.8 NO3 mg*l-1 1.8 2.3 1.9 3.5 0.7 1.5 F µgl-1 47 47 46 53 37 39 Br µgl-1 27 32 28 36 24 41 I µgl-1 1.8 1.9 1.9 1.7 2.3 1.8 PO4 µgl-1 2.4 1.4 12.7 68.2 1.0 9.5 DOC mgl-1 1.88 4.57 1.82 5.56 2.45 4.77 Si mgl-1 1.95 0.95 2.01 1.10 1.84 0.95 pH 6.46 4.37 6.65 4.31 6.21 4.50 G Alk µEql-1 44 -53 60 -62 37 -42 Al µgl-1 85.3 545 75.4 632 108 463 B µgl-1 6.8 5.6 6.0 5.7 8.4 7.1 Ba µgl-1 5.4 5.3 4.2 6.4 5.9 6.2 Co µgl-1 3.8 3.7 2.8 5.43.2 4.0 Cu µgl-1 1.9 2.9 1.5 2.7 1.5 2.8 Fe µgl-1 212 243 262 273 283 264 Li µgl-1 3.0 2.0 2.9 2.2 3.1 1.8 Mn µgl-1 114.8 58.4 95.3 71.4 94.5 60.2 Ni µgl-1 3.1 3.9 2.8 3.8 NA NA Pb µgl-1 1.3 1.5 0.3 1.7 NA NA Rb µgl-1 0.4 0.4 0.5 0.7 NA NA Sr µgl-1 8.4 5.0 7.6 5.3 6.8 4.1 Y µgl-1 0.2 0.5 0.2 0.6 NA NA Zn µgl-1 12.3 16.9 23.9 27.0 21.0 50.4
Rain water, cloud-water and stream water chemistries are relatively dilute, but there are large ranges in concentration for most chemical determinands. Rainfall is usually the most dilute of these waters and cloud-water is the most concentrated. Further, rainfall and cloud-waters are more acidic (lower pH and lower Gran alkalinity) than the stream. This corresponds to the well established relationships
between wet deposition inputs and stream chemistry where the variability in atmospheric inputs for the relatively inert chemicals are damped out within the catchment (this is particularly so for the sea salt components Na and Cl) and partial neutralisation of the acidic input occurs due to weathering reactions within the catchment. The most concentrated rainfall and cloud-waters occur for small
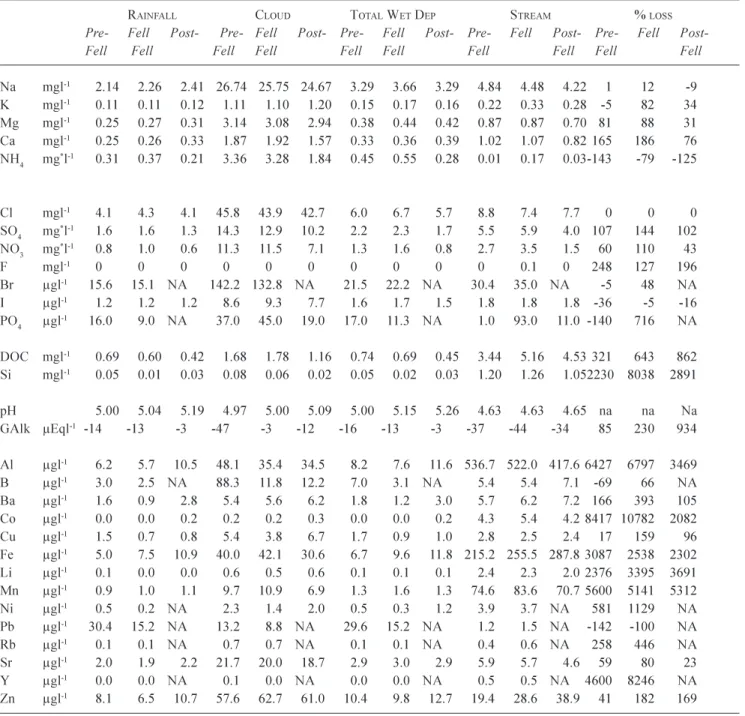
Table 3. A summary of rainfall, cloud water, total wet deposition and stream water flow weighted concentrations and catchment losses,
for pre-fell, fell and post-fell periods. All concentrations are as atomic rather than species weight except for the * terms ammonium
(µg-NH4 l-1), sulphate (mg-SO4 l-1) and nitrate (mg-NO3 l-1).
RAINFALL CLOUD TOTAL WET DEP STREAM % LOSS
Pre- Fell Post- Pre- Fell Post- Pre- Fell Post- Pre- Fell Post- Pre- Fell Post-Fell Fell Fell Fell Fell Fell Fell Fell Fell Fell
Na mgl-1 2.14 2.26 2.41 26.74 25.75 24.67 3.29 3.66 3.29 4.84 4.48 4.22 1 12 -9 K mgl-1 0.11 0.11 0.12 1.11 1.10 1.20 0.15 0.17 0.16 0.22 0.33 0.28 -5 82 34 Mg mgl-1 0.25 0.27 0.31 3.14 3.08 2.94 0.38 0.44 0.42 0.87 0.87 0.70 81 88 31 Ca mgl-1 0.25 0.26 0.33 1.87 1.92 1.57 0.33 0.36 0.39 1.02 1.07 0.82 165 186 76 NH4 mg*l-1 0.31 0.37 0.21 3.36 3.28 1.84 0.45 0.55 0.28 0.01 0.17 0.03-143 -79 -125 Cl mgl-1 4.1 4.3 4.1 45.8 43.9 42.7 6.0 6.7 5.7 8.8 7.4 7.7 0 0 0 SO4 mg*l-1 1.6 1.6 1.3 14.3 12.9 10.2 2.2 2.3 1.7 5.5 5.9 4.0 107 144 102 NO3 mg*l-1 0.8 1.0 0.6 11.3 11.5 7.1 1.3 1.6 0.8 2.7 3.5 1.5 60 110 43 F mgl-1 0 0 0 0 0 0 0 0 0 0 0.1 0 248 127 196 Br µgl-1 15.6 15.1 NA 142.2 132.8 NA 21.5 22.2 NA 30.4 35.0 NA -5 48 NA I µgl-1 1.2 1.2 1.2 8.6 9.3 7.7 1.6 1.7 1.5 1.8 1.8 1.8 -36 -5 -16 PO4 µgl-1 16.0 9.0 NA 37.0 45.0 19.0 17.0 11.3 NA 1.0 93.0 11.0 -140 716 NA DOC mgl-1 0.69 0.60 0.42 1.68 1.78 1.16 0.74 0.69 0.45 3.44 5.16 4.53 321 643 862 Si mgl-1 0.05 0.01 0.03 0.08 0.06 0.02 0.05 0.02 0.03 1.20 1.26 1.052230 8038 2891 pH 5.00 5.04 5.19 4.97 5.00 5.09 5.00 5.15 5.26 4.63 4.63 4.65 na na Na GAlk µEql-1 -14 -13 -3 -47 -3 -12 -16 -13 -3 -37 -44 -34 85 230 934 Al µgl-1 6.2 5.7 10.5 48.1 35.4 34.5 8.2 7.6 11.6 536.7 522.0 417.6 6427 6797 3469 B µgl-1 3.0 2.5 NA 88.3 11.8 12.2 7.0 3.1 NA 5.4 5.4 7.1 -69 66 NA Ba µgl-1 1.6 0.9 2.8 5.4 5.6 6.2 1.8 1.2 3.0 5.7 6.2 7.2 166 393 105 Co µgl-1 0.0 0.0 0.2 0.2 0.2 0.3 0.0 0.0 0.2 4.3 5.4 4.2 8417 10782 2082 Cu µgl-1 1.5 0.7 0.8 5.4 3.8 6.7 1.7 0.9 1.0 2.8 2.5 2.4 17 159 96 Fe µgl-1 5.0 7.5 10.9 40.0 42.1 30.6 6.7 9.6 11.8 215.2 255.5 287.8 3087 2538 2302 Li µgl-1 0.1 0.0 0.0 0.6 0.5 0.6 0.1 0.1 0.1 2.4 2.3 2.0 2376 3395 3691 Mn µgl-1 0.9 1.0 1.1 9.7 10.9 6.9 1.3 1.6 1.3 74.6 83.6 70.7 5600 5141 5312 Ni µgl-1 0.5 0.2 NA 2.3 1.4 2.0 0.5 0.3 1.2 3.9 3.7 NA 581 1129 NA Pb µgl-1 30.4 15.2 NA 13.2 8.8 NA 29.6 15.2 NA 1.2 1.5 NA -142 -100 NA Rb µgl-1 0.1 0.1 NA 0.7 0.7 NA 0.1 0.1 NA 0.4 0.6 NA 258 446 NA Sr µgl-1 2.0 1.9 2.2 21.7 20.0 18.7 2.9 3.0 2.9 5.9 5.7 4.6 59 80 23 Y µgl-1 0.0 0.0 NA 0.1 0.0 NA 0.0 0.0 NA 0.5 0.5 NA 4600 8246 NA Zn µgl-1 8.1 6.5 10.7 57.6 62.7 61.0 10.4 9.8 12.7 19.4 28.6 38.9 41 182 169
volumes of catch and this corresponds with a washout of particulates during events, where higher volumes of water lead to greater dilution. Within the streams, there is a marked variation in water quality linked to contrasting baseflow and storm water conditions. Under baseflow conditions, the waters are of relatively low acidity (pH typically around 6.5) and of positive Gran Alkalinity (around 40 µEq l1).
The baseflow waters are Ca and Mg bearing with concentrations around 1.1 and 2.4 mg l1, respectively, and
they are enriched in silicon (typically around 1.8 mg-Si l1).
In contrast, storm flow waters are highly acidic (pH typically around 4.3) of negative Gran alkalinity (typically around 50 µEq l1) and they are enriched in aluminium (typically
500 µg l1) and dissolved organic carbon (DOC, typically
around 5 mg-C l1), but they are depleted in base cations
and silicon. These differences simply reflect the changing dominance of stream inputs from two distinct hydrogeochemical zones. Under storm flow conditions, the
waters are derived mainly from the soil zone where acidic conditions prevail. Within the soil zone, aluminium is available for acid leaching from oxide and hydroxides which are present in the soil matrix, while the soil waters are organic-rich from humic and fulvic acids generated from the organic components in the soil matrix. Under baseflow conditions, the waters are from the lower soils and shallow groundwater zones where weathering reactions ensure that the soil waters lose much of their acidity and convert dissolved carbon dioxide into bicarbonate anions while releasing divalent base cations from carbonate and silicate phases and silicon from the silicate phases. In the process, aluminium is precipitated from solution due to hydrolysis under less acidic conditions while DOC is lost as carbon dioxide/bicarbonate. These patterns are observed prior to, during and post-felling.
Wet deposition inputs and stream output chemistries have to be considered in relation to pre-felling, felling and post-felling times.
Prior to felling, there is an approximate balance for sodium and potassium (and chloride by definition), but for most other components there is a marked imbalance. This imbalance takes two forms.
Firstly, some components are enriched in runoff. These components divide into three distinct hydrogeochemically reactive types:
l The divalent base cations, Gran Alkalinity, fluoride
and silicon (80 to over 2000% enrichment). The
divalent base cations (Mg, Ca, Sr and Ba: 59 to 166% enrichment) are in part derived from weathering of the bedrock as described earlier. Within this group is fluoride (248% enrichment) which is strongly associated with aluminium within the soil and groundwater matrix, while silicon is derived mostly from the weathering of silicates within the bedrock (2230% enrichment).
l Sulphate and nitrate (60 to 107% enrichment). These
components are essentially derived from the atmosphere, but not simply in the form of wet deposition. An important part of the deposition comes from uptake of gaseous inputs to the vegetation surface (SOx and NOx: RGAR, 1997).
l Many trace metals (40 to over 8000% enrichment).
These trace metals (Al, Co, Fe, Li, Mn, Ni, Rb, Y, Zn) are mainly mobilised under acidic conditions where hydrolysis is minimal and where organic rich solutions can enhance solubility due to complexation reactions. Secondly, there are components where the atmospheric inputs are retained by the catchment and there is insufficient release by the catchment to allow even a net balance. There
are three hydrogeochemically distinct types:
l Bromine and iodine (5 to 36% loss). These components
are derived mainly from the atmosphere and they originate in the sea. They are nutrients; they take part in biological reactions and they are in part retained by the organic biomass.
l Ammonium, phosphate and boron (70 to 143%
losses). These components are important nutrients and they fertilise the catchments. In addition, ammonium can be converted to nitrate and it is also taken up onto cation exchange sites in the soil, while phosphate can be precipitated into or sorbed onto iron rich phases which are common within the highly reducing gley soils. Boron is mainly present as borate anions which are of low chemical reactivity and boron shows the lowest uptake within this group.
l Lead (about 142% loss). There is an unusually high
deposition of lead into the catchment (highest concentrations occur under low volumes of catch in rainfall and it is derived from pollutant emissions to the atmosphere). Within the catchment, lead can sorb onto the organic soils. However, lead also occurs within the bedrock of the area but it seems that, under the less acidic conditions that occur within these areas, the lead is retained in an insoluble form.
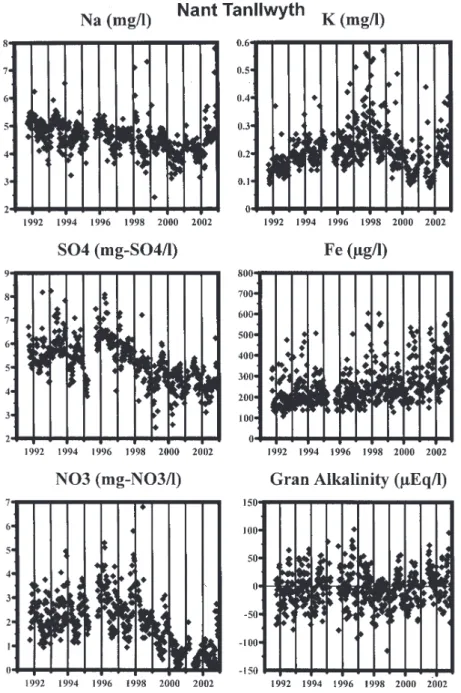
With felling, there are initially some moderate increases in concentration for many of the components with a subsequent reduction towards or below pre-fell levels. The changes in water quality with felling are summarised in Tables 1 and 2 and illustrated as time series in Figs. 1a and 1b for Na, K, SO4, Fe, NO3 and Gran alkalinity. In Fig. 1a,
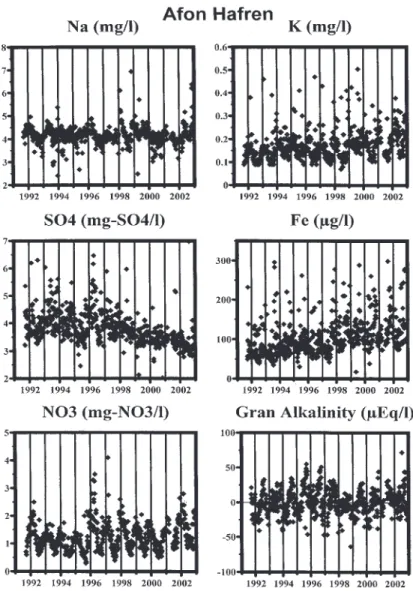
the time series plots are for the Nant Tanllwyth, while the plots in Fig. 1b are for the Afon Hafren which is used as a marker to set against the changes observed in the Nant Tanllwyth. Note that the Hafren has been felled progressively through the years but there is little effect on stream water quality (other than perhaps for potassium concentrations) as the phased felling results in runoff from different parts of the catchment that are influenced by the early felling effects as well as the recovery phase (Neal et al., 2003a). The patterns of change observed are as follows.
l Sodium and chloride. These components are largely
derived from the atmosphere. Through the felling and post-felling period, the concentrations fall moderately (about 10%) without a corresponding fall for the Hafren control. This feature would be expected due to reduced scavenging of cloud-water inputs which are enriched in sea-salt components and increased runoff due to reduced
Fig. 1a. Time series data for Na, K, SO4, Fe, NO3 and Gran alkalinity for the main stem of the Nant Tanllwyth.
transpiration as trees are removed from the catchment.
l Ammonium, potassium, and phosphate. Initially,
these increase with felling and subsequently fall towards pre-fell values. These components are taken up in the growing biomass, and the loss of tree cover ensures minimal uptake at a time when releases from decomposing fine roots, needles etc are increasing. On a proportionate basis, the increase in phosphate is the greatest (an order of magnitude change), but other than an exceptionally high spike at 550 mg-P l1 observed
within the first two years of fell concentrations are still low throughout the period. For ammonium,
concentrations on average double initially on felling, but again there is a very high spike observed during this period (1120 mg-NH4 l1). These changes have not
been observed within the Hafren.
l Nitrate. Usually, nitrate shows a major increase with
felling due to the disruption of the nitrogen cycle. However, in this case, other than a decrease in concentration post-felling there is no clear change. Such a change is not observed for the Hafren and it seems that felling has led to uptake rather than release.
l Sulphate. There is a clear decline in sulphate
Fig. 1b. Time series data for Na, K, SO4, Fe, NO3 and Gran alkalinity for the main stem of the Afon Hafren at its lowest gauging point.
there is a similar decline and the reduction may well be linked to factors other than felling such as declining atmospheric deposition and attenuation in the soil associated with sorption-desorption processes (Neal et al., 2001).
l Iron and DOC. These components increase through
the study period as is observed across all the forested Plynlimon catchments and it is not associated with felling (Neal et al., 2001: also see Fig. 1b in this paper for the Hafren).
l Other components. For all other components there is
little change.
The effects of borehole introduction on stream water chemistry
While not central to this paper, it is appropriate to show the effect of the deep borehole introduction near the main stem
on the stream pH and Gran alkalinity. This borehole not only opened a groundwater route to the stream, but also allowed the transfer of both base-rich high alkalinity waters and, occasionally, acidic soil waters to the stream (Neal et al., 1997b). This section illustrates how the water quality has changed since and initial report by Neal et al. (1997b) to describe the longevity in the improvement of water quality due to the groundwater introduction. This aspect is important in relation to practical environmental management to reduce stream acidification. Here, it is sufficient to concentrate solely on pH and Gran alkalinity changes, which have been monitored at both the upstream and downstream sites (unlike the major ion chemistry which was discontinued at the lower site when the upstream site was introduced).
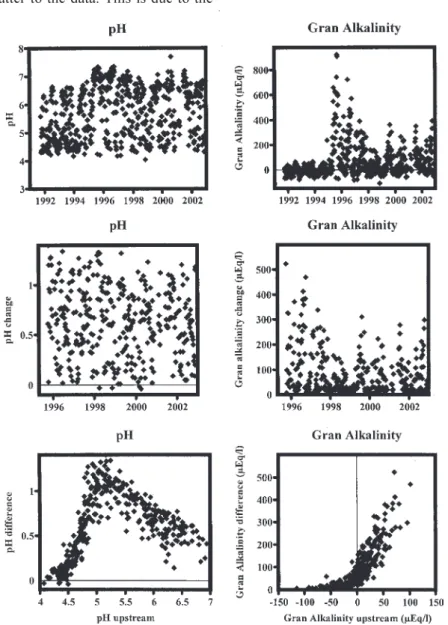
Figure 2 shows the salient features where pH (left-hand side of Fig. 2) and Gran alkalinity (right-hand side of Fig. 2) is plotted as (a) a time series for the downstream location
influenced by the borehole (the top row of diagrams) which covers the full length of record, (b) the time series difference for the upstream and downstream data record (the middle row of diagrams) to show the scale of change and (c) the change in pH and Gran Alkalinity relative to the downstream values (the bottom row of diagrams). The salient features are as follows.
l Following the borehole introduction, the pH increased
by over 0.5 units under baseflow conditions when the pH is at its highest. The increase in Gran alkalinity is much more marked than for pH and can be as high as 530 mEq l1.
l There is a large scatter to the data. This is due to the
influence of flow. Under baseflow conditions, the pH at its highest and the influence of the borehole is maximal. Under stormflow conditions, the pH is low due to the input of acidic soil water which dilutes the groundwater input.
l The maximum change in pH occurs at intermediate
values of pH (up to about 1 unit of change) but for Gran alkalinity, there is a progressive and accelerating change to higher Gran alkalinity values.
l The influence of the borehole may recede with time (as
shown by decreasing maximum determinand changes over time), but the reduction is relatively small as that the influence of the borehole remains after six years.
Fig. 2. Plots are presented illustrating the effects of groundwater inputs to the Nant Tanllwyth due to the introduction of a borehole by the side
of the stream on a nearby bank. The figures are for pH (left hand side of the figure) and Gran alkalinity (right hand side of the figure). The top row of graphs show time series for the downstream location influenced by the borehole and the time series covers the full monitoring period from 1991 to 2003. The middle row of graphs shows time series for the difference in pH and in Gran alkalinity for upstream and downstream data record and this shows the scale and longevity of change. Note that in this case, the plot covers only the period post borehole introduction (1995 to 2003). The lower set of graphs shows change in pH and Gran Alkalinity relative to the downstream values.
THE PAIRED CATCHMENTS
Stream chemistry
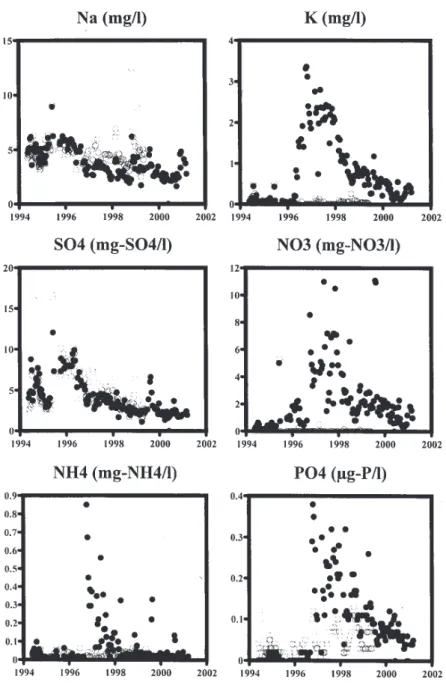
The water quality changes for the control and manipulation sites are provided in Table 4 where the data for the manipulation site is subdivided into pre-fell, fell and post-fell periods in the same way as for the main stream. For the control site, the data are restricted to the pre-fell and felling periods due to lack of data for the post-fell period. Time
series for selected determinands are provided in Fig. 3 to show the temporal patterns of change for the control site (open circles) and the manipulation site (black filled circles). The salient features are as follows.
l For both the control and manipulation sites, the waters
are generally very acidic as they are derived primarily from the low permeability highly acidic soils and they
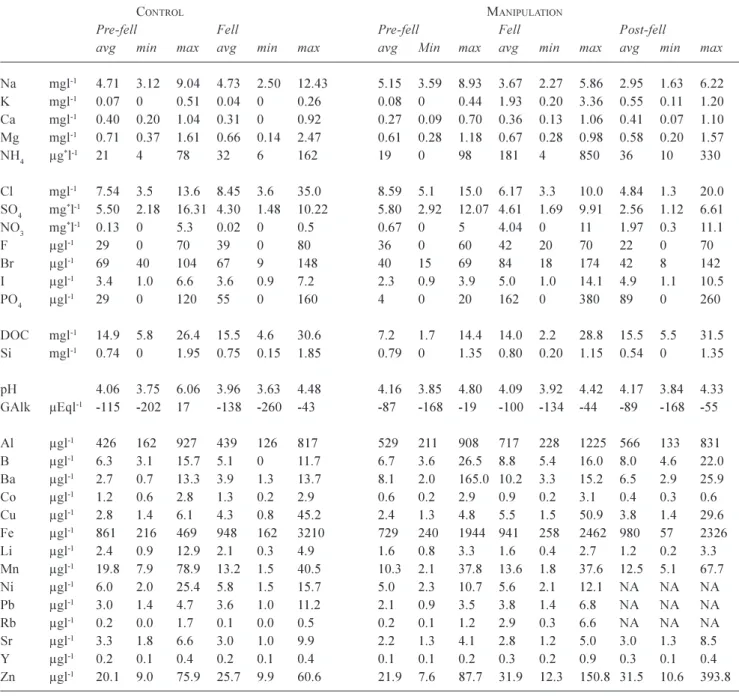
Table 4. A summary of averages and ranges in water quality for control and manipulation stream sites. For the control, the times
corresponding to pre-fell and fell times have been distinguished. For the manipulation site, the pre-fell, fell and post-fell periods are presented. In the case of the control, post fell values are not presented as the data record is insufficient. For the manipulation site, the fell period represents a two year period starting with the commencement of fell. All concentrations are as atomic rather than species weight except for the * terms ammonium (µg-NH
4 l-1), sulphate (mg-SO4 l-1) and nitrate (mg-NO3 l-1).
CONTROL MANIPULATION
Pre-fell Fell Pre-fell Fell Post-fell
avg min max avg min max avg Min max avg min max avg min max
Na mgl-1 4.71 3.12 9.04 4.73 2.50 12.43 5.15 3.59 8.93 3.67 2.27 5.86 2.95 1.63 6.22 K mgl-1 0.07 0 0.51 0.04 0 0.26 0.08 0 0.44 1.93 0.20 3.36 0.55 0.11 1.20 Ca mgl-1 0.40 0.20 1.04 0.31 0 0.92 0.27 0.09 0.70 0.36 0.13 1.06 0.41 0.07 1.10 Mg mgl-1 0.71 0.37 1.61 0.66 0.14 2.47 0.61 0.28 1.18 0.67 0.28 0.98 0.58 0.20 1.57 NH4 µg*l-1 21 4 78 32 6 162 19 0 98 181 4 850 36 10 330 Cl mgl-1 7.54 3.5 13.6 8.45 3.6 35.0 8.59 5.1 15.0 6.17 3.3 10.0 4.84 1.3 20.0 SO4 mg*l-1 5.50 2.18 16.31 4.30 1.48 10.22 5.80 2.92 12.07 4.61 1.69 9.91 2.56 1.12 6.61 NO3 mg*l-1 0.13 0 5.3 0.02 0 0.5 0.67 0 5 4.04 0 11 1.97 0.3 11.1 F µgl-1 29 0 70 39 0 80 36 0 60 42 20 70 22 0 70 Br µgl-1 69 40 104 67 9 148 40 15 69 84 18 174 42 8 142 I µgl-1 3.4 1.0 6.6 3.6 0.9 7.2 2.3 0.9 3.9 5.0 1.0 14.1 4.9 1.1 10.5 PO4 µgl-1 29 0 120 55 0 160 4 0 20 162 0 380 89 0 260 DOC mgl-1 14.9 5.8 26.4 15.5 4.6 30.6 7.2 1.7 14.4 14.0 2.2 28.8 15.5 5.5 31.5 Si mgl-1 0.74 0 1.95 0.75 0.15 1.85 0.79 0 1.35 0.80 0.20 1.15 0.54 0 1.35 pH 4.06 3.75 6.06 3.96 3.63 4.48 4.16 3.85 4.80 4.09 3.92 4.42 4.17 3.84 4.33 GAlk µEql-1 -115 -202 17 -138 -260 -43 -87 -168 -19 -100 -134 -44 -89 -168 -55 Al µgl-1 426 162 927 439 126 817 529 211 908 717 228 1225 566 133 831 B µgl-1 6.3 3.1 15.7 5.1 0 11.7 6.7 3.6 26.5 8.8 5.4 16.0 8.0 4.6 22.0 Ba µgl-1 2.7 0.7 13.3 3.9 1.3 13.7 8.1 2.0 165.0 10.2 3.3 15.2 6.5 2.9 25.9 Co µgl-1 1.2 0.6 2.8 1.3 0.2 2.9 0.6 0.2 2.9 0.9 0.2 3.1 0.4 0.3 0.6 Cu µgl-1 2.8 1.4 6.1 4.3 0.8 45.2 2.4 1.3 4.8 5.5 1.5 50.9 3.8 1.4 29.6 Fe µgl-1 861 216 469 948 162 3210 729 240 1944 941 258 2462 980 57 2326 Li µgl-1 2.4 0.9 12.9 2.1 0.3 4.9 1.6 0.8 3.3 1.6 0.4 2.7 1.2 0.2 3.3 Mn µgl-1 19.8 7.9 78.9 13.2 1.5 40.5 10.3 2.1 37.8 13.6 1.8 37.6 12.5 5.1 67.7 Ni µgl-1 6.0 2.0 25.4 5.8 1.5 15.7 5.0 2.3 10.7 5.6 2.1 12.1 NA NA NA Pb µgl-1 3.0 1.4 4.7 3.6 1.0 11.2 2.1 0.9 3.5 3.8 1.4 6.8 NA NA NA Rb µgl-1 0.2 0.0 1.7 0.1 0.0 0.5 0.2 0.1 1.2 2.9 0.3 6.6 NA NA NA Sr µgl-1 3.3 1.8 6.6 3.0 1.0 9.9 2.2 1.3 4.1 2.8 1.2 5.0 3.0 1.3 8.5 Y µgl-1 0.2 0.1 0.4 0.2 0.1 0.4 0.1 0.1 0.2 0.3 0.2 0.9 0.3 0.1 0.4 Zn µgl-1 20.1 9.0 75.9 25.7 9.9 60.6 21.9 7.6 87.7 31.9 12.3 150.8 31.5 10.6 393.8
Fig. 3. Time series plots for Na, K, SO4, NO3, NH4 and PO4 concentrations at the control (open circles) and manipulation (filled circles) sites. The monitoring of the streams was from 28th April 1994 to 14th February 2001 at the manipulation site while for the control, the monitoring was ended earlier on the 27th April 1999 due to lack of sufficient funds to maintain it.
have little groundwater component to significantly neutralise the acidity: pH and Gran alkalinity are typically about 4.1 and 100 mEq l-1, respectively.
However, for the control, occasionally less acidic waters occur at very low flows in the summer months when biological activity is extremely high. These less acidic waters are generated by the biological loss of nitrate from the stream with no change other than in the pH and the Gran Alkalinity.
l There seems to be no clear effect of felling on the pH and Gran alkalinity: while there are some differences in the averages for the pre-fell, fell and post-fell periods,
the high scatter to the data means that any differences in average are not significant statistically.
l With felling there is a lowering in Na and Cl
concentrations, as occurred in the main stem of the Nant Tanllwyth: there is no clear change for the control site and no statistically significant trend. The decrease is much greater than for the main stem at around 40%.
l With felling there is also a clear decrease in sulphate, at around the same level as the Na and Cl. However, in this case, the control also shows a similar lowering and it is not clear that felling is having an effect in this case.
marked increases in concentration with felling followed by a subsequent recovery. This feature, as described for the main stream is a result of the disruption of the biogeochemical cycle with felling. However, in this case, the increase for nitrate is not observed in the main stem of the Nant Tanllwyth: this feature will be discussed later.
l Bromine and iodine. Both these components show
moderate increases (a factor of around 2) and subsequent declines with felling. These components are nutrients, and their behaviour would be expected to be similar to that for the other nutrients.
l For the components which show clear changes with
felling, the effects are of greater amplitude than for the main stream, where greater dilution occurs.
Groundwater chemistry
The groundwater chemistry at the control and manipulation sites is distinct (Table 5). For example, the control sites are moderately acidic having pH in the range 4.28 to 5.3 with a corresponding Gran alkalinity range of 109 to 89 mEq l1.
In contrast, the manipulation site has a pH in the range of 5.12 to 6.33, while the corresponding range in Gran alkalinity is 25 to 2293 mEq l1. These contrasting acidities
link to the extent of interaction between the soil waters entering the groundwater domain and the extent of weathering therein which neutralises, in part, this incoming acidity. Clearly, the control site represents a situation where the extent of weathering is much lower than the manipulation site as illustrated not only by the differing acidity, but also by the much lower Ca and Mg concentrations; which are generated during the weathering process. Note that there is nonetheless considerable weathering within the groundwater zone, as the stream runoff chemistry is much more acidic than the corresponding groundwater chemistry: the pH range for the streams to set against the values presented above for the groundwaters is 3.63 to 6.06 (remembering that the high values are exceptional due to biological activity), while the corresponding Gran alkalinity range is 260 to 17 mEq l1).
The groundwater water quality of the control and manipulation sites differs not only in terms of the acidity and degree of weathering, but also in terms of iron and nitrate levels. For the manipulation site conditions must be very reducing because of nitrate levels of almost zero and massively high iron concentrations of up to almost 17 mg l1.
On this basis, the control cannot be compared directly with the manipulation site due to the very distinct chemistry. Rather, the results show the very varied nature of the groundwater system, a feature described previously for the Plynlimon area (Neal et al., 1997c) which often affects the water quality variation in the streams across the landscape
(Hill and Neal, 1997; Neal et al., 1997d).
For the manipulation site, describing the effects of felling is difficult as there are major issues of representativeness. During the early part of the monitoring phase, the introduction of the deep borehole near the Nant Tanllwyth affected the chemistry of the main stem. When this borehole to the south of the river was introduced, there was a sudden fall in groundwater level at the manipulation site (early November 1994) even though the two boreholes are on opposite sides of the river. This means that as the borehole allowed transfer of groundwater to the stream it also opened a fracture or a series of fractures which extended below the river and affected the shallow groundwaters to the north of the river. For the manipulation site, the groundwater level changed from about 1 m to about 4 m below the surface. Two weeks after the sudden change in depth at the manipulation borehole, the water quality changed suddenly. This is illustrated in Table 5 where water quality data for the early part of the record, prior to the deep borehole effect, and in the pre-fell period, post the deep borehole effect, are presented. The results show that Ca, Mg, Gran alkalinity, Fe, Ni, Sr and Ba concentrations approximately halved while aluminium concentrations increased. Hence more acidic soil waters entered the system, presumably from the soil and there was a dilution of components generated within the weathering process as well as of iron (released to solution by the more anoxic conditions in the groundwater areas). For the felling/post-felling period, the calcium, magnesium, Gran alkalinity, Fe, Ni, Sr, and Ba concentrations continued to fall substantially, while the declines in the trace metals were smaller. Whether or not this fall was due to the introduction of the borehole, the fell or a combination of both, cannot be stated because of lack of sufficient information.
No sudden level or water quality change was observed for the control site borehole even though it was on the same side of the river and nearer to the deep borehole than that for the manipulation site on the opposite side of the river. Further, the occurrence of high alkalinity waters at shallow depths at the manipulation site was surprising as the effects of the soil inputs might be expected to dominate. Indeed, the production of more acidic waters at greater depths at the manipulation site as a result of the introduction of the deep borehole is both counter-intuitive and goes against the findings for deep boreholes in the area where alkalinity is associated with the hydrogeochemical gradient, increasing with depth (Neal et al., 1997c). Thus, when the information from this study is combined with earlier studies of groundwaters at Plynlimon, the groundwater regime is extremely difficult to describe in detail due to the complex fracture flow pathways which dominate the hydrogeology
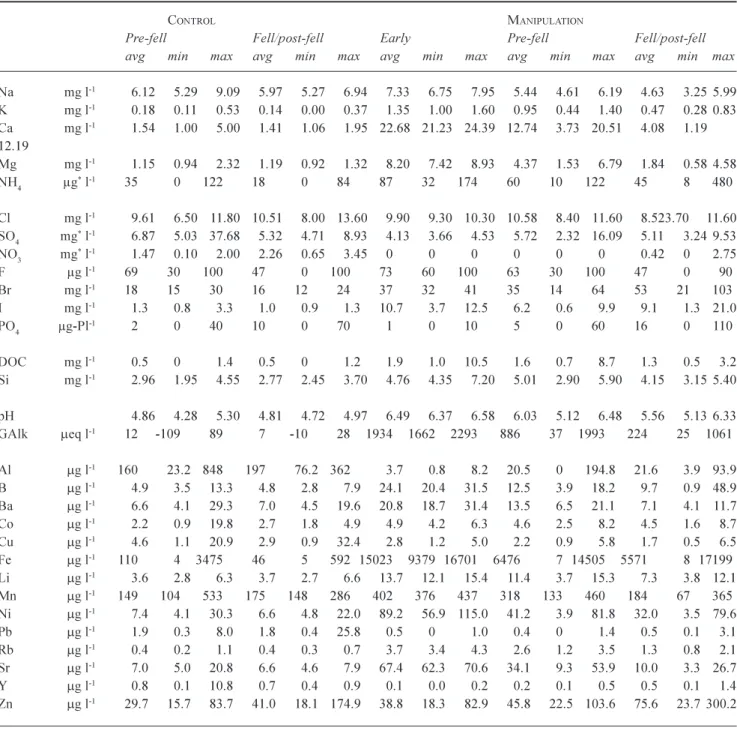
Table 5. Summary statistics for groundwaters at the control and manipulation sites. For both sites, the times corresponding to pre-fell and
fell/post-fell times. The fell and post-fell data have been combined as there is an insufficiently long data record to allow proper separation. The fell/post-fell period represents a three year period starting with the commencement of fell. All concentrations are as atomic rather than species weight except for the * terms ammonium (µg-NH
4 l-1), sulphate (mg-SO4 l-1) and nitrate (mg-NO3 l-1).
CONTROL MANIPULATION
Pre-fell Fell/post-fell Early Pre-fell Fell/post-fell avg min max avg min max avg min max avg min max avg min max
N a mg l-1 6.12 5.29 9.09 5.97 5.27 6.94 7.33 6.75 7.95 5.44 4.61 6.19 4.63 3.25 5.99 K mg l-1 0.18 0.11 0.53 0.14 0.00 0.37 1.35 1.00 1.60 0.95 0.44 1.40 0.47 0.28 0.83 Ca mg l-1 1.54 1.00 5.00 1.41 1.06 1.95 22.68 21.23 24.39 12.74 3.73 20.51 4.08 1.19 12.19 Mg mg l-1 1.15 0.94 2.32 1.19 0.92 1.32 8.20 7.42 8.93 4.37 1.53 6.79 1.84 0.58 4.58 NH4 µg*l-1 35 0 122 18 0 84 87 32 174 60 10 122 45 8 480 Cl mg l-1 9.61 6.50 11.80 10.51 8.00 13.60 9.90 9.30 10.30 10.58 8.40 11.60 8.523.70 11.60 SO4 mg*l-1 6.87 5.03 37.68 5.32 4.71 8.93 4.13 3.66 4.53 5.72 2.32 16.09 5.11 3.24 9.53 NO3 mg*l-1 1.47 0.10 2.00 2.26 0.65 3.45 0 0 0 0 0 0 0.42 0 2.75 F µg l-1 69 30 100 47 0 100 73 60 100 63 30 100 47 0 90 Br mg l-1 18 15 30 16 12 24 37 32 41 35 14 64 53 21 103 I mg l-1 1.3 0.8 3.3 1.0 0.9 1.3 10.7 3.7 12.5 6.2 0.6 9.9 9.1 1.3 21.0 PO4 µg-Pl-1 2 0 40 10 0 70 1 0 10 5 0 60 16 0 110 DOC mg l-1 0.5 0 1.4 0.5 0 1.2 1.9 1.0 10.5 1.6 0.7 8.7 1.3 0.5 3.2 Si mg l-1 2.96 1.95 4.55 2.77 2.45 3.70 4.76 4.35 7.20 5.01 2.90 5.90 4.15 3.15 5.40 pH 4.86 4.28 5.30 4.81 4.72 4.97 6.49 6.37 6.58 6.03 5.12 6.48 5.56 5.13 6.33 GAlk meq l-1 12 -109 89 7 -10 28 1934 1662 2293 886 37 1993 224 25 1061 Al mg l-1 160 23.2 848 197 76.2 362 3.7 0.8 8.2 20.5 0 194.8 21.6 3.9 93.9 B mg l-1 4.9 3.5 13.3 4.8 2.8 7.9 24.1 20.4 31.5 12.5 3.9 18.2 9.7 0.9 48.9 Ba mg l-1 6.6 4.1 29.3 7.0 4.5 19.6 20.8 18.7 31.4 13.5 6.5 21.1 7.1 4.1 11.7 Co mg l-1 2.2 0.9 19.8 2.7 1.8 4.9 4.9 4.2 6.3 4.6 2.5 8.2 4.5 1.6 8.7 Cu mg l-1 4.6 1.1 20.9 2.9 0.9 32.4 2.8 1.2 5.0 2.2 0.9 5.8 1.7 0.5 6.5 Fe mg l-1 110 4 3475 46 5 592 15023 9379 16701 6476 7 14505 5571 8 17199 Li mg l-1 3.6 2.8 6.3 3.7 2.7 6.6 13.7 12.1 15.4 11.4 3.7 15.3 7.3 3.8 12.1 Mn mg l-1 149 104 533 175 148 286 402 376 437 318 133 460 184 67 365 Ni mg l-1 7.4 4.1 30.3 6.6 4.8 22.0 89.2 56.9 115.0 41.2 3.9 81.8 32.0 3.5 79.6 Pb mg l-1 1.9 0.3 8.0 1.8 0.4 25.8 0.5 0 1.0 0.4 0 1.4 0.5 0.1 3.1 Rb mg l-1 0.4 0.2 1.1 0.4 0.3 0.7 3.7 3.4 4.3 2.6 1.2 3.5 1.3 0.8 2.1 Sr mg l-1 7.0 5.0 20.8 6.6 4.6 7.9 67.4 62.3 70.6 34.1 9.3 53.9 10.0 3.3 26.7 Y mg l-1 0.8 0.1 10.8 0.7 0.4 0.9 0.1 0.0 0.2 0.2 0.1 0.5 0.5 0.1 1.4 Zn mg l-1 29.7 15.7 83.7 41.0 18.1 174.9 38.8 18.3 82.9 45.8 22.5 103.6 75.6 23.7 300.2
and the high degree of spatial and temporal variation in groundwater hydrogeochemistry.
DISSOLVED CARBON DIOXIDE IN THE STREAMS AND GROUNDWATER
The relationship between pH and Gran alkalinity needs mention because there are marked differences for the
groundwater and surface water systems as a consequence of contrasting amounts of dissolved CO2. Dissolved CO2
builds up within the soils and groundwaters due to respiratory processes by vegetation and micro-organisms and from the breakdown of organic carbon. Within the stream, there is the potential for this build-up of dissolved CO2 to be dissipated partially by loss of gaseous CO2 to the