HAL Id: tel-01507335
https://hal.archives-ouvertes.fr/tel-01507335
Submitted on 13 Apr 2017
HAL is a multi-disciplinary open access
archive for the deposit and dissemination of sci-entific research documents, whether they are pub-lished or not. The documents may come from teaching and research institutions in France or abroad, or from public or private research centers.
L’archive ouverte pluridisciplinaire HAL, est destinée au dépôt et à la diffusion de documents scientifiques de niveau recherche, publiés ou non, émanant des établissements d’enseignement et de recherche français ou étrangers, des laboratoires publics ou privés.
Copyright
MOLECULAR LEVEL BY NEUTRON AND X-RAY
SCATTERING
Utsab R Shrestha
To cite this version:
Utsab R Shrestha. EXPLORING THE PHYSICS OF PROTEINS AT MOLECULAR LEVEL BY NEUTRON AND X-RAY SCATTERING. Physics [physics]. Wayne State University, Detroit, 2017. English. �tel-01507335�
by
UTSAB R. SHRESTHA DISSERTATION
Submitted to the Graduate School of Wayne State University,
Detroit, Michigan
in partial fulfillment of the requirements for the degree of
DOCTOR OF PHILOSOPHY 2017
MAJOR: Physics
Date of defense: March 09, 2017 Approved By:
Dr. Xiang − Qiang Chu (Advisor)
Dr. Zhi − Feng Huang (Committee member)
Dr. Takeshi Sakamoto (Committee member)
Dr. Christopher V. Kelly (Committee member)
UTSAB R. SHRESTHA 2017
I dedicate this work to my loving parents and wife, Prema for their constant support, encouragement and belief on me. Specially, this dissertation is dedicated to my daughter, Utsaha.
I, Utsab R. Shrestha, declare that this dissertation titled, Exploring the Physics of Proteins at Molecular Level by Neutron and X-ray Scattering and the work reported in it are from my own original research.
I confirm that:
• This work was done wholly or mainly while in candidature for a research degree at Wayne State University.
• Where any part of this dissertation has previously been submitted for a degree or any other qualification at this University or any other institution, this has been clearly stated.
• Where I have consulted the published work of others, this is always clearly cited.
• Where I have quoted from the work of others, the source or reference is always provided or cited. With the exception of such quotations, this dissertation is completely my own work.
• I have acknowledged all main sources of help.
• Where the dissertation is based on work done by myself jointly with others, I have made clear exactly what was done by others and what I have contributed myself.
Signed: Date:
I would like to start with my sincere thanks to the department chairs Prof. David Cinabro (current) and Prof. Ratna Naik (former). My sincere gratitude to Prof. Jogindra Wadehra for his continuous guidance and support from the very first day. His advice for registering the courses and making the plan of work for the degree were really helpful.
I was very fortunate to take two courses, Thermal Physics and Advanced Soft Matter Physics with Prof. Paul Keyes before he got retired. I learned a lot from his classes. I also learned a lot from Statistical Mechanics course taught by Prof. Zhi-Feng Huang. Their lessons were very helpful that provided me the solid conceptual framework for conducting the research in biophysics. I also thank all other professors with whom I took other courses. I earned a good experience by teaching the undergraduate laboratories and quiz classes while I was a GTA. I would like to thank our lab instructor Dr. Scott Payson and faculty members for their guidance and support for preparing the labs and quiz classes. I am also thankful to all my colleagues from the department with whom I took the courses. Specially, I thank Abir for having discussions in the course works that we took together. Apart from teaching the courses, I received a huge support for all the administrative works from all the staff members of physics department. They were more than generous to provide all the necessary office help.
I joined Dr. Xiang-Qiang Chu’s group in winter 2012. I am very honored to have one of the very young, talented, and enthusiastic professors as my research advisor, who always encouraged and motivated me to think independently. Throughout my fruitful years under her supervision, I have received a great opportunity to learn and explore some of the major challenges in biophysics. Her guidance has led me to implement the knowledge of physics in the interdisciplinary fields such as biophysics and nano-materials. She was always available there to provide the necessary help whenever I needed. She always encouraged and provided the opportunities to participate in local or national conferences. Therefore, I participated at least a couple of conferences and presented our work each year, which boosted my confidence
her for all the support and I do not have any word to express my gratitude to her.
I had a wonderful time (academically and personally) with the ex-postdoctorate fellow, Dr. Debsindhu Bhowmik during his time of two and half years in our group. He was a very helpful person with a good knowledge of neutron scattering and molecular dynamic simulation. We had very productive experiments and discussions together. We became good friends and I feel lucky to have a friend like him.
My sincere thanks to all the dissertation committee members, Prof. Zhi-Feng Huang, Prof. Takeshi Sakamoto, Prof. Christopher Kelly, and Prof. Wen Li. Specially, I thank Prof. Wen Li for accepting to become the external committee member at the last moment. I appreciate their valuable time for reading, evaluating and suggesting the work on this dissertation.
I would also like to acknowledge the graduate school for providing the graduate teaching assistantship, when I joined the program. I am very much thankful to the research assistant support from the startup and Natioanl Science Foundation (NSF) Division of Molecular and Cellular Biosciences (MCB) funds of my advisor, Dr. Xiang-Qiang Chu. I am also very grateful to the Rumble fellowship from the university that I received in the 2015-2016 academic year, which gave me a huge opportunity to focus and spend more time on the research activities.
All of our experiments are performed at the neutron and X-ray scattering sources at different national laboratories. These experiments and the science what we do would not have been possible without the support from those labs and the staffs working there. Therefore, I am very much thankful to the instrument scientists and staffs, Dr. Eugene Mamontov, Dr. Shuo Qian, Dr. William Heller, Dr. Hugh O’Neill, Dr. Andrey Podlesnyak, Dr. Sai Venkatesh Pingali, Dr. Linin He, Dr. Qiu Zhang, and Dr. Naresh Osti from Oak Ridge National Laboratory; Dr. Madhusudan Tyagi, Dr. John Copley, Dr. Wei Zhou, and Dr. Juscelino Le˜ao from NIST Center for Neutron Research; Dr. Ahmet Alatas and Dr. Bogdan
Laboratory for their help. I greatly appreciate their suggestions and discussions for planning the experiments at the beamlines.
Apart from my academic career, I feel very privileged to have friends Raj Shrestha, Sandip Aryal, Shankar Karki, Giwan Katuwal, Pradip Adhikari, Bishnu Thapa, Anurag Dawadi, Amit Shrestha, Bijay Gurung, Bibek Dhakal and Sujan Sharma. I always enjoyed the time spending with them. I am also thankful to my family members, relatives and other friends for their kind words of motivation. I specially thank my younger brother, Utsuk and sister-in-law, Trishna for their support to the family.
Finally, I would like to remember my parents, who are always my source of inspiration. I think all I have achieved in my life is from their guidance to choose the right path to succeed. Before I finish, I am very thankful to my wife, who has supported in every step of my life and always been there for me through my ups and downs. I truly appreciate for understanding me despite the whatever time I spent with her.
wigglings of atoms.”
This dissertation comprises a four and half years of research work carried out to pursue a Ph.D. degree at the department of Physics and Astronomy, Wayne State University. The main goal of research is to understand the biological activities of proteins by investigating the structure and dynamics at molecular level. All the experiments were performed at na-tional neutron and X-ray facilities of the United States. The works presented here mainly demonstrate the use of various state-of-the-art neutron and X-ray spectrometers to unravel the protein enzymatic activities. The experimental methods, data analysis and the interpre-tation of the results extensively use the broad knowledge of physics for understanding the mechanisms of living systems. Therefore, this work comes under one of the elevating topic in interdisciplinary science, ‘biophysics’.
In the recent years, neutron and X-ray scattering are widely increasing techniques in biomolecular research. Such techniques can be used to study the biomolecular structure and dynamics at sufficiently high-resolution. Several neutron and X-ray scattering techniques have provided a new insight into the existing biomolecular problems. In this dissertation, some of the major biophysical questions are addressed with comprehensive solutions. Chap-ter 1 gives a very brief introduction to the biomolecular structure and dynamics pivotal for their functions. Chapter 2 provides the basic description of the neutron and X-ray scattering theory, techniques, and applications in the study of structure and dynamics of biomolecules. The next four chapters 3, 4, 5 and 6 cover the current biophysical challenges. These chal-lenges (projects) are investigated using neutron or X-ray scattering methods, which provides a new insight for understanding the underlying biological mechanism. Finally, a brief sum-mary of the dissertation is discussed in chapter 7.
Utsab R. Shrestha Detroit, United States
DEDICATION . . . ii
DECLARATION . . . iii
ACKNOWLEDGEMENTS . . . iv
PREFACE . . . viii
LIST OF TABLES . . . xii
LIST OF FIGURES . . . xx
LIST OF ABBREVIATIONS . . . xxi
LIST OF SYMBOLS . . . xxv
LIST OF PHYSICAL CONSTANTS . . . xxvi
Chapter 1 INTRODUCTION . . . 1
Biomolecules . . . 1
Complex structures of protein . . . 3
Protein motion: A heterogeneous dynamic picture . . . 7
Energy landscape and conformational substates . . . 9
Glassy behavior of proteins . . . 11
Protein hydration . . . 13
Role of temperature on protein flexibility . . . 15
Chapter 2 METHODS: NEUTRON AND X-RAY SCATTERING . . . 17
Background . . . 17
Scattering theory . . . 19
Scattering techniques . . . 30
Introduction . . . 40
Materials and methods . . . 46
Data analysis . . . 47
Results and discussion . . . 51
Chapter 4 MECHANISM OF ACTIVATION OF RHODOPSIN . . . 64
Background . . . 64
Photoactivation mechanism of rhodopsin in detergent solution . . . 65
Ligand-induced protein dynamics of rhodopsin . . . 94
Chapter 5 COLLECTIVE MOTIONS IN PROTEINS . . . 109
Role of phonons for enzyme-mediated catalysis in protein . . . 109
Collective excitations in protein as a measure of its softness and flexibility . . . . 128
Chapter 6 CONFORMATION OF PBP BOUND TO PEPTIDE . . . 147
Introduction . . . 147
Materials and methods . . . 149
Results and discussion . . . 150
Conclusion . . . 157
Chapter 7 SUMMARY AND OUTLOOK . . . 158
Struture of biomolecules at physiological conditions . . . 158
Significance of β-relaxation dynamics of proteins . . . 160
Implications of collective vibrations to enzyme function . . . 161
Appendix A COMPARISON OF SAXS INTENSITY OF PDC . . . 163
Appendix C PROJECTS NOT INCLUDED ON THIS DISSERTATION . . . 165 REFERENCES . . . 168 SCIENTIFIC CONTRIBUTIONS . . . 201 CONFERENCE PRESENTATIONS . . . 202 ABSTRACT . . . 204 AUTOBIOGRAPHICAL STATEMENT . . . 207 xi
Table 1.1 Types of motions in proteins at different time-scale. . . 8 Table 3.1 Radius of confined diffusion sphere a (˚A) in IPPase and HEWL calculated
at different temperatures using Eq. 3.4. . . 55 Table 4.1 Guinier analysis of CHAPS micelle, DDM micelle and PDCs from SAXS
data. . . 83 Table 4.2 Model fit parameters for detergent micelles and PDCs. . . 84 Table 4.3 Radius of gyration of DS and LAS of rhodopsin in rhodopsin-CHAPS
complex calculated from Guinier and P(r) analysis. . . 90 Table 4.4 Theoretical SANS intensity profiles of different oligomeric states of
rhodopsin calculated using CRYSON package in ATSAS. PDB 1F88 and PDB 3PQR structures are used for dark state and light-activated state of rhodopsin, respectively. . . 92 Table 5.1 Longitudinal sound velocities calculated from the fitting of dispersion
curves in the acoustic branch with Eq. 5.9. . . 143 Table 6.1 Radius of gyration of MppA and MppA-peptide calculated from Guinier
and P(r) analysis. . . 155
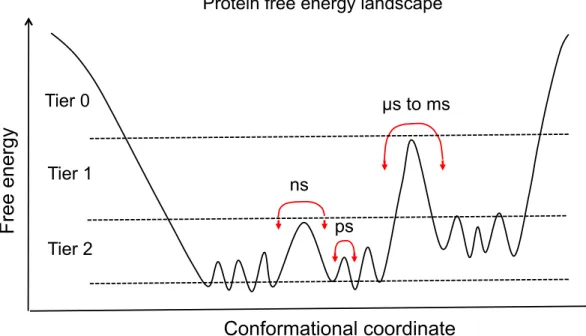
Figure 1.1 Schematic of protein structures. (A) Primary structure, (B) Secondary structures - Alpha helix and beta-sheet, (C) Monomer of lysozyme (tertiary structure), and (D) Quatenary structure of catalase. All the figures are taken from google. . . 5 Figure 1.2 Time-scale of protein motion in protein free energy landscape. . . 10 Figure 1.3 Schematic of the correlation function of different relaxation processes in
proteins (top) and the transition between conformational substates of such processes in the multidimensional free energy landscape (bottom). . . 12 Figure 2.1 Schematic diagram of scattering event. (A) A plane wave of
X-ray/neutron with momentum vector, ki is scattered from the sample, which
is scattered with momentum vector, ks. (B) Representation of scattering
vector ( ~Q), which is the difference between the incident momentum vector (~ki) and the scattered momentum vector ( ~ks). . . 21
Figure 2.2 Schematic of scattering event. . . 23 Figure 2.3 Schematic diagram of coherent and incoherent scattering from the
sys-tem of muti-type atoms. Coherent scattering represents the correlation of all the atoms over time, whereas incoherent scattering corresponds to the correlation of same atom over time. Thus, coherent signal is useful for the structural studies as well as collective motions. On the other hand, inco-herent signal provides the dynamical information of the sample. Neutron scattering contains both coherent and incoherent scattering information, whereas X-ray scattering does not have incoherent signal from the sample. 25 Figure 2.4 X-ray and neutron coherent and incoherent scattering cross-section of
some of the major elements in biomolecules. . . 26 Figure 2.5 Schematic of small-angle scattering experiment. (Left) A plane wave
of X-ray/neutron with momentum vector (ki) is scattered from the sample,
which is scattered with momentum vector (ks) and 2D data is recorded at
the detector . (Right) SAXS intensity profile of murein tripeptide binding protein MppA. Inset: 3D reconstruction of structural envelope of MppA (cyan color) calculated from ab-initio modeling of SAXS intensity profile, which is overlayed on the protein data bank (PDB) structure 3O9P (red color) obtained from X-ray diffraction of crystal MppA. . . 31 Figure 2.6 Schematic of elastic, quasi-elastic and inelastic scattering spectra. . . . 34
270 K measured using direct TOF spectrometer. . . 35 Figure 2.8 Schematic of backscattering spectrometer. . . 37 Figure 2.9 Schematic diagram of accessible time-scale of motion at atomic/molecular
length-scale in biomolecules by QENS spectrometers and other widely used instruments. . . 39 Figure 3.1 Hydrothermal vent of Galapagos Rift along the mid-ocean in eastern
Pacific and the organisms that can survive near it. . . 42 Figure 3.2 Enzymatic activities for Tt-IPPase and HEWL as functions of
temper-ature. The optimal temperatures for activity are 323 K (50 0C) and 358 K
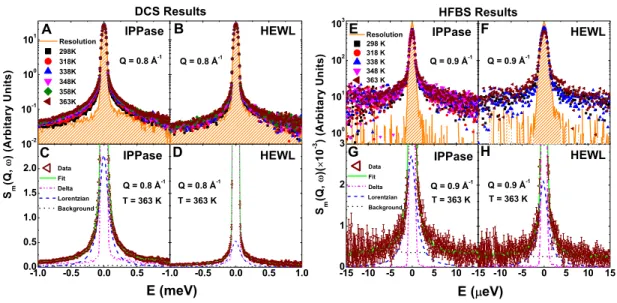
(85 0C) for HEWL and IPPase, respectively. . . 43 Figure 3.3 Normalized QENS spectra from protein samples and data fitting.
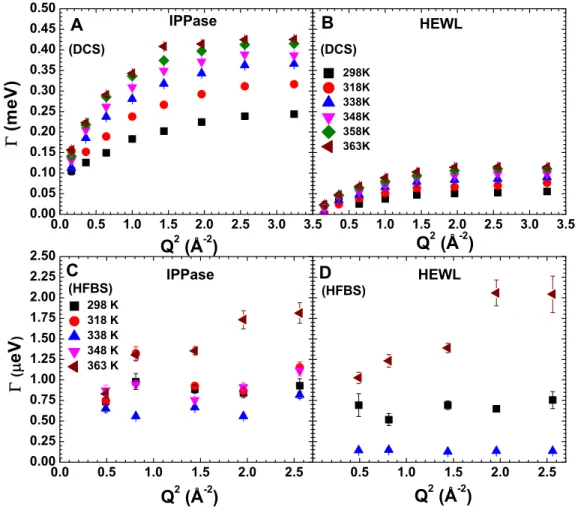
Spec-tra measured at DCS from (A) IPPase and (B) HEWL, respectively, at Q = 0.8 ˚A−1 for temperatures from 298 to 363 K along with resolution. DCS data fitted in energy domain for (C) IPPase and (D) HEWL, respectively, at Q = 0.8 ˚A−1 and T = 363 K. Spectra measured at HFBS from (E) IPPase and (F) HEWL, respectively, at Q = 0.9 ˚A−1 for temperatures from 298 to 363 K along with resolution. HFBS data fitted in energy domain for (G) IPPase and (H) HEWL, respectively, at Q = 0.9 ˚A−1 and T = 363 K. The background is fitted linearly, and elastic and quasi-elastic components are fitted with delta and Lorentzian functions, respectively. In this figure, and in subsequent figures, error bars represent ±1 SD. . . 52 Figure 3.4 Analysis of QENS data in the energy domain at all measured
temper-atures. Lorentzian half width at half maximum (HWHM) of IPPase and HEWL from DCS (A and B) and HFBS (C and D), respectively. . . 53 Figure 3.5 Analysis of QENS data in the energy domain at all measured
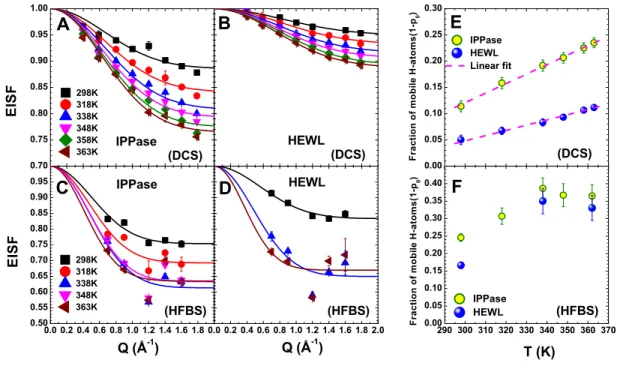
tem-peratures. Elastic incoherent structure factor (EISF) for (A) IPPase and (B) HEWL, calculated from the data measured at DCS. Elastic incoherent structure factor (EISF) for (C) IPPase and (D) HEWL, calculated from the data measured at HFBS. Fraction of mobile H-atoms in a confined diffusion sphere (1 − p0) as a function of temperature for IPPase (yellow circles) and
HEWL (blue spheres), calculated from the data obtained at (E) DCS and (F) HFBS. . . 54
HEWL (B, D, and F), respectively, calculated from DCS data. (G–L) ISFs of H-atoms in hydrated IPPase (G, I, and K) and HEWL (H, J, and L), respectively, calculated from HFBS data. Here, we show results at three temperatures: T = 298 K, 338 K, and 363 K. ISFs are calculated at a series of Q values from 0.5 ˚A−1 to 1.8 ˚A−1. Solid lines represent the curves fitted by Eq. 3.6 . . . 56 Figure 3.7 Fitting parameters obtained from the MCT analysis of the ISF from
DCS data and mean-square displacement (MSD) of IPPase and HEWL from HFBS data. First-order logarithmic decay parameter H1(Q, T ) as a function
of Q for (A) IPPase and (B) HEWL, respectively. (Inset) B1(T ) as a
func-tion of temperature for IPPase and HEWL. (C) β-relaxafunc-tion time constant, τβ plotted as a function of temperature. Dashed lines represent Arrhenius
fit of the relaxation time τβ for IPPase and HEWL. (D) MSD (< x2 >)
of H-atoms in protein samples, IPPase and HEWL, measured by elastic in-coherent neutron scattering at HFBS. The dynamic transition temperature TD for IPPase and HEWL are observed around 220-240 K. . . 59
Figure 3.8 Schematic picture of phase diagram and energy landscape in IPPase and HEWL under high pressure and temperature. (Left) Denaturation phase diagram of IPPase and HEWL (shaded region) as functions of temperature and pressure. The axes in the diagram are not drawn to scale. (Right) Schematic plot of cros-sections through a highly simplified energy landscape of atomic fluctuations for different conformational substates (CSs) in IPPase and HEWL under ambient and 100 MPa (1 kbar) of pressure. . . 61 Figure 4.1 Schematic diagram of mechanism of G-protein-coupled receptor, rhodopsin
binding heterotrimeric guanylate nucleotide-binding G protein (transducin) upon photoactivation. . . 65 Figure 4.2 Mechanism of conformational change in rhodopsin upon activation.
(Left) Isomerization of 11-cis retinal to all-trans retinal upon photoactiva-tion. (Right) Conformational change in rhodopsin, where green is Metarhodopsin II structure (PDB 3PQR) due to light activation and black is dark state rhodopsin (PDB 1F88). . . 67 Figure 4.3 Bio-SANS instrument at High Flux Isotope Reactor (HFIR), Oak Ridge
National Laboratory (ORNL). . . 71 Figure 4.4 SAXS intensity profiles, pair distance distribution function and the
schematic of structure of detergent micelles. The pair distance distribution function, P (r) is calculated from the inverse Fourier transfer of I(q). . . . 75
core-shell ellipsoidal model (Eq. 4.6). . . 77 Figure 4.6 Guinier analysis of rhodopsin-DDM complex at various detergent to
protein ratio. The solid red lines are the Guinier fits. . . 79 Figure 4.7 Schematic of rhodopsin-DDM complex based on core-shell ellipsoid
model fit parameters, where core is rhodopsin (pink color) and the shell is DDM micelle (green color). . . 80 Figure 4.8 SAXS intensity profiles of rhodopsin-CHAPS complex at various
deter-gent to protein ratio. . . 81 Figure 4.9 Guinier analysis of rhodopsin-CHAPS complex at various detergent to
protein ratio. The solid red lines are the Guinier fits. . . 82 Figure 4.10 Theoretical values of scattering length densities (SLDs) of rhodopsin,
DDM and CHAPS. The red dots represent the contrast match point for each of the cases with variation of D2O/H2O ratio in solution. . . 85
Figure 4.11Schematic of contrast matched SANS experiment and the corresponding intensity profiles. The data are measured from rhodopsin in dark state (DS) and light-activated state (LAS), where the rhodopsin is stabilized using two detergents CHAPS and DDM. The data from protein-detergent complexes are measured using 17% and 18% D2O such that scattering length density
of detergent is matched with that of solvent. In this way, after the buffer subtraction, measured SANS intensity only contains the signals from protein (rhodopsin). . . 87 Figure 4.12Guinier analysis and the pair distance distribution function of dark state
(DS) vs. light-activated state (LAS) rhodopsin. The differences between DS vs. LAS of rhodopsin clearly indicates the large conformational change in rhodopsin, crucial for the actiavation of congnate G protein, transducin. . . 88 Figure 4.13 Theoretical SANS intensity profile calculation using known protein data
bank (PDB) structures. (Top) PDB 1F88 - dark sate rhodopsin (black) and PDB 3PQR - light-activated rhodopsin (green). (Bottom) Theoretical SANS profile of dark state rhodopsin at different oligomeric forms: monomer (yel-low curve), dimer (blue curve), trimer (cyan curve), and tetramer (magenta curve). The red curve is generated from the tetramer of light activated structure of rhodopsin. Rhodopsin tetramer structure in dark and light activated states best fit the experimental SANS profile. . . 91
the ligand free apoprotein opsin (open green circles) are nearly identical and both show a dynamical transition TD ∼ 220 K. The inset shows the elastic
incoherent neutron scattering (EINS) intensities for dark-state rhodopsin and opsin respectively. . . 98 Figure 4.15 Ligand-free opsin apoprotein shows slower hydrogen-atom dynamics
compared to the dark-state rhodopsin. Left Panels: QENS spectra for dark-state rhodopsin and ligand-free opsin samples. (A) and (B) Normal-ized dynamic incoherent scattering function, Sm(Q, ω) from two samples
respectively, at Q = 1.1 ˚A−1 from 220 K to 300 K along with resolution. (C) and (D) Analysis of the QENS spectra at Q = 1.1 ˚A−1 and T = 300 K, showing elastic scattering component (delta function shown as dark yel-low line), quasi-elastic scattering components (two Lorentzians indicated by cyan line and magenta line), background (blue line), and the fitted curves (red line). (E) Comparison of the relaxation time (τ ) of dark-state rhodopsin and ligand-free opsin as a function of Q for T = 260 K to 300 K in 10 K steps. 99 Figure 4.16 Full-width at half-maximum (FWHM) of Lorentzian (2Γ1) of CHAPS
component in different samples. (A) Dynamics of CHAPS in bulk CHAPS sample as functions of Q at different temperatures ranging from 220 K to 300 K. (B) FWHM of CHAPS compoment in protein-CHAPS complex samples averaged over all Q-values, corresponding to decoupled CHAPS dynamics in these samples at different temperatures. Note that rhodopsin and opsin correspond to the dark-state and the ligand-free apoprotein obtained after light exposure, respectively. . . 100 Figure 4.17 Full width at half maximum (FWHM) of Lorentzian (2Γ2) of (A)
dark-state rhodopsin and (B) opsin as functions of Q at all measured temperatures101 Figure 4.18 Mode-coupling theory (MCT) analysis of QENS data in the time
do-main. Comparison of intermediate scattering function (ISF) denoted by I(Q, t) for dark-state rhodopsin and opsin at temperatures T = 260 K, 280 K, and 300 K for Q-values from 0.3 ˚A−1 to 1.9 ˚A−1 with a step of 0.2 ˚A−1. The solid lines in the panels are the fitted values to ISF with MCT in β-relaxation region of protein dynamics at the corresponding Q-values and temperatures. . . 102
rhodopsin and opsin at T = 300 K at Q-values from 0.3 ˚A−1 to 1.9 ˚A−1 with 0.2 ˚A−1 step. Solid lines are MCT fits to ISF in β-relaxation region of protein dynamics at various Q-values. (C) and (D) The first order decay parameter H1(Q, T ) as a function of Q for dark-state rhodopsin and opsin
respectively. . . 103 Figure 4.20 A schematic free energy model for the rhodopsin activation process.
(A) Arrhenius plot of characteristic β-relaxation time (τβ) as a function of
inverse temperature for dark-state rhodopsin and opsin. (B) Schematic free energy model representing the rhodopsin activation process. . . 105 Figure 5.1 Static structure S(Q) factor from dry and hydrated GFP samples. The
measured static structure factors of (A) dry GFP and (B) hydrated GFP as a function of wave-vector transfer Q at different temperatures from 150 K to 270 K. . . 115 Figure 5.2 Comparison of static structure factor S(Q) of dry and hydrated GFP
samples at T = 150 K, 180 K, 210 K, 270 K. . . 116 Figure 5.3 Contour plots of INS spectra (raw data) for the lowest (T = 150 K) and
the highest (T = 270 K) measured temperatures are shown for the dry and hydrated samples, and the raw data for rest of the temperatures are shown Appendix B. The insets on each of the panels correspond to the fitting of measured spectra with the damped harmonic oscillation (DHO) model as expressed in Eq. 5.1 at wave-vector transfer Q = 0.64 ˚A−1. . . 118 Figure 5.4 Energy dispersion curves and damping constants of low-frequency
col-lective excitations in dry and hydrated GFP samples. Energy dispersion curves (A) in dry and (B) in hydrated GFP samples at temperatures from 150 K to 270 K. The half width at half maximum or damping constants (Γ) of DHO functions as a function of wave-vector transfer Q at temperatures from 150 K to 270 K. The dashed lines are the fitting of (Γ) with relation Γ(Q) = Q2 at low Q-values as in ordinary glasses. Qm refers to the values
of Q, nearly above which Ω(Q) and Γ(Q) start to deviate from their usual Q dependence. . . 119 Figure 5.5 Comparison between phonon energy dispersion curves in dry and
hy-drated GFP samples at different temperature from 150 K to 260 K, where the dashed lines correspond to the fitting the curve with Eq. 5.3. . . 122
compared, which shows the propagation is slightly faster in the hydrated sample, however, remain almost constant with respect to the temperature in both samples. . . 124 Figure 5.7 Schematic picture of protein complex free energy landscape (EL) for
enzyme catalysis mediated by collective excitations or phonons in proteins. ‘A’ and ‘B’ denote the two arbitrary conformational substates (CSs), where ‘B’ is more favorable for enzyme-mediated catalysis. Sampling of one of the possible pathways in multi-dimensional protein EL for the most favorable CS ‘B’ from partially favorable CS ‘A’ (1) by crossing the energy barrier, E1
(classical approach), (2) due to reduction in barrier height to energy bar-rier (E2) from higher energy barrier, and (3) through quantum mechanical
tunneling across the energy barrier of E3. . . 126
Figure 5.8 Static structure factor S(Q) as functions of Q measured at T = 300 K for native HSA, thermally denatured HSA, warfarin bound to HSA (HSA/warfarin) and ibuprofen bound to HSA (HSA/ibuprofen), represented by black, red, green and blue curves, respectively. All the samples are hy-drated with hydration level h ∼0.4. . . 134 Figure 5.9 Dynamic coherent structure factor measured from (A) native HSA,
(B) thermally denatured HSA , (C) HSA/ibuprofen and (D) HSA/warfarin, and corresponding fitting with Eq. 5.4 at Q = 2.7 nm−1 and T = 300 K. The green circles, black, blue and red curves indicate the experimental data, resolution, DHO function with two Brillouin-side peaks and the best fit to the data, respectively. The hydration levels (h) for all the samples were ∼0.4.136 Figure 5.10 Dynamic coherent structure factor measured from (A) native HSA,
(B) thermally denatured HSA , (C) HSA/ibuprofen and (D) HSA/warfarin, and corresponding fitting with Eq. 5.4 at Q = 19.6 nm−1 and T = 300 K. The green circles, black, blue and red curves indicate the experimental data, resolution, DHO function with two Brillouin-side peaks and the best fit to the data, respectively. The hydration levels (h) for all the samples were ∼0.4.137 Figure 5.11 Dynamic coherent structure factor measured from (A) native HSA,
(B) thermally denatured HSA , (C) HSA/ibuprofen and (D) HSA/warfarin, and corresponding fitting with Eq. 5.4 at Q = 31.2 nm−1 and T = 300 K. The green circles, black, blue and red curves indicate the experimental data, resolution, DHO function with two Brillouin-side peaks and the best fit to the data, respectively. The hydration levels (h) for all the samples were ∼0.4.138
0.4 at T = 200 K and 300 K. The dashed lines represent the fitting of disper-sion curve at low Q-values (acoustic branch) with Eq. 5.3 to calculate the longitudinal velocity (vL) of the sound wave propagation. The longitudinal
sound velocity is calculated for those, which has more than two data points in the acoustic branch of the corresponding dispersion curve. . . 140 Figure 5.13 Damping constants of phonons calculated from the samples of native
HSA, thermally dentured HSA, HSA/warfarin and HSA/ibuprofen samples with h ∼0.4 at T = 200 K and T = 300 K. The dashed lines represent the fitting by a relation, Γ(Q) = AQ2 at low Q-values (acoustic branch) similar
to the glasses, where an arbitary A is a constant. . . 141 Figure 5.14 Phonon dispersion curves (Ω vs. Q) calculated from native HSA and
thermally dentured samples with hydration level h ∼ 0.4 at T = 200 K. . . 142 Figure 5.15 Schematic diagram of measure of softness and rigidity in native and
denatured protein. (Left) Native structure of human serum albumin (PDB 1O9X), where the structural property, softness and rigidity are balanced by protein for biological function. (Right) Thermally denatured protein, which is softer than the native protein due to the breakdown of weak bonds such as hydrogen bonds, and van der Waals interaction, and loses its activity. . 145 Figure 6.1 SAXS intensity profiles of (A) MppA and (B) MppA-peptide. The solid
red curves are the fitting of intensities with spherical form factor, which best fit the data. . . 151 Figure 6.2 Guinier plots for (A) MppA and (B) MppA-peptide. The solid red
curves are the Guinier fits, where the slope gives the radius of gyration (Rg)
of the monodisperse particle. . . 151 Figure 6.3 Kratky plots for (A) MppA and (B) MppA-peptide, which has the
bell-shaped feature in the range 0< qRg <3 with maximum at qRg ∼1.7.
These plots strongly confirms that the protein has compact folded structure in solution. . . 153 Figure 6.4 Pair distance distribution functions of MppA and MppA-peptide. The
bell-shaped curves with maximum at ‘r’ represent the spherically shaped globular protein having radius ‘r’. . . 154 Figure 6.5 3D reconstruction of (A) MppA and (B) MppA-peptide from measured
SAXS data using the programs DAMMIF, SUPCOMB and DAMAVER in software package ATSAS. . . 156
1D One-dimensional
2D Two-dimensional
3D Three-dimensional
tRNA transfer ribonucleic acid
COX Cyclooxygenase
PGH2 Prostaglandin H2
ACE Angiotensin converting enzymes MBP Maltose-binding protein
MppA Murein peptide permease A IPPase Inorganic pyrophosphatase
PPi Pyrophosphate
Pi Orthophosphate
Tt Thermococcus thioreducens HEWL Hen-egg white lysozyme GPCR G-protein-coupled receptor
7TM Seven alpha-helical transmembrane DDM n-docecyl-β-D-maltoside
CHAPS 3-[(3-cholamidopropyl)dimethylammonio]-1-propanesulfonate DDAO Dodecyldimethylamine oxide
RDM Rhodopsin disk membrane GFP Green fluorescent protein
HSA Human serum albumin
BSA Bovine serum albumin
PBP Periplasmic ligand-binding protein IPTG Isopropyl-D-thiogalactopyranoside AFP Anti-freeze protein
ND Nanodiamond
GF Graphene foam
PDC Protein-detergent complex CMC Critical micellar concentration SDS Sodium dodecyl sulfate
PAGE Polyacrylamide gel electrophoresis NMR Nuclear magnetic resonance SDSL Site-directed spin labeling BNS Brillouin neutron spectroscopy AFM Atomic-force microscopy CVD Chemical vapor deposition ATP Adenosine triphosphate SAS Small-angle scattering
SANS Small-angle neutron scattering SAXS Small-angle X-ray scattering WAXS Wide-angle X-ray scattering TOF Time-of-flight
QENS Quasi-elastic neutron scattering INS Inelastic neutron scattering IXS Inelastic X-ray scattering
EINS Elastic incoherent neutron scattering FWS Fixed window scan
MD Molecular dynamics
SLD Scattering length density HWHM Half-width at half maximum FWHM Full-width at half maximum
ISF Intermediate scattering function iFT inverse fourier transform
MSD Mean-square displacement MCT Mode coupling theory TH Thermal hysteresis
NV Nitrogen-vacancy
EL Energy landscape
DHO Damped-harmonic oscillator
DS Dark-state
LAS Light-activated state LED Light emitting diode
EC Enzyme commission
PDB Protein data bank SD Standard deviation
UV Ultraviolet
CS Conformational substate PAN Peak analysis software
DAVE Data analysis and visualization environment BASIS near-backscattering spectrometer
HFIR High-flux isotope reactor SNS Spallation neutron source DCS Disk chopper spectrometer
HFBS High flux backscattering spectrometer
NIST National institute of standards and technology NCNR NIST center of neutron research
BNL Brookhaven national laboratory
ORNL Oak Ridge national laboratory APS Advanced photon source
TD Dynamic transition temperature λ Wavelength ~k Momentum-vector ~ v Velocity ~
Q, ~q Wave-vector transfer or scattering vector
ω Energy tranfer
b Scattering length
σ Scattering cross-section ρ Scattering length density S(Q), S(q) Static structure factor I(q) Scattering intensity
I(0) Forward scattering intensity P (r) Particle form factor
Rg Radius of gyration
Dmax Maximum dimension of a particle
S(Q, ω) Dymnamic structure factor I(Q, t) Intermediate scattering function < x2 > Mean-square displacement
Γ(Q) Half-width at half maximum a Radius of a confined sphere p0 Fraction of immobile atoms
τβ Characteristic β-relaxation time
kB = 1.38×10⁻²³ J/K Boltzmann’s constant
h = 6.626×10⁻³⁴ J s Planck’s constant c = 2.99×10⁸ m/s Speed of light R = 8.314 J/mol K Ideal gas constant
CHAPTER 1 INTRODUCTION
“Life ... is a relationship between molecules.” - Linus Pauling
1.1 Biomolecules
Biological molecules are the basis of all the living organisms that help in growth and survival. They are mainly made up of complex organic compounds with carbon, hydrogen and oxygen as fundamental constituents along with other elements like nitrogen, sulphur, phosphorous etc to form macromolecules. These macromolecules are present in the cells and tissues that enable an organism to function biological activities. The four main classes of
biological macromolecules are carbohydrates, lipids, nucleic acids and proteins [1]. Carbo-hydrates such as starch and glycogen act as energy storage molecules. Plants store their food in the form of starch during the photosynthesis, whereas many animals store energy as glycogen. Cellulose is carbohydrate that is present in the cell wall of bacteria and plants to provide rigidity to the organisms. Some carbohydrates are associated to several proteins and lipids in the form of glycoproteins and glycolipids respectively for specific functions. Lipids are non-polar organic molecules, which are insoluble in water responsible for long-term energy storage. Ribonucleic acid (RNA) such as messenger RNA, transfer RNA and ribosomal RNA carry out the synthesis of necessary proteins. On the other hand, deoxyri-bonucleic acids (DNAs) are capable of storing the genetic information in the cells. Similarly, proteins are another important biomolecules that play vital roles in catalytic activities, cel-lular signaling, regulations of biological processes and defense against bacteria and viruses. One of the major roles is the transportation of oxygen through blood to different tissues by haemoglobin, a protein attached to heme group. Therefore, the biological macromolecules are responsible for all life processes.
Enzymes are the proteins that catalyze the biochemical reactions by the processes such as bond formation and break-down. They are responsible for the synthesis of biological macromolecules, break-down of nutrients and transforming chemical energy into metabolic activities. Many enzymes require the additional chemical groups, such as Mg2+, Zn2+, Mn2+, Fe2+ or complex organic molecules, known as coenzymes to perform the catalytic activities.
Specific functional groups are transiently carried by the coenzymes during the cellular pro-cesses. In general, enzymes are provided the name by adding -ase in the suffix. They are categorized into six different classes according to the types of the reaction they catalyze:
Isomerases - rearrange atoms within a molecule, Hydrolases - transfer functional groups to water, Oxidoreductases - transfer hydride ions, Transferases - transfer group reactions, Lyases - add groups to double bonds and Ligases - form C C, C S, C O and C N bonds by condensation reactions coupled to ATP cleavage. All these catalytic reac-tions at cellular levels are affected by the activity of proteins and their posireac-tions within the cells. The collective mechanism of all the processes carried out by the enzymes and coen-zymes at the level of cells and tissues affect the physiological properties and hence overall function of the organisms [1].
Due to the predominant role of proteins in the life processes, loss in their activity can cause many severe diseases in humans such as Alzheimer, Parkinson, cancer and many other metabolic deficiencies. Thus, about 80% of the therapeutic drug targets are proteins. Most of the pharmaceutical drugs bind with the active sites of enzymes, which deactivate them and hence help in reducing or curing the particular diseases. For example, a drug like ibuprofen helps in reducing pain, inflammation or fever by restraining Cyclooxygenase (COX) enzymes, which convert arachidonic acid to prostaglandin H2 (PGH2). Similarly, the anti-hypertensive
classes of drugs are used to treat the high blood pressure. These drugs inhibit the activity of angiotensin converting enzymes (ACE). Furthermore, enzymes have growing application in industry due to their catalytic behavior on the substrates to yield high-efficiency under the ambient conditions. These applications include starch processing, dairy, baking, brewing, detergent, animal feed, bio-sensors and many other [1].
1.2 Complex structures of protein
Proteins are the complex hierarchically organized structures with overcrowding molecules. The fundamental structure of protein starts with the long chain or sequence of amino acids,
known as primary structure [2, 3]. The different segments or groups of such amino acids form ordinary shapes like helices, sheets or loops. These are called secondary structures. Further, the secondary structure provides three-dimensional configuration by folding into specific shape, termed as tertiary structure. In general, most of the proteins perform the biological activities based on their tertiary structure and hence it is considered as the native structure [4, 5]. Nevertheless, many proteins exist in nature with more than one tertiary structure folded together to form a biologically active complex, known as quaternary struc-ture. The schematic of protein structures are shown in Fig. 1.1 A [6], B [7], C [8], and D [9]. These structures play a vital role in biochemical functions such as catalysis, molecular signaling, providing structural components, molecular switches and binding with substrates. The primary structure of protein consists of 20 different amino acids held together by peptide bonds. The amino acids comprise the central carbon atom or α-carbon (Cα),
surrounded by four different substituents. These substituents are hydrogen atom, carboxyl group (COOH), amino group (NH2) and side-chain (R). All the amino acids have common
α-carbon along with hydrogen atom, carboxyl and amino groups, which is called a backbone. But, they differ from each other due to their side-chain group. Thus, amino acids are often considered as residues when included within protein chain due to the uniqueness of the side-chain group. The 20 natural amino acids are: Glycine (Gly), Alanine (Ala), Valine (Val), Leucine (Leu), Isoleucine (Ile), Proline (Pro), Phenylalanine (Phe), Serine (Ser), Threonine (Thr), Cysteine (Cys), Asparagine (Asn), Glutamine (Gln), Glutamate (Glu), Aspartate (Asp), Histidine (His), Arginine (Arg), Lysine (Lys), Methionine (Met), Tyrosine (Tyr) and Tryptophan (Trp). Due to their tendency to interact with each other and water, they have important role in biochemical property of proteins. The amino acids, Ala, Val, Leu, Ile, Pro,
A
B
C
D
h"ps:// en.wikipedi a.org/wiki/
Amino_acid h"p://oregonstate.edu/instruc9on/bi314/summer09/Fig-‐02-‐19-‐0.jpg
h"p://cen.xraycrystals.org/lysozyme.html h"p://www.wikidoc.org/index.php/File:Catalase_Structure.png
α-helix Hydogen bond
Hydrogen bond
Amino acids
Amino acid
β-sheet
Figure 1.1: Schematic of protein structures. (A) Primary structure, (B) Secondary struc-tures - Alpha helix and beta-sheet, (C) Monomer of lysozyme (tertiary structure), and (D) Quatenary structure of catalase. All the figures are taken from google.
Phe and Ser are hydrophobic in nature that only interact with van der Waals force giving rise to hydrophobic effect. On the other hand, amino acids, Thr, Cys, Asn, Gln, Glu and Arg are hydrophilic, which make hydrogen bonds with each other, peptide backbone, organic molecules and water. The remaining amino acids, Lys, Met, Tyr and Trp are amphipathic (both hydrophobic and hydrophilic) that help them to form interfaces.
The residues in polypeptide chain fold into helical or spiral structure, which is the first type of secondary structure discovered by Linus Pauling in 1951 and it is termed as α-helix.
It consists of hydrogen bonds inside forming the repeating pattern and the oxygen atom on the carbonyl group. Each helix turn contains 3 or 4 residues with distance between adjacent Cα as 1.5 ˚A, giving rise to very compact structure. On the other hand, a very less compact
structure with 5 to 10 residues and distance of about 3.5 ˚A between the adjacent Cα is
formed. This is the second type of secondary structure, known as β-strand and the number of β-strands forms a β-sheet that are linked together by the regular hydrogen bond between N—H and C—O in the backbone of amino acids. α-helices and β-sheets are very common structures within proteins to provide the compactness to fit into the overcrowded cytoplasm of the cell. Such nature of secondary structures helps to fold into specific configuration, which is the basis for the global three-dimensional structure, known as tertiary structure. The tertiary structure executes the complex biological functions. Futhermore, the tertiary structure can be globular or fibrous. The globular proteins are soluble in water with almost spherical shape that are responsible for most of the enzymatic activities, whereas fibrous pro-teins are water-insoluble with elongated structure that provide mechanical strength to the organisms. Quaternary structure of protein consists of several tertiary structures folded to-gether by non-covalent bonds to gain the compactness and stable configuration. Based upon the number of polypeptide chains, such structure is termed as monomer (only 1 chain), dimer (2 chains), trimer (3 chains) and so on. Protein is considered as oligomer, if it exceeds more than one chain, in general, with even number of chains.
The folded structure of protein is stabilized by the following bonds: covalent bond, disulfide bond, salt bridge, hydrogen bond, electrostatic interaction and van der Waals in-teraction. All these forces bring amino acids together for interaction with each other and thus help to fold. Most of the interactions between different residues are non-covalent that
allow stabilization of folded structure. These interactions are very weak compared to the covalent bond, thus leading the protein as dynamic entity. The electrostatic interactions mainly occur on the surface of the protein due to interaction between the polar residues and ions of the solvent. Non-polar interactions take place inside the protein cores providing compactness that optimize van der Waals interactions.
1.3 Protein motion: A heterogeneous dynamic picture
It has been well understood that the proteins are the heterogeneous dynamic entities rather than the static pictures. They continuously fluctuate about their average structure showing the wide variety of internal motions from femtoseconds to seconds [10]. Such di-verse motions are responsible for many biological activities within the organisms. A large number of functional groups in protein is connected by the strong covalent bonds with the polypeptide chain providing the structural rigidness. However, the side-chain groups are in-trinsically capable of rotating and jumping from one position to the other due to the available thermal energy [10]. Such local motions have very small atomic displacements that occur in a very short time-scale of the order of few femtoseconds to a nanosecond. On the other hand, the large amplitude motions in slow time-scale (hundreds of nanoseconds to a few seconds) are due to the rigid body motions such as loop movement, hinge motion, collective domain motion, and movement during the protein folding mechanism. All these motions in proteins play a major role in several biochemical processes crucial for biological activities such as - formation and breakdown of covalent bonds; making of hydrogen bonds; transfer of protons, electrons, hydride ions between chemical groups; electron tunneling; structural reorganization of solvent; enzyme catalysis; ligand binding and allostery; protein folding and denaturation [1]. The wide variety of motions in proteins occurring at different time-scale
are listed in Table 1.1 below [1].
Protein dynamics are crucial for the biophysical and biochemical processes. However,
Table 1.1: Types of motions in proteins at different time-scale.
Time-scale (second) Type of protein motions
10−14− 10−13 Bond vibration
10−12− 10−11 Elastic vibration of globular region
10−12− 10−9 Methyl group rotation
10−11− 10−10 Roatation of surface side-chains
10−11− 10−7 Hinge bending of domain interfaces
10−9− 10−6 Loop movement
10−8− 10−7 α-helix formation
10−6− 10−3 Large domain motions
10−6− 104 Protein folding
the direct correlation of a wide range of protein dynamics to its function still remains a matter of broad discussion. There are several indirect experimental evidence that supports the heterogeneous motion to the protein activity, which is also theoretically validated by the molecular dynamic simulations. The fast motions from femtosecond to picosecond promotes the hydrogen-transfer reactions essential for enzyme-mediated catalysis. Such chemistry of enzyme has been observed from the study of kinetic isotope effects and computational methods [11–13]. The experimental and theoretically simulated observations of the atomic fluctuations in the hinge regions of adenylate kinase occurring in the time-scale of picosecond to nanosecond expedite the large amplitude, slow lid motions [14]. This helps in produc-ing catalytically competent state suggestproduc-ing the linkage between the fast motions and the catalytic activities. The folding mechanism of protein to its functional conformation occurs from the nanoseconds to microseconds [15]. NMR study of the three-helix bundle protein
Engrailed homeodomain suggests the sudden collapse of protein structure to the intermedi-ate structure with a large number of α-helices during the folding process. Such structures are the major component of the denatured state under the conditions that favors the folding with unstructured side chains. This study has allowed to characterize all of the necessary structures along the folding and unfolding pathways in proteins [15]. Recent single-molecule kinetic analysis on maltose-binding protein (MBP) provided the direct evidence of ligand binding and dissociation by studying the intrinsic opening rate of the protein. Such hinge motion occurs from microsecond to second that is essential for signal transducin, enzyme catalysis, and cellular regulation [16, 17].
1.4 Energy landscape and conformational substates
Proteins are the dynamic soft matter rather than a static objects for physicists. Thus, the understanding the real-time activity of protein requires the inclusion of the fourth dimension as ‘time’ in addition to the physiologically freeze-trapped three-dimensional crystal structures [14, 18]. This introduces the idea of the multidimensional free energy landscape, which defines the relative probabilities of several protein conformations at equilibrium or non-equilibrium state [14, 18]. The thermal energy of the order of kBT per atom, where kB is the Boltzmann
constant and T is the absolute temperature, triggers the biomolecules to sample different conformations around the average structure. Such slightly different conformations are called conformational substates (CSs) [19]. CSs are due to the wide range of spatial and temporal scales of protein internal motions. They are usually separated by the energy barrier in the multidimensional free energy landscape that is rugged forming hills and valleys of varying heights and depths [20]. Each valley represents the CS, which may have the same overall structure and biological activity, but significantly different structural details and the rate of
the activity [19]. The available thermal energy is very crucial for the specific CS. Protein structure switches the CS instantaneously exploring the free energy landscape. At very low temperature, the protein conformation remains confined in a particular CS. But, at the physiological temperature, protein samples CSs for the minimum potential energy. Such sampling motions of the protein conformation can be described similar to the equilibrium fluctuations and relaxation processes in glasses and spin glasses [21].
The idea of protein free energy landscape along with CSs has been well-accepted and has
Bond vibration Side-chain rotamers
Methyl rotation Loop motion
Large domain motions
femtoseconds picoseconds nanoseconds microseconds milliseconds seconds
Protein local flexibility Large collective motions
Timescale of protein motions
µs to ms ps ns
F
re
e
en
erg
y
Conformational coordinate
Tier 2 Tier 1 Tier 0Protein free energy landscape
Figure 1.2: Time-scale of protein motion in protein free energy landscape.
become very intuitive for exploring the protein dynamics at different time-scale. Accordingly, the slow and fast dynamics of proteins can be represented in the free energy landscape divided into three distinct tiers as shown in Fig 1.2 [18]: tier-0 defines the larger amplitude and slower dynamic processes in the time-scale of microseconds to milliseconds, whereas
tier-1 and tier-2 represent the small amplitude fast dynamic processes from picoseconds to nanoseconds [18]. Tier-0 dynamics (slow process) includes the slow transition between protein conformations separated by the energy barrier much larger than kBT . Such events
occur rarely due to the less probability of the conformation that allows the transitions [14, 18]. The conformational transitions in tier-0 are essential for the various biological processes such as protein-protein interaction, enzyme catalysis, ligand binding and signal transduction. On the other hand, tier-1 and tier-2 dynamics include the rapid fluctuations within the valleys of tier-0. Such fluctuations are the transitions between CSs usually separated by the energy barriers less than kBT . These dynamics are the statistically distributed CSs due to the
fluctuations of small groups of atoms on the nanosecond time-scale such as loop motions and the local atomic fluctuations on the picosecond time-scale such as side-chain rotations [14, 18]. The biochemical processes such as hydride transfer, electron transport, and electron tunneling that are crucial for the enzyme catalysis, fall within these tiers. These slow and fast conformational dynamics allow proteins to inherit the local and global flexibility necessary for enzyme activity.
1.5 Glassy behavior of proteins
Many studies suggest the short-time small amplitude fluctuations of residues in proteins are liquid-like, whereas the large amplitude motions for the stabilization of folded structures are analog to the solids [10]. In fact, they are the densely packed complex molecules that can be considered as aperiodic crystals. Thus, from the physics point of view, proteins are many-body systems that fold into the three-dimensional structures. Although some of their properties are similar to the liquids and solids, they possess characteristic structure and dynamic phenomena analog to the glasses and spin glasses. The most common feature of
β-relaxation region (power law or log-decay) Ballistic region α-relaxation region (stretched exponential) C o rr el ati o n fu n cti o n t (ps) 10-3 10-2 10-1 100 101 102 103 104 105 0.0 0.2 0.4 0.6 0.8 1.0
Figure 1.3: Schematic of the correlation function of different relaxation processes in pro-teins (top) and the transition between conformational substates of such processes in the multidimensional free energy landscape (bottom).
proteins and glasses is the noncrystallinity, which are amino acid residues in proteins and glassy liquids in glasses [22]. Therefore, they both consist of nonperiodic spatial arrangement of atoms or molecules. Such structure is randomly oriented in glasses, whereas selected by the evolution for the biological function in proteins [23]. The atoms in glasses and spin glasses are held together by the strong forces in all three directions. Similary, the large number of functional groups are connected to the backbone or polypeptide chain by the strong covalent bonds and the cross-links are made by the weak forces such as hydrogen bonds,
disulfide bonds, van der Waals interaction and salt bridges in proteins. Furthermore, several experimental results have elucidated the glass-like behavior of proteins. Such behaviors are the existence of both short- and intermediate-range orders forming the random elastic networks; the dynamic transition at temperature TD ∼200 K - 240 K due to the rapid onset
of anharmonic motions; the transition from liquid-like to solid-like behavior upon folding into the native structure; the denaturation of protein yields strong-to-fragile liquid transition; the existence of a boson peak, one of the typical characteristics of the glass formers; the slow α-relaxation process due to the large domain motions and the fast β-relaxation process due to the local structures and the side chains [22]. Basically, proteins possess a non-exponential relaxation of the density correlation function over a wide range of time-scale similar to the glasses. Such processes can be simplified into three different regions: (i) very fast Gaussian-like ballistic region of the order of few femtoseconds, (ii) β-relaxation region in the time-scale of few picoseconds to a couple of nanoseconds that can be represented either by the power-law or logarithmic decay, and (iii) finally followed by the α- relaxation region in the time range of hundreds of nanoseconds to few milliseconds governed by the stretched exponential decay or Kohlrausch-Williams-Watts law [22]. The α- and β-relaxation processes can be represented in the multidimensional free energy landscape by the transitions A←→B and C↔D respectively as shown in Fig. 1.3. For the α-relaxation process, Ea kBT , whereas
for β-relaxation process, Ea . kBT .
1.6 Protein hydration
Hydration water in biomolecules is an essential component of the biological activities. It dramatically influences the enzyme reaction rates, folding and unfolding of the native structure, ligand-binding and many other biological functions of globular proteins as observed
experimentally from structural, dynamical and thermodynamical investigations [24, 25]. For the full hydration of a globular protein with at least a monolayer of water requires hydration level (h) of ∼0.38 (i.e., 0.38 gram of water per gram of protein) [24, 25]. Protein behaves more like solid at such hydration and the hydration water is more viscous compared to the bulk water [24, 25]. Moreover, the water in the hydrated protein can be considered at two specific regions bound to the protein ignoring any presence of bulk water on the outermost surface: (i) the strongly bound internal water molecules in the cavities and deep clefts of the protein, and (ii) surface bound water molecules that are structurally and dynamically different from the bulk one [26]. The former water molecules are responsible for providing flexibility with sufficient amount of thermal energy, but may unfold or denature the protein molecules under extreme conditions such as high temperature or pressure. On the other hand, the latter water molecules largely influence the rapid onset of anharmonic motions of protein at physiological temperature. Such dynamic behavior of protein and hydration water has been observed at temperature 200 K - 240 K, known as dynamic transition temperature, TD in several inelastic and quasielastic neutron scattering experiments [27–32].
The coupled motions of the protein-water system have been still under investigation to comprehend the role and influence of hydration water to protein motions and functions. The long-debated issue is that, whether the protein dynamic heterogeneity slaves to such hydration shell or it is just coupled to some extent [33–36]. One of the evidence of such controversial topic is the dynamic transition observed at TD in the hydrated protein analog
to that of the bulk water [27, 28, 35, 37–42]. H. Frauenfelder and colleagues proposed the folding mechanism of protein, which slaves to the solvent dynamics occurring in the time-scale of microseconds to hours [34]. In addition, P. W. Fenimore et al. revealed both solvent-slaved
and non-slaved dynamic processes in protein [33]. On the other hand, S. Khodadadi et al. showed the experimental evidence of solvent independent dynamics and strongly suggested to reconsider the concept of slaved dynamics of protein to hydration shell [36]. Thus, the universal picture of pathways for the dynamic processes in hydrated protein has yet to be discovered.
1.7 Role of temperature on protein flexibility
The native conformation of protein that we consider is the most stable state or the state with the minimum energy under the physiological conditions. However, the protein can sample the CSs with slightly different energy through the available thermal energy in the absence of other force [1]. Thus, the distribution of CSs in protein is statistical in nature and depends on the surrounding temperature. The protein has the thermal energy of the value equal to RT , where R is the gas constant and T is the absolute temperature. This thermal energy at room temperature can be converted into the kinetic energy for the bond vibration and atomic fluctuations. Thermal fluctuations act as the lubricant in protein that enables the conformational changes on a physiological time-scale [42]. At absolute zero temperature, the atoms are tightly bound within a single conformation. When the temperature is increased, the protein starts to vibrate harmonically about its equilibrium position in one CS. Further, if the temperature is raised to provide the sufficient thermal energy, then the motion of protein changes from harmonic to anharmonic due to jump between CSs [42]. Thus, the protein becomes soft and flexible and, hence biologically active. Such dynamic transition in proteins including other biomolecules is observed at TD ∼200 K - 240 K. Therefore, the
temperature plays a major role for the conformational flexibility of proteins for enzymatic activities by increasing their conformational fluctuations. Nonetheless, the protein structure
CHAPTER 2 METHODS: NEUTRON AND X-RAY SCATTERING Tyr66% Tyr145% Ser65% Ser205% Arg96% His148% Glu222% Val150% Val68% Val61% Phe165% Thr62% Thr203% Ile167% Gln183% Gln69% Gln94% Neutron/ X-ray source Detector Incident Scatter ed
“Neutrons tell us where atoms are and how they move.” - Clifford Shull
2.1 Background
The structural and dynamical features of solids and liquids at atomic resolution can be studied by the fundamental nature of X-rays and neutrons. The wavelengths of both X-rays and neutrons are comparable to the atomic spacing in solids and liquids, thus, they can probe the structural features within the length scale from ∼1 to 1000 ˚A. On the other hand, they have kinetic energies comparable to the dynamic phenomena in matters, which makes them possible to explore the dynamic processes of characteristic time scale from 10−15 to
10−6 seconds [43–47].
The low energy X-rays and neutrons interact weakly with matters and can penetrate deeply. Thus, both are non-destructive to the samples under the beam. However, the in-teractions of X-rays and neutrons with matters are significantly different from each other. X-rays interact with the electron cloud surrounding the atomic nuclei. Thus, the heavier atoms with a large number of electrons scatter more compared to the lighter atoms with a fewer number of electrons. This means the probability of interaction of X-rays with mat-ters increases monotonically as a function of electron numbers [45, 48]. On the other hand, neutrons are chargeless particles with almost zero electric dipole moment so that they can penetrate more than X-rays and the charged particles like electrons. Neutrons interact through the nuclear forces with atoms, which are short-range of the order of fermi (1 fermi = 10−15 m). The interaction between neutrons and atomic nuclei depends upon the nu-clear state and nunu-clear spin (since neutron has non-zero magnetic moment) [43, 44, 49, 50]. Furthermore, neutrons are isotope sensitive and thus, for instance, deuterium (2H) scatters
about 3 times more than hydrogen (1H), which is indistinguishable for X-rays [43, 44].
X-ray and neutron scattering are widely used techniques in all forms of natural sci-ences such as physics, chemistry, biology, medicine, engineering, geology and many other [47, 48, 51, 52]. The most successful technique is diffraction that have revealed the crystal structures at atomic resolution of many solids including complex structure of biomolecules like proteins, DNA, RNA etc. In last couple of decades, the small-angle scattering has been successfully implemented to resolve the macromolecular structures in solution [47, 48]. Specifically, solution scattering has become the most successful technique to study the struc-ture of biomolecules over X-ray/neutron crystallography and NMR spectroscopy. Since the
crystallography and NMR techniques require the good crystals and the low molecular mass samples respectively, a significant number of biomoleucles cannot be synthesized in such manner. In such cases, small-angle solution scattering has become an important comple-mentary tool for these initiatives. For instance, the membrane proteins such as rhodopsin and aquaporin-0 are difficult to crystallize, but they can be solubilized and stabilized us-ing detergent (amphiphilic molecules) in solution [53–56]. Thus, the solution scatterus-ing of protein-detergent complex can be useful tool to predict the structure of membrane proteins mimicking the native environment as with lipids. In addition, neutron and X-ray spec-troscopies have been widely used to investigate the quantum phase transitions and critical points; phonons and electronic excitations in solids; boson peaks in glasses; diffusive mo-tions in glasses and glass forming liquids; phase diagrams of surfactants; magnetic order and spin fluctuations in highly correlated systems; glass transition and reptation in polymers; transport phenomena in solids and glasses; lipid-membrane and protein-protein interactions. Furthermore, neutron scattering has a great advantage over most of the available techniques for studying the dynamics of biomoleucles. This is because more than one-half of the atoms in biological macromolecules are hydrogen, which has the largest incoherent neutron scattering cross-section [50, 52].
2.2 Scattering theory
The energy of X-ray and neutron are given by Eq. 2.1 and Eq. 2.2 respectively as expressed below,
EX =
hc
and EN = 1 2mNv 2 = ~ 2k2 2mN (2.2)
where |~k| = 2πλ , ~k is the momentum or wave vector, λ is the wavelength, ~ = 2πh, h is the planck’s constant, c is the speed of electromagnetic wave, v is the velocity of neutron and mN
is the mass of neutron. In a scattering experiment, the scattered X-ray or neutron undergoes a change in momentum and energy after interacting with the sample as depicted in Fig. 2.1. The change in momentum is described by a momentum transfer vector or the scattering vector ( ~Q) given by,
~
Q = ~ks− ~ki (2.3)
where ~ki and ~ks are the incident and scattered wave vectors respectively. The change in
momentum is ~Q. Also, the change in energy due to the change in magnitude of the wave vector (~k) for X-ray and neutron are given by Eq. 2.4 and Eq. 2.5 respectively:
∆EX = Es− Ei = ~ω = ~c(|~ks| − |~ki|) (2.4) and ∆EN = Es− Ei = ~ω = ~ 2 2mN (k2s− k2 i), (2.5)
where ω is the frequency of energy transfer, Ei and Es are the energies of incident and
scattered X-ray/neutron respectively.
According to the wave theory, X-ray and neutron scattering experiments involve the interference phenomena between the wavelets scattered by the different scattering centers in the sample. These scattering centers are electrons for X-rays and nuclei for neutrons. The
!!
!
! !! !!!
!!! ! Es<Ei Es>Ei Es=Ei Sample !!=
-
!!!
! !!!
! !!!
! A BFigure 2.1: Schematic diagram of scattering event. (A) A plane wave of X-ray/neutron with momentum vector, ki is scattered from the sample, which is scattered with momentum
vector, ks. (B) Representation of scattering vector ( ~Q), which is the difference between the
incident momentum vector (~ki) and the scattered momentum vector ( ~ks).
incident beam of X-rays or neutrons is considered as the monochromatic wave that can be represented by a plane wave as,
ψi = eikz (2.6)
where z is the distance between the scattering center and the detector. For a scattering event considering a fixed scattering center, the scattered wave is a speherical wave given by,
ψs= −
b r e
ikr (2.7)
The quantity b is known as the scattering length of the scattering center, which is defined as the measure of the scattering ability of the scattering center after interaction with the incident X-ray or neutron. The negative sign in Eq. 2.7 is arbitary, which is used so that the positive
value of b indicates a repulsive interaction. The scattering length b is a complex number; the real part represents the scattering event, whereas the imaginary part corresponds to the absorption by the sample. Therefore, when the incident beam of X-rays/neutrons interacts with the sample, X-rays/neutrons are absorbed or scattered or both. The absorption is due to trapping by electron cloud (for X-rays) and by nucleus (for neutrons). On the other hand, scattering phenomenon is due to the very low energy of incident X-rays/neutrons that is not enough to create the internal excitations of the electronic shell (for X-rays) and the nucleus (for neutrons) [57]. However, the motions of the scattering centers such as thermal fluctuations and diffusion phenomena can be detected, which correspond to the energy much smaller than the incident X-rays/neutrons. If we consider the absorbing and scattering cross-sections of the target as σaand σs respectively, then the number of absorbing and scattering
events after interaction of target with the incident beam of X-rays/neutrons are given by Eq. 2.8 and Eq. 2.9 respectively as expressed below,
Na= φiσa (2.8)
and
Ns= φiσs (2.9)
where φi is the flux of incident beam, which has a unit in number of scattering events
per second per barn (1 barn = 10−24 cm2). The fundamental quantity determined in any
scattering experiment is the differential scattering cross-section (dσs/dΩ), which is defined
direction ~Ω/ ~|Ω| as shown in Fig. 2.2 and is given by, dσs dΩ = Ns φidΩ (2.10)
Then, assuming the scattering event is axially symmetric that depends only on the zenith
!!
!
! dS θ Φ dΩ r !!!
! z x y DetectorFigure 2.2: Schematic of scattering event.
angle (θ), but not on the azimuthal angle (φ), the total scattering cross-section (σs,tot) is
given by, σs,tot= Z π 0 2π sinθ dθ dσs dΩ = σ(say) (2.11)
Further, the differential scattering cross-section, dσ/dΩ from a single fixed scattering center due to incident beam of X-rays/neutrons moving with a velocity v (for X-ray, v = c) and flux φi can be calculated as below:
Considering the elastic scattering, the number of scattered X-rays/neutrons passing through an elemental area dS per second is,
v dS|Ψs|2 = v dS
b2
r2 = vb 2
dΩ (2.12)
The incident flux can be written as,
Φ = v|Ψi|2 = v (2.13)
Then, using Eq. 2.10,
dσ dΩ =
vb2dΩ
Φ dΩ = b
2 (2.14)
Again, using Eq. 2.11 and Eq. 2.14, and integrating all over the space,
σ = 4πb2 (2.15)
Depending upon the nature of the scattering centers, there can be a distribution of scattering cross-section. For X-rays, the scattering cross-section of elements are always coherent. On the other hand, neutrons are isotope sensitive due to the nuclear spin and thus there can be coherent and incoherent scattering cross-section for different elements. Therefore, the total scattering cross-section can be expressed as,
σ = σcoh+ σinc (2.16)