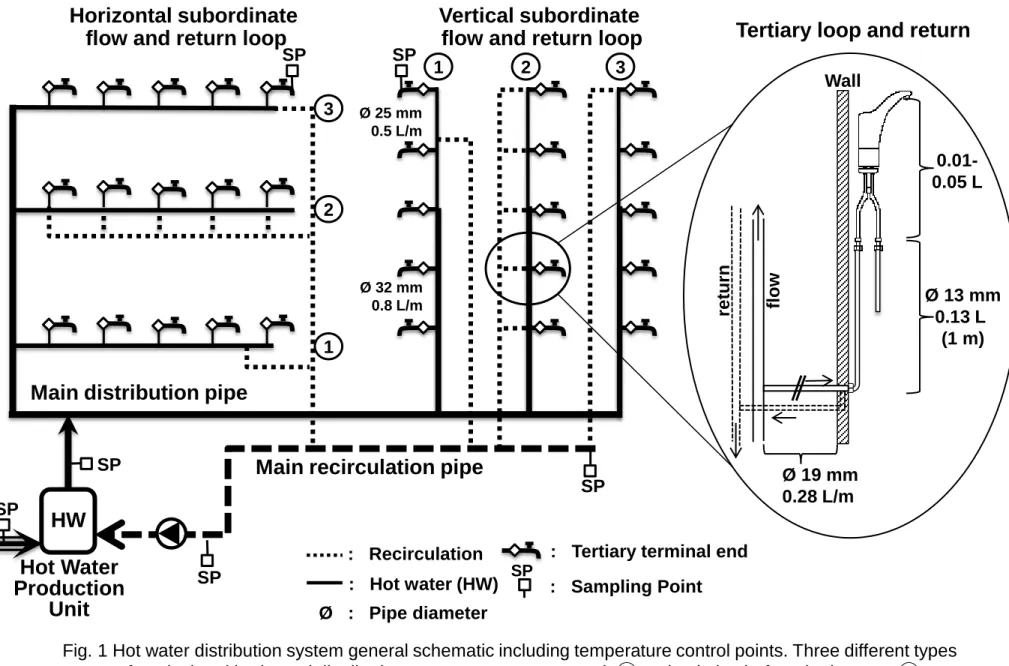
Fig. 1 Hot water distribution system general schematic including temperature control points. Three different types of vertical and horizontal distribution systems are represented: ① recirculation before the last tap; ② recirculation connected after each device; ③ recirculation connected after the last device.
Ø 19 mm 0.28 L/m Ø 32 mm 0.8 L/m Ø 25 mm 0.5 L/m
Main distribution pipe
Main recirculation pipe
HW
Ø 13 mm 0.13 L (1 m) 0.01- 0.05 LHot Water
Production
Unit
Horizontal subordinate
flow and return loop
Vertical subordinate
flow and return loop
3 2 1 1 2 3 SP SP SP SP SP SP SP : Sampling Point
.
Wall flow : Recirculation re tu rnTertiary loop and return
: Tertiary terminal end : Hot water (HW)
40
50
60
70
01/11/13 01/12/13 01/11/13 01/12/13 01/11/13 01/12/1330
40
50
60
70
02/09/13 02/10/13 02/11/13 02/12/13 04/13/14 04/14/1470
60
50
40
30
System no 1
System no 2
System no 3
System no 4
System no 5
Fig. 2 Examples of continuous temperature monitoring at water heater outlet for each studied system (black line) and at the return loop for system 4 and 5 (blue line). No continuous monitoring data was available for systems 1 to 3. Date format is MM/DD/YY.
T
emp
era
ture
(
°C)
70
60
50
40
Fig. 3 Heat loss during stagnation of hot water in 1.25 cm diameter copper pipes with and without insulation at room temperature.
0
10
20
30
40
50
60
70
0
50
100
150
200
T
e
mpe
ra
tu
re
(
C)
Elapsed time (minutes)
Type 1 insulation
Type 2 insulation
Non-insulated
Optimal growth temperature for Lp 45min 86min 131minFig. 4: Hot water temperature profiles at points-of-use as a function of volume for a) systems 1, 2 and 3 grouped, n = 7; b) system 4, n = 7; c) system 5, n = 36. Mean temperature at the hot water production unit outlet and at the return loop are shown for each system.
1 2 0 10 20 30 40 50 60 10 20 30 40 50 60 70 1 2 0 10 20 30 40 50 60 10 20 30 40 50 60 70 1 2 0 10 20 30 40 50 60 10 20 30 40 50 60 70
____ : Hot water outlet T° --- : Recirculation loop T° : 25 – 75% I : Non-outlier range Volume (L)
T
emp
er
atu
re
(
°C)
63.0°C 55.5°C 54.3°C 51.0°C 61.6°C 53.9°Ca
b
c
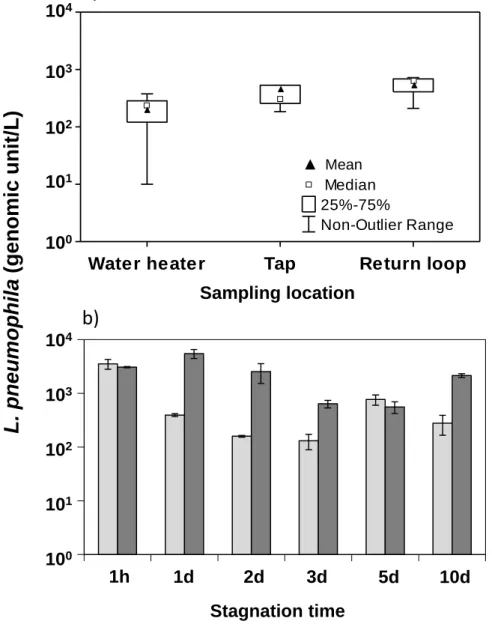
Fig. 5 Variability of L. pneumophila concentration measured by qPCR (a) in system 4, for repeat sampling events without prior stagnation (n = 5, Jan-Oct 2013) (b) in system 5, after different water stagnation times for tap A (light gray) and tap B (dark gray) (n = 2, Nov-Oct 2012).
a)
b)
L
.
p
n
eu
mo
p
h
il
a
(
g
en
o
mi
c
u
n
it/
L
)
101 102 103 104 100 1h 1d 2d 3d 5d 10d Sampling locationWater heater Tap Return loop
Median 25%-75% Non-Outlier Range 101 102 103 104 100 Stagnation time ▲ Mean
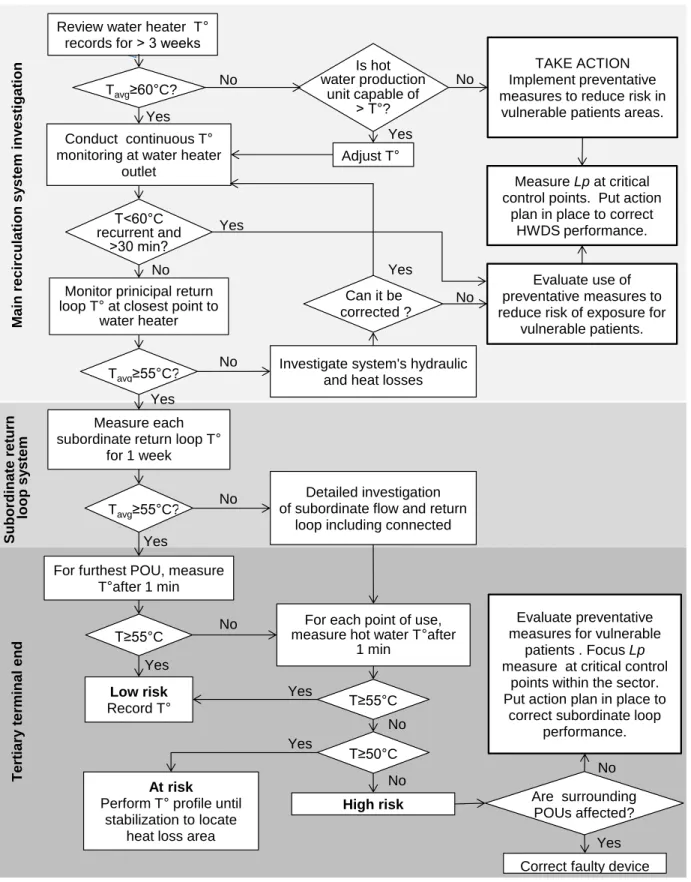
Fig. 6 Diagnostic flowchart for the initial assessment of Legionella risk in an existing HWDS Conduct continuous T°
monitoring at water heater outlet
Investigate system's hydraulic and heat losses
Adjust T°
For each point of use, measure hot water T°after
1 min Low risk Record T° Yes No Yes Yes No No Yes No Yes Yes No Yes Yes T Tavg≥60°C? T T˂60°C recurrent and ˃30 min? T Tavg≥55°C?
Monitor prinicipal return loop T° at closest point to
water heater
Measure each subordinate return loop T°
for 1 week T Tavg≥55°C? T T≥50°C At risk
Perform T° profile until stabilization to locate
heat loss area
High risk
Detailed investigation of subordinate flow and return
loop including connected Is hot water production unit capable of ˃ T°? Mai n re c irc ula ti on s y s te m inv e s ti gation S ubordina te re turn loop s y s te m Ter tia ry t e rmina l e nd No No TAKE ACTION Implement preventative measures to reduce risk in
vulnerable patients areas.
Evaluate use of preventative measures to reduce risk of exposure for
vulnerable patients.
Evaluate preventative measures for vulnerable
patients . Focus Lp measure at critical control
points within the sector. Put action plan in place to
correct subordinate loop performance. T Yes No Are surrounding POUs affected?
Correct faulty device Measure Lp at critical control points. Put action
plan in place to correct HWDS performance.
No Yes
For furthest POU, measure T°after 1 min T T≥55°C T T≥55°C Yes No Review water heater T°
records for ˃ 3 weeks
Can it be corrected ?