HAL Id: hal-00302663
https://hal.archives-ouvertes.fr/hal-00302663
Submitted on 19 Mar 2007HAL is a multi-disciplinary open access
archive for the deposit and dissemination of sci-entific research documents, whether they are pub-lished or not. The documents may come from teaching and research institutions in France or abroad, or from public or private research centers.
L’archive ouverte pluridisciplinaire HAL, est destinée au dépôt et à la diffusion de documents scientifiques de niveau recherche, publiés ou non, émanant des établissements d’enseignement et de recherche français ou étrangers, des laboratoires publics ou privés.
Elemental and organic carbon in PM10: a one year
measurement campaign within the European Monitoring
and Evaluation Programme EMEP
K. E. Yttri, W. Aas, A. Bjerke, D. Ceburnis, C. Dye, L. Emblico, M. C.
Facchini, C. Forster, J. E. Hanssen, H. C. Hansson, et al.
To cite this version:
K. E. Yttri, W. Aas, A. Bjerke, D. Ceburnis, C. Dye, et al.. Elemental and organic carbon in PM10: a one year measurement campaign within the European Monitoring and Evaluation Programme EMEP. Atmospheric Chemistry and Physics Discussions, European Geosciences Union, 2007, 7 (2), pp.3859-3899. �hal-00302663�
ACPD
7, 3859–3899, 2007 Elemental and organic carbon in PM10: a one year measurement K. E. Yttri et al. Title Page Abstract Introduction Conclusions References Tables Figures ◭ ◮ ◭ ◮ Back CloseFull Screen / Esc
Printer-friendly Version Interactive Discussion
Atmos. Chem. Phys. Discuss., 7, 3859–3899, 2007 www.atmos-chem-phys-discuss.net/7/3859/2007/ © Author(s) 2007. This work is licensed
under a Creative Commons License.
Atmospheric Chemistry and Physics Discussions
Elemental and organic carbon in PM
10
: a
one year measurement campaign within
the European Monitoring and Evaluation
Programme EMEP
K. E. Yttri1, W. Aas1, A. Bjerke1, D. Ceburnis2, C. Dye1, L. Emblico3,
M. C. Facchini3, C. Forster1, J. E. Hanssen1, H. C. Hansson4, S. G. Jennings2, W. Maenhaut5, J. P. Putaud6, and K. Tørseth1
1
Norwegian Institute for Air Research, P.O. Box 100,2027 Kjeller, Norway
2
Department of Experimental Physics, National University of Ireland, Galway, Ireland
3
CNR, Institute of Atmospheric Sciences and Climate, Via P. Gobetti 101 40129 Bologna, Italy
4
Department of Applied Environmental Science, Stockholm University, 10691, Stockholm, Sweden
5
Department of Analytical Chemistry, Institute for Nuclear Sciences, Ghent University, Proeftuinstraat 86, 9000 Ghent, Belgium
6
European Commission, Joint Research Centre, Institute for Environment and Sustainability, TP 460, Ispra (VA) 21020, Italy
Received: 8 February 2007 – Accepted: 5 March 2007 – Published: 19 March 2007 Correspondence to: K. E. Yttri (key@nilu.no)
ACPD
7, 3859–3899, 2007 Elemental and organic carbon in PM10: a one year measurement K. E. Yttri et al. Title Page Abstract Introduction Conclusions References Tables Figures ◭ ◮ ◭ ◮ Back CloseFull Screen / Esc
Printer-friendly Version Interactive Discussion Abstract
In the present study, ambient aerosol (PM10) concentrations of elemental carbon (EC),
organic carbon (OC), and total carbon (TC) are reported for 12 European rural back-ground sites and two urban backback-ground sites following a one-year (1 July 2002–1 July 2003) sampling campaign within the European Monitoring and Evaluation Programme,
5
EMEP (http://www.emep.int/). The purpose of the campaign was to assess the feasi-bility of performing EC and OC monitoring on a regular basis and to obtain an overview of the spatial and seasonal variability on a regional scale in Europe.
Analyses were performed using the thermal-optical transmission (TOT) instrument from Sunset Lab Inc., operating according to a NIOSH derived temperature program.
10
The annual mean mass concentration of EC ranged from 0.17±0.19 µg m−3 (mean
± SD) at Birkenes (Norway) to 1.83±1.32 µg m−3 at Ispra (Italy). The corresponding range for OC was 1.20±1.29 µg m−3 at Mace Head (Ireland) to 7.79±6.80 µg m−3 at Ispra. On average, annual concentrations of EC, OC, and TC were three times higher for rural background sites in Central, Eastern and Southern Europe compared to those
15
situated in the Northern and Western parts of Europe. Wintertime concentrations of EC and OC were higher than those recorded during summer for the majority of the sites. Moderate to high Pearson correlation coefficients (rp) (0.50–0.94) were observed for
EC versus OC for the sites investigated. The lowest correlation coefficients were noted for the three Scandinavian sites: Aspvreten (SE), Birkenes (NO), and Virolahti (FI), and
20
the Slovakian site Stara Lesna, and are suggested to reflect biogenic sources, wild and prescribed fires. This suggestion is supported by the fact that higher concentrations of OC are observed for summer compared to winter for these sites.
For the rural background sites, total carbonaceous material accounted for 30±9% of PM10, of which 27±9% could be attributed to organic matter (OM) and 3.4±1.0%
25
to elemental matter (EM). OM was found to be more abundant than SO2−4 for sites reporting both parameters.
ACPD
7, 3859–3899, 2007 Elemental and organic carbon in PM10: a one year measurement K. E. Yttri et al. Title Page Abstract Introduction Conclusions References Tables Figures ◭ ◮ ◭ ◮ Back CloseFull Screen / Esc
Printer-friendly Version Interactive Discussion 1 Introduction
The environmental relevance of the carbonaceous aerosol comprises a number of im-portant topics, such as direct and indirect climate forcing, and air quality. The high number of organic molecules reported to be associated with ambient fine aerosols have a wide range of different physical and chemical properties, of which impact on
5
human health and cloud formation largely remains unknown. Furthermore, black car-bon is the principal light absorbing species in the atmosphere, significantly affecting the Earth’s radiative balance (Ramanathan et al., 2001).
Quantification of the carbonaceous content of the ambient aerosol on the basis of single molecules is an insurmountable task due to their sheer number, their various
10
chemical and physical properties and the complex aerosol matrix. Thus, operational definitions of bulk carbonaceous material, such as elemental carbon (EC) and organic carbon (OC), have been established.
Long-term monitoring data of EC and OC is not yet available on a regional scale in Europe, although the importance of such data has been emphasized by e.g. Kahnert
15
et al. (2004). Monitoring of EC and OC needs to rely on both robust and cost-efficient techniques, but at the same time a satisfactory quality of the data must be maintained. This poses particular challenges due to artefacts associated with sampling of particu-late OC. It is well known that quartz fibre filters adsorb organic gases (Kirchstetter et al., 2001), and that a shift in the equilibrium between the filter, the organic constituents
20
collected on the filter, and gaseous organic compounds may lead to both positive and negative artefacts during prolonged sampling. Positive artefacts arise from adsorption of gaseous organic compounds on the filter, while negative artefacts result from evap-oration of gaseous organic material from particles collected on the filter. However, the exact magnitude of the artefacts is difficult to address or measure by simple methods.
25
Significant differences have been reported for levels of EC and OC when compar-ing various analytical techniques (Schmid et al., 2001). Whereas the total carbon (TC) content corresponds well between the most commonly used analytical approaches, the
ACPD
7, 3859–3899, 2007 Elemental and organic carbon in PM10: a one year measurement K. E. Yttri et al. Title Page Abstract Introduction Conclusions References Tables Figures ◭ ◮ ◭ ◮ Back CloseFull Screen / Esc
Printer-friendly Version Interactive Discussion
recommendation made by Schmid et al. (2001) is that only methods that account for charring during analysis should be applied when analysing for the sample content of EC and OC. Thus, methods such as optical reflectance (TOR) and thermal-optical transmittance (TOT) should be applied. Still, differences of a factor of two have been reported for EC when comparing the two most commonly applied analytical
pro-5
tocols, NIOSH (National Institute of Occupational Safety and Health) method 5040 and IMPROVE (Interagency Monitoring of Protected Visual Environments) (Schmid et al., 2001; Chow et al., 2001). Thus, in order to provide EC/OC data of high quality within a monitoring network, a standardized protocol needs to be established both for analysis and sampling of these carbonaceous fractions.
10
To assess the feasibility of performing EC and OC monitoring on a regular basis, and to obtain an overview of the spatial and seasonal variability of EC and OC on a regional scale in Europe, a one-year campaign was conducted at 12 rural background sites and two urban background sites in 13 European countries. The dataset benefits from the fact that one instrument, a thermal-optical transmission instrument, which
15
corrects for pyrolytically generated EC during analysis, has been used to quantify the sample content of EC and OC. It is our belief that the present dataset will contribute in a positive way to the understanding of concentrations of carbonaceous aerosols in the European rural background environment, and that it will be useful for the validation of the EMEP model performance, in particular. Below, we present a descriptive overview
20
of the campaign and the major findings obtained.
2 Experimental work
2.1 Aerosol sampling
The EMEP EC/OC campaign was conducted during the period 1 July 2002 to 1 July 2003. Table 1 provides an overview of the 14 sampling sites included in the
cam-25
paign and the sampling equipment used, whereas the spatial distribution of the sites 3862
ACPD
7, 3859–3899, 2007 Elemental and organic carbon in PM10: a one year measurement K. E. Yttri et al. Title Page Abstract Introduction Conclusions References Tables Figures ◭ ◮ ◭ ◮ Back CloseFull Screen / Esc
Printer-friendly Version Interactive Discussion
is shown in Fig. 1. 11 of the 14 sites are established EMEP sites, which fulfils the criteria of a regional background site stated by EMEP (http://www.nilu.no/projects/ccc/
manual/index.html). The Penicuick (UK) site is also a rural background site, but not an EMEP site, whereas Ghent (BE) and San Pietro Capofiume (S.P.C.) (IT) are both urban background sites. Aerosol sampling was performed using CEN (European Committee
5
for Standardization) approved or equivalent PM10gravimetric samplers, collecting one
24-h sample every week (starting Tuesday mornings 07:00 a.m.). Aerosols were col-lected on pre-heated (850◦C, 3.5 h) quartz fibre filters; 47-mm and 8 inch x 10 inch
quartz fibre filters were purchased from Whatman (QM-A), whereas 150-mm quartz fibre filters were purchased from Munktell (MK 360). To minimize differences in the
10
adsorptive capacity, filters were picked from the same batch number. The quartz fibre filters were conditioned at 20±1◦C and 50±5% RH (relative humidity) for 48 h before and after exposure and weighed for obtaining PM10 mass concentration. The 47-mm
filters were transported back and forth in petri slides, whereas the 8 inch x 10 inch and the 150-mm quartz fibre filters were enclosed in sealed aluminium foil. All quartz fibre
15
filters were stored at 4◦C before being analysed.
Field blanks were assigned to each fourth day of sampling, and treated in exactly the same manner regarding preparation, handling, transport and storage as the filters being exposed.
All filter preparations, pre-heating, conditioning and weighing, were performed at the
20
Norwegian Institute for Air Research (NILU) (EMEP – Chemical Coordinating Centre). 2.2 Thermal-optical transmission analysis
The samples (n=684) content of EC, OC, and TC, were quantified using the thermal-optical transmittance (TOT) instrument from Sunset laboratories Inc, operating accord-ing to a NIOSH derived temperature programme (Table 2). The “8785 Air Particulate
25
Matter On Filter Media” reference material from The National Institute of Standards and Technology (NIST) (Klouda et al., 2005) was used to test the performance of the temperature programme. The result is presented in Sect. 3.1.
ACPD
7, 3859–3899, 2007 Elemental and organic carbon in PM10: a one year measurement K. E. Yttri et al. Title Page Abstract Introduction Conclusions References Tables Figures ◭ ◮ ◭ ◮ Back CloseFull Screen / Esc
Printer-friendly Version Interactive Discussion
2.2.1 WSOC analysis
A total of 71 samples were subjected to WSOC (Water-soluble organic carbon) anal-ysis. Before analysis, parts of each filter were soaked in Milli-Q water (7 ml for low volume filters and 20 ml for high volume filters) and subjected to sonication (30 min) for extraction of the WSOC. The dissolved organic material was then quantified using a
5
Shimadzu TOC liquid analyzer (model TC5000A). The water-insoluble organic carbon (WINSOC) was quantified by subtracting WSOC from OC. The WSOC analysis was performed at the Institute of Atmospheric Sciences and Climate of the Italian National Research Council (ISAC-CNR).
3 Results and discussion
10
3.1 Uncertainties in EC/OC measurements
The precision and the detection limits of the TOT instrument were determined by the variability of the EC and OC concentrations on exposed filters and on filter blanks, re-spectively. The precision was found to be satisfactory with a relative standard deviation below 5%.
15
The level of EC on the field blanks was negligible, whereas the mean OC concen-tration ranged from 0.41 µg cm−2–1.94 µg cm−2 (Fig. 2). When converting µg cm−2
to µg m−3, the range for OC was 0.1–1.0 µg m−3; however, the concentration was <0.5 µg m−3for 13 of the 14 sites.
The relative contribution of OCfieldblank to OCmean ranged between 2–23% (Fig. 3).
20
These results show that the combination of relatively low ambient levels of particulate OC (Table 4) and a low filter face velocity (Table 1) (e.g., Penicuik) should be avoided, as this will contribute to increase the relative importance of the field blank (Fig. 3). Thus, we recommend using a sampler that operates at a high filter face velocity to minimize this problem. In addition, a high filter face velocity will also reduce the positive
25
ACPD
7, 3859–3899, 2007 Elemental and organic carbon in PM10: a one year measurement K. E. Yttri et al. Title Page Abstract Introduction Conclusions References Tables Figures ◭ ◮ ◭ ◮ Back CloseFull Screen / Esc
Printer-friendly Version Interactive Discussion
artefact, which when not accounted for will overestimate the level of particulate OC. Further, comparing levels of OC obtained by samplers operating at a wide range of filter face velocities, which is the case in the present study (filter face velocity ranging from 23–54 cm s−1) (Table 1), should be performed with caution, as the positive sampling artefact of OC becomes less significant as the filter face velocity increases (McDow
5
and Huntzicker, 1990; Turpin et al., 1994).
The mean concentrations of the field blanks were not accounted for when calculating the ambient aerosol concentrations of OC (Tables 4–6). The motivation for not doing so is that the field blank OC level could be reduced by as much as a factor of two when inserted into the sampler and letting particulate free air flow through. As the field blanks
10
were not inserted into the sampler, they only partly reflect the true contamination level experienced.
The two major factors affecting the uncertainty of EC and OC measurements are the sampling artefacts related to OC, and the analytical challenge of separating EC from OC. An EC/TC ratio of 22.7±2.1% (Mean ±2 SD) (n=3) was found for the NIOSH
15
derived temperature program used (Table 2) when analysing the “8785 Air Particulate Matter On Filter Media” reference material from NIST. This is only slightly lower than the certified value for NIOSH STN (27.9±2.3%) (Mean ±2 SD), and approximately a factor of two lower than the certified value for IMPROVE (49±5%) (Mean ±2 SD) (Klouda et al., 2005). The sampling artefacts of OC were not estimated in the present
20
study. In fact, only a few studies are published that address the magnitude of the sampling artefacts caused by OC in Europe. These studies have typically estimated the positive artefacts, and mainly in urban areas. It is generally assumed that the positive sampling artifacts prevail in collection with quartz fibre filters (Turpin et al., 2000). In most cases the positive artefact has been estimated according to the simple quartz
25
fibre filter-behind-quartz fibre filter (QBQ) tandem filter approach, placing two quartz fibre filters in series and subtracting OC on the backup filter from that of the front filter (e.g., McDow and Huntzicker, 1990). It can be seen from Table 3 that the positive artefact of OC experienced at four urban sites situated in Central, Southern, Western
ACPD
7, 3859–3899, 2007 Elemental and organic carbon in PM10: a one year measurement K. E. Yttri et al. Title Page Abstract Introduction Conclusions References Tables Figures ◭ ◮ ◭ ◮ Back CloseFull Screen / Esc
Printer-friendly Version Interactive Discussion
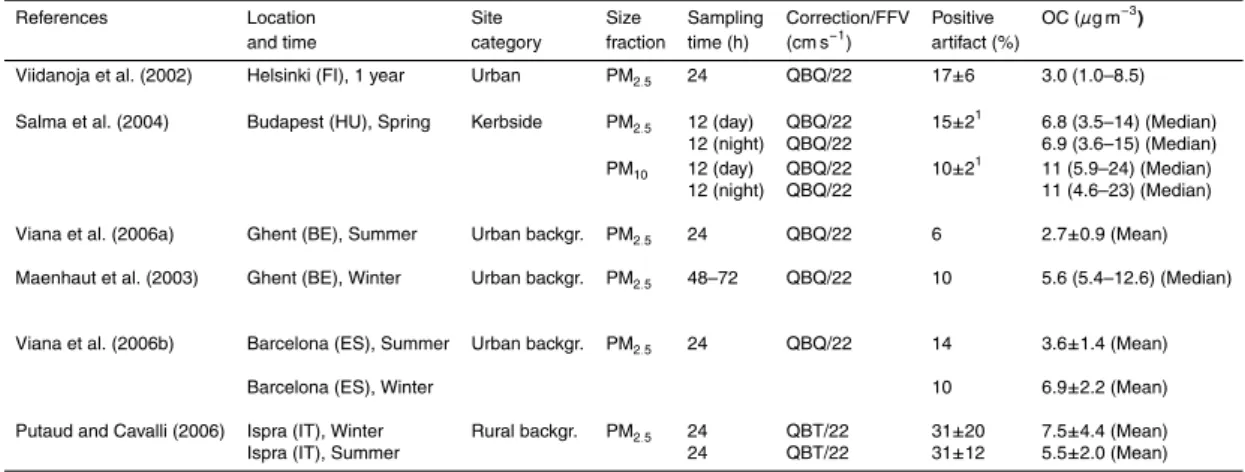
and Northern Europe, as estimated by the QBQ approach at a filter face velocity of 22 cm s−1, is actually quite similar for the four sites and rather low, ranging from 6– 17%. The somewhat higher estimate of the positive artefact for the rural background site Ispra compared to the urban sites is most likely attributed to the fact that the Quartz fibre filter-behind-Teflon filter (QBT) approach was used rather than the QBQ approach.
5
Since the majority of the OC concentrations from the EMEP campaign (Table 4) are in the lower range of those listed in Table 3, the positive artefact is likely to be more severe. Indeed, Putaud and Cavalli (2006) reported that the positive artefact was most severe for samples with a low OC loading.
Performing daily sampling throughout an entire year, Viidanoja et al. (2002) found
10
that the positive artefact of OC was slightly higher in summer compared to winter. The study of Viana et al. (2006b) supports this seasonal variation, which also is in line with observations made in urban environments in the U.S. (Subraminian et al., 2004). It could be argued that this seasonal variation is attributed to lower levels of particulate OC in summer compared to winter, which is the case in the study by Viana
15
et al. (2006b), or it could be that lower ambient air concentrations of VOC in winter fail to fully saturate the back-up filter, hence underestimating the positive artefact.
3.2 Elemental carbon
The annual mean concentration of EC varied considerably from 0.17±0.19 µg m−3 (Mean ± SD) at Birkenes (NO) to 1.83±1.32 µg m−3 at Ispra (IT) (Table 4). The
low-20
est concentrations were observed at the sites in Scandinavia and at the British Isles, ranging from 0.17–0.51 µg m−3, whereas the highest concentrations were noted for the sites in Central, Eastern and Southern parts of Europe (Fig. 1, Table 4). On an annual basis the concentrations of EC were three times higher for the rural background sites situated in continental Europe compared to those in Scandinavia and in western
Eu-25
rope (UK and Ireland). This pronounced North-to-South gradient suggest that the rural background sites in Central Europe are more influenced by urban areas than those at the outskirts of Europe.
ACPD
7, 3859–3899, 2007 Elemental and organic carbon in PM10: a one year measurement K. E. Yttri et al. Title Page Abstract Introduction Conclusions References Tables Figures ◭ ◮ ◭ ◮ Back CloseFull Screen / Esc
Printer-friendly Version Interactive Discussion
The EC levels reported for the two urban background sites, Ghent (BE) and S.P.C. (IT), are lower than that of the rural background site Ispra, hence the wide con-centration range observed for EC is not due to the urban background sites. It should be noted though that the EC concentration observed at Ispra is considerably higher than for the other rural background sites listed in Table 4, which most likely is due to the
5
impact of regional air pollution from the nearby and strongly polluted Po Valley area. The annual mean EC concentration (0.66±0.39 µg m−3) found for the 12 rural back-ground sites listed in Table 4, is substantially higher than what has been reported for EC (0.21±0.12 µg m−3) (n=143) in PM2.5at rural background sites in the United States
by the Interagency Monitoring of Protected Visual Environments (IMPROVE) network
10
for 2001 (Malm et al., 2004). As stated in Sect. 3.1, the NIOSH derived temperature programme used in the present study provides EC concentrations that are approxi-mately half of what is obtained by the IMPROVE protocol, as found from investigations on a U.S. aerosol.
Wintertime (October–March) concentrations of EC were higher than those recorded
15
during summer (April–September) for all sites (Tables 5 and 6), ranging from 1.1– 1.5 times higher for the sites Aspvreten (SE), Birkenes (NO), Ghent (BE), Illmitz (AT), Koˇsetice (CZ), Mace Head (IE), and Virolahti (FI), and from 1.5–1.9 times higher for Braganza (PT), Penicuick (UK), S.P.C. (IT) and Stara Lesna (SK). For Ispra (IT), Kol-lumerward (NL) and Langenbr ¨ugge (DE), the wintertime increase of EC was
substan-20
tial, being a factor 2.2–2.6 times higher compared to summer. The increased levels of EC observed during winter may be explained by increased emissions from residential heating (coal, oil and wood) and traffic (cold starts), but also by more frequent events of temperature inversion, leading to poorer dispersion of the pollutants emitted.
3.3 Organic carbon
25
The annual mean concentration of OC ranged from 1.20±1.29 µg m−3(Mean ± SD) at Mace Head (IE) to 7.79±6.80 µg m−3 at Ispra (IT) (Table 4). The spatial distribution of
OC closely resembles that of EC, with the highest concentrations reported for the sites 3867
ACPD
7, 3859–3899, 2007 Elemental and organic carbon in PM10: a one year measurement K. E. Yttri et al. Title Page Abstract Introduction Conclusions References Tables Figures ◭ ◮ ◭ ◮ Back CloseFull Screen / Esc
Printer-friendly Version Interactive Discussion
in Central, Eastern and Southern Europe, and the lowest in Scandinavia, the UK and the Republic of Ireland, ranging from 1.20–2.12 µg m−3(Fig. 1, Table 4). On an annual basis, OC concentrations were three times higher for the rural background sites in continental Europe compared to sites in Scandinavia and at the British Isles. As for EC, the highest annual mean concentration of OC was observed for the rural background
5
site Ispra (IT), and not for either of the two urban background sites participating in the campaign. In fact, the six southernmost rural background sites reported higher, or equally high, concentrations of OC than the urban background site Ghent (BE), hence they contribute considerably to the observed North-to-South gradient. Five of these six sites are situated in the densely populated Central Europe, and thus elevated
10
concentrations could be expected. For the sites Braganza (PT), Ghent (BE), Koˇsetice (CZ), Langenbr ¨ugge (DE), and Stara Lesna (SK), the annual mean concentration of OC was quite consistent, ranging from 4.10–4.58 µg m−3. This finding was not observed for EC for the same sites. It should be emphasized that the Ghent site is an urban background site, while the others are rural background sites.
15
The majority of the sites investigated in the campaign experienced higher concen-trations of OC during winter compared to summer, ranging from 1.2–2.8 times higher (Tables 5 and 6). The two urban background sites both experienced higher concen-tration during winter, while this was observed for eight out of the twelve rural back-ground sites. This can most likely be explained by increased emissions from
residen-20
tial heating (coal, oil and wood) and traffic during winter (cold starts), as for EC, and by more frequent occurrences of temperature inversions, trapping local emissions of par-ticulate OC. Hence, 24-h maximum concentrations of OC exceeding 30 µg m−3 were
observed during winter only, at the sites Braganza (PT) (30.5 µg m−3) and Ispra (IT) (36.3 µg m−3). In the study by Malm et al. (2004), addressing the level of OC in PM2.5
25
at 143 rural and four urban sites within the IMPROVE network in the United States for 2001, only the urban sites reported higher concentrations of OC during winter com-pared to summer. This indicates greater impact from urban areas at rural background sites in Europe compared to the USA, either as a result of a higher pollution level in
ACPD
7, 3859–3899, 2007 Elemental and organic carbon in PM10: a one year measurement K. E. Yttri et al. Title Page Abstract Introduction Conclusions References Tables Figures ◭ ◮ ◭ ◮ Back CloseFull Screen / Esc
Printer-friendly Version Interactive Discussion
general, and/or due to a denser and more uniformly distributed population pattern. At the three Scandinavian sites, Aspvreten (SE), Birkenes (NO), and Virolahthi (FI), the summertime (April-September) concentrations of OC were 1.5 times higher than those recorded in winter, whereas the summertime concentration of OC at Stara Lesna (SK) was 1.3 times higher (Tables 5 and 6). The highest concentrations of OC for these
5
sites, exceeding the annual mean concentration by a factor of 4–6, occurred within a short period of time at the end of August and the beginning of September 2002 (Fig. 4). Characteristic for the samples collected during this period were low EC/TC ratios (<10%) and elevated concentrations of levoglucosan (34–108 ng m−3), which is a source-specific tracer of particulate matter emissions from biomass burning (Simoneit
10
et al., 1999). The source region of this biomass-burning plume was western parts of Russia, Belarus, Ukraine, and the Baltic States, evidenced from backward simulations of the air masses using the FLEXPART model (Stohl et al., 2005) (Fig. 5), along with satellite images (Fig. 6). Thus, prescribed and wild fires may have a significant impact on European OC and PM levels, although the sources are located more than 1000 km
15
away.
When excluding the samples affected by the biomass plume, the mean summertime concentrations of OC at the Scandinavian sites are still 1.3 times higher in summer compared to winter, whereas at the Slovakian site the mean summertime concentra-tion equals that recorded in winter. Possible explanaconcentra-tions for this seasonal variaconcentra-tion
20
may be biogenic secondary organic aerosols (BSOA) and primary biological aerosol particles (PBAP) contributing to the OC fraction in summer, along with a low impact from anthropogenic OC.
3.3.1 Coarse organic carbon at the Norwegian site Birkenes
At one of the Scandinavian sites, Birkenes, weekly measurements of EC and OC in
25
PM10 and PM2.5 have been undertaken since 2002, using the same analytical
instru-ment, temperature programme, and type of sampler as in the EMEP EC/OC campaign. In Fig. 7, the average seasonal variation for OC in PM10, PM10−2.5 and PM2.5 is
ACPD
7, 3859–3899, 2007 Elemental and organic carbon in PM10: a one year measurement K. E. Yttri et al. Title Page Abstract Introduction Conclusions References Tables Figures ◭ ◮ ◭ ◮ Back CloseFull Screen / Esc
Printer-friendly Version Interactive Discussion
sented for the period 2002–2005, showing annual regularity of a PM10 summertime
peak of OC. By using identical samplers for the collection of PM10and PM2.5, it can be argued that the absolute concentration of the positive artefact is identical for the two size fractions; hence the concentration of coarse OC, obtained by subtracting OCPM2.5
from OCPM10, should not be confounded by positive artefacts. Fine OC is the
domi-5
nant fraction throughout the entire year for the actual period (2002–2005), peaking in spring (April). After its springtime peak, the concentration declines throughout the year. Coarse OC has a seasonal variation closely resembling the vegetative season (Figs. 7 and 8). It is observed that coarse OC is almost absent during the period when snow is covering the ground (November–April), and that the concentration starts to increase
10
soon after the snow has melted in April. The highest concentration is observed from July–October, during which coarse OC occasionally may account for the majority of OC in PM10, even on a monthly basis (Fig. 8). In our opinion, these observations clearly
point towards the importance of suspension of coarse OC from the ground. We state that the summertime increase of OC in PM10at Birkenes is due to the coarse fraction,
15
but that this remains to be confirmed for the two other Scandinavian sites.
Coarse OC has typically been associated with primary biological aerosol particles (PBAP) (Matthias-Maser, 1998), which usually have a natural origin. At Birkenes it has been shown that the aerosol content of sugars and sugar alcohols, which are tracers for certain PBAP (Graham et al., 2003), has the same seasonal variation as coarse OC
20
(Yttri et al., 20071), which corroborates the fact that the coarse OC at this site could be attributed to PBAP. Interestingly, the annual mean concentration of coarse OC has increased by 32% from 2002 (0.22 µg m−3) to 2005 (0.28 µg m−3). This corresponds to
an increase in the relative contribution of OCPM10−2.5 to OCPM10 from 19% to 29% on
an annual basis (Fig. 8). It is likely that the relative contribution is even higher, as OC
25
in PM10 might be subject to positive artefacts, while this is not the case for coarse OC.
1
Yttri, K. E., Dye, C., and Kiss, G.: Ambient aerosol concentrations of sugars and sugar-alcohols at five different sites in Norway, Atmos. Chem. Phys. Discuss., to be submitted, 2007.
ACPD
7, 3859–3899, 2007 Elemental and organic carbon in PM10: a one year measurement K. E. Yttri et al. Title Page Abstract Introduction Conclusions References Tables Figures ◭ ◮ ◭ ◮ Back CloseFull Screen / Esc
Printer-friendly Version Interactive Discussion
Results indicating that close to 30% of OC in PM10 might be attributed to coarse PBAP should be investigated further. Of particular interest is to explore whether similar results as those reported for Birkenes could be found at the other Scandinavian EMEP sites, and to what extent the observed annual increase in coarse OC at Birkenes could be attributed to climatic changes or is within the natural variation. Finally, the results
5
obtained from Birkenes underline the importance of monitoring OC in both PM10 and
PM2.5with respect to elucidating sources of particulate OC. 3.4 Total carbon
The aerosol content of TC is not subject to uncertainties related to the split between EC and OC. Hence, it is a more robust parameter and can be used to confirm some
10
of the findings deduced from the EC and OC data. As for OC and EC, we find that the concentrations of TC are three times higher on average for rural background sites situated in continental Europe compared to the sites in Scandinavia and in Western Europe (UK and Ireland) (Table 4). Also the elevated concentrations of OC reported for the Scandinavian sites Aspvreten (SE), Birkenes (NO) and Virolahti (FI) in summer
15
compared to winter is mirrored for TC (Tables 5 and 6). 3.5 Correlation between EC and OC
The sites investigated exhibited moderate to high Pearson correlation coefficients (rp)
for EC versus OC, ranging from 0.50 at Stara Lesna (SK) to 0.94 at Braganza (PT) (Table 7). For 12 of the 14 sites, rp was higher than 0.72, indicating that these
car-20
bonaceous sub-fractions have common sources and/or are affected by the same atmo-spheric processes. Four of the five lowest correlation coefficients, i.e. 0.50<rp<0.77,
were obtained for the three Scandinavian sites and the Slovakian site, which are those sites experiencing higher concentrations of OC during summer compared to winter (Ta-ble 5 and 6). Using a two-sided t-test, the mean Pearson correlation coefficient for EC
25
vs. OC for group 1 (OCwinter>OCsummer) (rp=0.84) was significantly higher than that for
ACPD
7, 3859–3899, 2007 Elemental and organic carbon in PM10: a one year measurement K. E. Yttri et al. Title Page Abstract Introduction Conclusions References Tables Figures ◭ ◮ ◭ ◮ Back CloseFull Screen / Esc
Printer-friendly Version Interactive Discussion
group 2 (OCwinter <OCsummer) (rp=0.67) at p=0.05. Thus, we suggest that this finding could be attributed to biogenic sources and wild and prescribed fires influencing the group 2 sites during summer.
3.6 EC/TC-ratios
The annual mean EC/TC ratio varied from 12±5% at Birkenes (NO) to 31±6% in Ghent
5
(BE), reflecting the relative impact of sources high in EC (Table 4). With the exception of Penicuik, the annual mean EC/TC ratio for the rural background sites varied within a rather narrow range (12±5% to 20±3%) (Table 4). The lowest EC/TC ratios (< or equal to 14%) were observed for sites in Scandinavia (Aspvreten, SE; Birkenes, NO) and in western Europe (Mace Head, IE), which receive the majority of their aerosol
load-10
ing from aged air masses as a result of long-range transport (Pakkanen et al., 1996; Forster et al., 2001). Aging of air masses tends to lower the EC/TC ratio of the aerosol due to oxidation and condensation of organic material (Burtscher et al., 1993). Low EC/TC ratios could also follow from the positive artefact of OC, which could be more pronounced in areas experiencing low levels of particulate OC. Quite a large difference
15
was observed when comparing the EC/TC ratio for the two urban background sites; while the EC/TC ratio for Ghent exceeded 30%, it was only 20±4% for S.P.C., which is in the upper range of that reported for the rural background sites. At Aspvreten (SE), Birkenes (NO) and Mace Head (IE), the low EC/TC ratios reflect the low an-nual mean concentrations of EC, whereas the urban background sites Ghent (BE) and
20
S.P.C. (IT) experience high annual levels of EC and correspondingly high EC/TC ratios. For Penicuik (GB), rather low levels of EC are obtained. Still, the second highest EC/TC ratio (24±8%) is observed for this site. The rather high Pearson correlation coefficient (rp=0.80) obtained when correlating EC and NOx at Penicuik, suggests that the high EC/TC ratio could be attributed to vehicular emissions from nearby urban areas.
25
Apart from the sites Ghent (BE) and Braganza (PT), EC accounted for a larger frac-tion of TC during winter than during summer. For the three Scandinavian sites, Lan-genbr ¨ugge (DE) and Stara Lesna (SK), the EC/TC ratio increased by a factor 1.5–1.8
ACPD
7, 3859–3899, 2007 Elemental and organic carbon in PM10: a one year measurement K. E. Yttri et al. Title Page Abstract Introduction Conclusions References Tables Figures ◭ ◮ ◭ ◮ Back CloseFull Screen / Esc
Printer-friendly Version Interactive Discussion
from summer to winter. This can partly be explained by the general increase in concen-tration of EC in winter (see Sect. 3.2), but also the wintertime reduction in OC reported for the Scandinavian sites and Stara Lesna (SK) contributes to the higher EC/TC ratio in winter. For the remaining sites, the EC/TC-ratio increased by a factor 1–1.3 from summer to winter. For these sites, both the concentration of EC and OC was higher
5
during winter than during summer. The lower wintertime EC/TC-ratios seen for Ghent (BE) compared to summer could possibly be attributed to wood burning for residential heating, as emissions from wood burning typically have a low EC/TC ratio. Indeed, Ghent has a documented record of high levels of levoglucosan during winter (Pashyn-ska et al., 2002; Zdrah ´al et al., 2002).
10
3.7 Contribution of carbonaceous material to PM10
The annual mean concentration of PM10 ranged from 8.1 µg m−3 at Birkenes (NO) to
41 µg m−3at Ispra (IT) and at S.P.C. (IT) (Table 8). Typically, the highest concentrations were obtained at the most urban influenced sites; S.P.C. (41 µg m−3), Ispra (41 µg m−3),
and Ghent (37 µg m−3). At the two Italian sites, PM10 exceeded the annual limit value
15
(40 µg m−3) to be met by 2005, set by the EU. The lowest concentrations were observed for the sites in Scandinavia and in the UK, all less or equal to 15 µg m−3. Wintertime
concentrations of PM10 were higher than summertime concentrations at all sites
in-vestigated, except from the Scandinavian sites Aspvreten (SE), Birkenes (NO), and Virolahti (FI), and the Slovakian site Stara Lesna (SK).
20
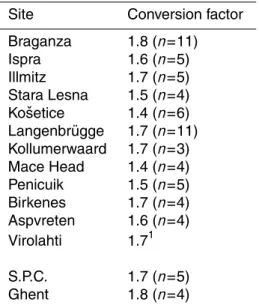
Conversion of OC to OM (Organic matter) is recognized as one of the most critical factors of uncertainty in mass closure calculations. A factor of 1.4 has commonly been applied for this purpose both in urban and rural areas (Gray et al., 1986; Malm et al., 2004, Putaud et al., 2004; Sillanp ¨a et al., 2005). However, using one factor for all sites is likely to introduce uncertainties, as the source contribution varies from site to site
25
and also by season. Reviewing conversion factors reported in the literature, Turpin and Lim (2001) concluded that 1.6±0.2 was a better estimate for urban areas, whereas
ACPD
7, 3859–3899, 2007 Elemental and organic carbon in PM10: a one year measurement K. E. Yttri et al. Title Page Abstract Introduction Conclusions References Tables Figures ◭ ◮ ◭ ◮ Back CloseFull Screen / Esc
Printer-friendly Version Interactive Discussion
1.9–2.3 were suggested for aged aerosols, and 2.2–2.6 for aerosols originating from biomass burning. The estimate for aged aerosol is supported by the experimentally derived conversion factor for the rural background site K-puszta in Hungary, ranging from 1.9–2.0 (Kiss et al., 2002). Unfortunately, there are only a very few experimentally derived conversion factors reported.
5
OC is commonly segregated according to its solubility in water. While the water-soluble fraction (WSOC) contains molecules that have a high molecular weight pr. car-bon weigh (1.5–3.8), the corresponding range for the water-insoluble fraction is much lower (1.1–2.1) (Turpin and Lim, 2001). By segregating between WSOC and WINSOC, and by using conversion factors for each of these sub-fractions, more accurate
esti-10
mates of OM may be obtained. However, the lack of experimentally derived conversion factors for WSOC and WINSOC for the individual sites could still bias the results. In the present study, conversion factors for OC accounting for the relative contribution of WSOC and WINSOC at the individual sites are applied, ranging from 1.4–1.8 (Table 9). A factor of 2.1 has been applied to convert WSOC into WSOM (Water-soluble organic
15
matter) (Kiss et al., 2002) and a factor 1.3 to convert WINSOC to WINSOM (Water-insoluble organic matter). A conversion factor of 1.1 was used to convert EC to EM (Elemental matter) (Kiss et al., 2002).
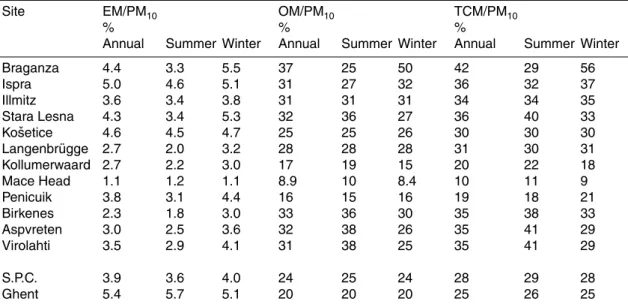
On an annual basis the total carbonaceous material, TCM (TCM = EM + OM), ranged from 10% of PM10 at Mace Head (IE) to 42% at Braganza (PT) (Table 10).
20
Addressing the rural background sites in particular, 30±9% of PM10could be attributed
to TCM, emphasizing the importance of the carbonaceous fraction for this site category. For three of these sites (Aspvreten (SE), Stara Lesna (SK), Virolahti (FI)), more than 40% of PM10 could be attributed to carbonaceous material during summer, whereas
TCM accounted for 56% of PM10during winter at the Portuguese site Braganza.
25
EM accounted for 1.1–5.4% of PM10 on an annual basis (Table 10). The highest annual contribution of EM to PM10 was obtained for the urban background site Ghent
(BE) (5.4%), being considerably higher compared to the second urban background site, S.P.C. (3.9%). For the rural background sites, EM accounted for 3.4±1.1% of PM10 on
ACPD
7, 3859–3899, 2007 Elemental and organic carbon in PM10: a one year measurement K. E. Yttri et al. Title Page Abstract Introduction Conclusions References Tables Figures ◭ ◮ ◭ ◮ Back CloseFull Screen / Esc
Printer-friendly Version Interactive Discussion
an annual basis. Within this site category, by far the highest fraction of EM to PM10was
observed for the Italian site Ispra (5%), underlining the magnitude of the regional air pollution in Northern Italy. Also for the three sites Braganza (PT), Koˇsetice (CZ), and Stara Lesna (SK), the relative contribution of EM was somewhat elevated compared to the other rural backgrounds sites, accounting for more than 4.3% of PM10.
5
EM was typically a more dominant constituent of PM10 during winter compared to
summer. Addressing the rural background sites only, EM accounted for 2.9±1.0% of PM10 during summer compared to 3.9±1.3% in winter. The increase in EM to PM10
from summer to winter was most pronounced for the sites Braganza (PT) (3.3% during summer compared to 5.5% during winter) and Langenbr ¨ugge (DE) (2.0 % during
sum-10
mer and 3.2% during winter). Ghent (BE) and Mace Head (IE) were the only two sites where the relative contribution of EM to PM10was higher during summer compared to
winter. This is explained by lower concentrations of PM10 in summer, which at Mace
Head is caused by lower contribution of sea salt aerosols to PM10 due to significantly lower wind speed during summer compared to winter. The 5.7% contribution of EM
15
to PM10 reported for Ghent during summer was the highest contribution noted for the
entire campaign.
The annual mean contribution of OM to PM10 ranged from 8.9% at Mace Head (IE)
to 37% at Braganza (PT) (Table 10). For the rural background sites, 27±9% on av-erage could be attributed to OM, whereas for the two urban background sites, Ghent
20
(BE) and S.P.C. (IT), the percentages were 20% and 24%, respectively. Unlike EM, the majority of the sites did not experience an increased contribution of OM to PM10 during
winter (26±10%) compared to summer (28±9%). An exception was the Portuguese site Braganza, where OM accounted for 50% of PM10 during winter, experiencing a
factor-of-two increase from summer to winter. For the three Scandinavian sites
As-25
pvreten (SE), Birkenes (NO) and Virolahti (FIN), and the Slovakian site Stara Lesna, the contribution of OM to PM10 was much higher in summer (36–38%) compared to
winter (25–30%).
Based on analysis of the RM 8785 (see Sect. 3.1), estimates can be made of the EC 3875
ACPD
7, 3859–3899, 2007 Elemental and organic carbon in PM10: a one year measurement K. E. Yttri et al. Title Page Abstract Introduction Conclusions References Tables Figures ◭ ◮ ◭ ◮ Back CloseFull Screen / Esc
Printer-friendly Version Interactive Discussion
and OC concentrations that would have been obtained if we had applied the IMPROVE protocol for analysis. Performing such an exercise does not change our statement regarding TCM as a major contributor to PM10at rural background sites in Europe. On
average, we calculated that TCM would have accounted for 29±9% of PM10 on the
annual average if we had used the IMPROVE protocol, which is a reduction of only 1%
5
compared to the NIOSH derived temperature programme. For the site experiencing the largest reduction, the contribution of TCM to PM10was reduced by no more than 3%. A major change is observed for EC, which is increased by a factor of 2.1, corresponding to a contribution of EM to PM10 of 7.2±2.3%. The increase in EM to PM10 following
from these calculations is accompanied by a 2–8% decrease in the contribution of OM
10
to PM10. Thus, our calculations show that OM would have accounted for 21±8% of PM10 if we had applied the IMPROVE protocol.
Putaud et al. (2004) stated that OM was the major fraction of PM10 and PM2.5 at a
number of different European sites investigated during the period 1991–2001, except at natural and rural background sites, where the SO2−4 contribution was expected to be
15
larger. In the present study, OM was 1.4–2.5 times higher than SO2−4 at five (Birkenes (NO), Illmitz (AT), Kollumerwaard (NL), Stara Lesna (SK), Virolahti (FI)) of the six rural background sites reporting concurrent concentrations of sulphate (Hjellbrekke, 2004; Hjellbrekke, 2005). For these five sites, OM was higher than SO2−4 by a factor 1.1–2.0 when using a conversion factor of 1.4 for OC, as in the study by Putaud et al. (2004).
20
Mace Head was the only rural background site reporting higher concentrations of SO2−4 than OM. However, when not accounting for the substantial concentration of ss SO2−4 , which accounts for 34% of the total SO2−4 at this site, OM is found to be higher than SO2−4 by a factor of 1.3. We also find that the estimated concentrations of OM likely to be obtained by using the IMPROVE protocol for analysis are higher than the
concen-25
trations of SO2−4 at the five sites listed above. It is likely that this shift can be attributed to the reduced emissions of SO2in Europe during the last decade. Thus, at present, OM seems to be the major fraction of the ambient PM10aerosol even at European
ACPD
7, 3859–3899, 2007 Elemental and organic carbon in PM10: a one year measurement K. E. Yttri et al. Title Page Abstract Introduction Conclusions References Tables Figures ◭ ◮ ◭ ◮ Back CloseFull Screen / Esc
Printer-friendly Version Interactive Discussion
ral background sites. Possible exceptions are likely to be coastal sites, such as Mace Head, where sea salt mass dominates, and sites in southern Europe that are severely influenced by Saharan dust episodes.
4 Conclusions
The present study demonstrates that total carbonaceous material (TCM) is a major
5
fraction of the ambient aerosol at European rural background sites, accounting for 30±9% of PM10. 27±9% was organic matter, whereas 3.4±1.1% was elemental
mat-ter. These results emphasize the importance of EC and OC monitoring on a regional scale in Europe. Our calculations show that if the IMPROVE procedure had been used for analysis, the relative contribution of TCM would have remained unchanged, even
10
though EM doubles and OM is reduced by approximately 20%. Still OM concentrations are larger than the sulphate concentrations.
Concentrations of EC, OC, and TC were on average three times higher for rural background sites in continental Europe compared to those situated in Scandinavia and in western Europe, probably reflecting a higher impact of anthropogenic sources in the
15
more densely populated continental Europe.
Wintertime concentrations of EC and OC were higher than those recorded during summer for the majority of the sites, most likely reflecting higher energy consumption and unfavourable meteorological conditions in winter. The higher concentrations of OC observed during summer compared to winter at the three Scandinavian sites Aspvreten
20
(SE), Birkenes (NO), and Virolahti (FI), and at the Slovakian site Stara Lesna, were attributed to the influence of biogenic sources, wild and prescribed fires. We suggest that the importance of these sources should be subject to further investigation, as they seem to be of importance on the regional scale.
ACPD
7, 3859–3899, 2007 Elemental and organic carbon in PM10: a one year measurement K. E. Yttri et al. Title Page Abstract Introduction Conclusions References Tables Figures ◭ ◮ ◭ ◮ Back CloseFull Screen / Esc
Printer-friendly Version Interactive Discussion References
Burtscher, H., Leonardi, A., Steiner, D., Baltensperger, U., and Weber, A.: Aging of combustion particles in the atmosphere – Results from a field-study in Z ¨urich, Water, Air, Soil Pollut., 68, 137–147, 1993.
Chow, J. C., Watson, J. G., Crow, D., Lowenthal, D. H., and Merrifield, T.: Comparison of
5
IMPROVE and NIOSH carbon measurements, Aerosol Sci. Technol., 34, 23–34, 2001. Forster, C., Wandinger, U., Wotawa, G., James, P., Mathis, I., Althausen, D., Simmonds, P.,
O’Doherty, S., Jennings, S.G., Kleefeld, C., Schneider, J., Triekl, T., Kreipl, S., Jaeger, H., and Stohl, A.: Transport of boreal forest fire emissions from Canada to Europe, J. Geophys. Res., 106, 22 887–22 906, 2001.
10
Graham, B., Guyon, P., Taylor, P. E., Artaxo, P., Maenhaut, W., Glovsky, M. M., Flagan, R. C., and Andreae, M. O.: Organic compounds present in the natural Amazonian aerosol: Characterization by gas chromatography-mass spectrometry, J. Geophys. Res., 108(D24), 4766, doi:10.1029/2003JD003990, 2003.
Gray, H. A., Cass, G. R., Huntzicker, J. J., Heyerdahl, E. K., and Rau, J. A.: Characterization of
15
atmospheric organic and elemental carbon particles concentrations in Los-Angeles, Environ. Sci. Technol., 20, 580–589, 1986.
Hjellbrekke, A. G.: Data Report 2002. Acidifying and eutrophying compounds, EMEP/CCC-Report 1/2004, 2004.
Hjellbrekke, A. G.: Data Report 2003. Acidifying and eutrophying compounds,
EMEP/CCC-20
Report 3/2005, 2005.
Kahnert, M., Lazaridis, M., Tsyro, S., and Tørseth, K.: Requirements for developing a regional monitoring capacity for aerosols in Europe within EMEP, J. Environ. Monit., 6, 646–655, 2004.
Kirchstetter, T. W., Corrigan, C. E., and Novakov, T.: Laboratory and field investigation of the
25
adsorption of gaseous organic compounds onto quartz filters, Atmos. Environ., 35, 1663– 1671, 2001.
Kiss, G., Varga, B., Galambos, I., and Ganszky, I.: Characterization of water-soluble or-ganic matter isolated from atmospheric fine aerosol, J. Geophys. Res., 107(D21), 8339, doi:10.1029/2001JD000603, 2002.
30
Klouda, G. A., Filliben, J. J., Parish, H. J., Chow, J. J. Watson, J. G., and Cary, R. A.: Reference material 8785: Air particulate matter on filter media, Aerosol Sci. Technol., 39, 173–183,
ACPD
7, 3859–3899, 2007 Elemental and organic carbon in PM10: a one year measurement K. E. Yttri et al. Title Page Abstract Introduction Conclusions References Tables Figures ◭ ◮ ◭ ◮ Back CloseFull Screen / Esc
Printer-friendly Version Interactive Discussion
2005.
Maenhaut, W., Chi X., Cafmeyer, J., Mikuˇska, P., Ve `eeøa, Z., and Broˇskoviov ´a, A.: Field Inves-tigations with a Diffusion Denuder for the Elimination of Sampling Artifacts for Carbonaceous Aerosols, J. Aerosol Sci., Abstracts of the European Aerosol Conference 2003, S1171– S1172, 2003.
5
Malm, W. C., Schichtel, B. A., Pitchford, M. L., Ashbaugh, L. L., and Eldred, R. A.: Spatial and monthly trends in speciated fine particle concentration in the United States, J. Geophys. Res., 109, D03306, doi:10.1029/2003JD003739, 2004.
Matthias-Maser, S.: Primary biological aerosol particles: Their significance, sources, sampling methods and size distribution in the atmosphere, in: Atmospheric particles, edited by:
Harri-10
son, R. M. and van Grieken, R., John Wiley & Sons, Chichester, 349–368, 1998.
McDow, S. R. and Huntzicker, J. J.: Vapor adsorption artifact in the sampling of organic aerosol: face velocity effects, Atmos. Environ., 24A, 2563–2571, 1990.
Pakkanen, T., Hillamo, R. E., Keronen, P., Maenhaut, W., Ducastel, G., and Pacyna, J. M.: Sources and physico-chemical characteristics of the atmospheric aerosol in southern
Nor-15
way, Atmos. Environ., 30, 1391–1405, 1996.
Pashynska, V., Vermeylen, R., Vas, G., Maenhaut, W., and Claeys, M.: Development of a gas chromatographic/ion trap mass spectrometric method for the determination of levoglucosan and saccharidic compounds in atmospheric aerosols, Application to urban aerosols, J. Mass Spectrom., 37, 1249–1257, 2002.
20
Putaud, J.-P., Raes, F., Van Dingenen, R., Br ¨uggemann, E., Facchini, M. C., Decesari, S., Fuzzi, S., Gehrig, R., H ¨uglin, C., Laj, P., Lorbeer, G., Maenhaut, W., Mihalopoulos, N., M ¨uller, K., Querol, X., Rodriguez, S., Schneider, J., Spindler, G., ten Brink, H., Tørseth, K., and Wiedensohler, A.: A European aerosol phenomenology – 2: chemical characteristics of particulate matter at kerbside, urban, rural and background sites in Europe, Atmos. Environ.,
25
38, 2579–2595, 2004.
Putaud, J. P. and Cavalli, F.: Development and validation of standardized protocols for sampling OC and analysing OC + EC for the EMEP network, In: EMEP 2006, edited by: Yttri, K. E. and Aas, W.,http://www.nilu.no/projects/ccc/reports.html, 2006.
Ramanathan, V., Crutzen, P. J., Kiehl, J. T., and Rosenfeld, D.: Atmosphere – Aerosols, climate,
30
and the hydrological cycle, Science, 294, 2119–2124, 2001.
Salma, I., Chi, X., and Maenhaut, W.: Elemental and organic carbon in urban canyon and background environments in Budapest, Hungary, Atmos. Environ., 38, 27–36, 2004.
ACPD
7, 3859–3899, 2007 Elemental and organic carbon in PM10: a one year measurement K. E. Yttri et al. Title Page Abstract Introduction Conclusions References Tables Figures ◭ ◮ ◭ ◮ Back CloseFull Screen / Esc
Printer-friendly Version Interactive Discussion
Schmid, H., Laskus, L., Abraham, H. J., Baltensperger, U., Lavanchy, V., Bizjak, M., Burba, P., Cachier, H., Crow, D., Chow, J., Gnauk, T., Even, A., ten Brink, H. M., Giesen, K. P., Hitzenberger, R., Hueglin, E., Maenhaut, W., Pio, C., Carvalho, A., Putaud, J. P., Toom-Sauntry, D., and Puxbaum, H.: Results of the ”carbon conference” international aerosol carbon round robin test stage 1, Atmos. Environ., 35, 2111–2121, 2001.
5
Sillanp ¨a, M., Frey, A., Hillamo, R., Pennanen, A. S., and Salonen, R.: Organic, elemental and inorganic carbon in particulate matter of six urban environments in Europe, Atmos. Chem. Phys., 5, 2869–2879, 2005,
http://www.atmos-chem-phys.net/5/2869/2005/.
Simoneit, B. R. T., Schauer, J. J., Nolte, C. G., Oros, D. R., Elias, V. O., Fraser, M. P., Rogge, W.
10
F., and Cass, G. R.: Levoglucosan, a tracer for cellulose in biomass burning and atmospheric particles, Atmos. Environ., 33, 173–182, 1999.
Stohl, A., Forster, C., Frank, A., Seibert, P., and Wotawa, C.: Technical Note: The Lagrangian Particle Dispersion Model FLEXPART Version 6.2, Atmos. Chem. Phys., 5, 2461–2474, 2005,
15
http://www.atmos-chem-phys.net/5/2461/2005/.
Subramanian, R., Khlystov, A. Y., Cabada, J. C., and Robinson, A. L.: Positive and negative artifacts in particulate organic carbon measurements with denuded and undenuded sampler configurations, Aerosol Sci. Technol., 38(S1), 27–48, 2004.
Turpin, B. J., Huntzicker, J. J., and Hering S. V.: Investigation of organic aerosol sampling
20
artefacts in the Los Angeles basin, Atmos. Environ., 28, 3061–3071, 1994.
Turpin, B. J., Saxena, P., and Andrews, E.: Measuring and simulating particulate organics in the atmosphere: problems and prospects, Atmos. Environ., 34, 2983–3013, 2000.
Turpin, B. J. and Lim, H.-J.: Species contributions to PM2.5 mass concentrations: Revisit-ing common assumptions for estimatRevisit-ing organic mass, Aerosol Sci. Technol., 35, 602–610,
25
2001.
Viana, M., Chi, X., Maenhaut, W., Cafmeyer, J., Querol, X., Alastuey, A., Mikuˇska, P., and Veea, Z.: Influence of sampling artefacts on PM, OC and EC levels in carbonaceous aerosols in an urban area, Aerosol Sci. Technol., 40, 107–117, doi:10.1080/02786820500484388, 2006a. Viana, M., Chi, X., Maenhaut, W., Querol, X., Alastuey, A., Mikuska, P., and Vecera, Z.: Organic
30
and elemental carbon concentrations in carbonaceous aerosols during summer and winter sampling campaigns in Barcelona, Spain, Atmos. Environ., 40, 2180–2193, 2006b.
Viidanoja, J., Kerminen, V. M., and Hillamo, R.: Measuring the size distribution of atmospheric 3880
ACPD
7, 3859–3899, 2007 Elemental and organic carbon in PM10: a one year measurement K. E. Yttri et al. Title Page Abstract Introduction Conclusions References Tables Figures ◭ ◮ ◭ ◮ Back CloseFull Screen / Esc
Printer-friendly Version Interactive Discussion
organic and black carbon using impactor sampling coupled with thermal carbon analysis: Method development and uncertainties, Aerosol Sci. Technol., 36, 607–616, 2002.
Zdr ´ahal, Z., Oliveira, J., Vermeylen, R., Claeys, M., and Maenhaut, W.: Improved method for quantifying levoglucosan and related monosaccharide anhydrides in atmospheric aerosols and application to samples from urban and tropical locations, Environ. Sci. Technol., 36,
5
747–757, 2002.
ACPD
7, 3859–3899, 2007 Elemental and organic carbon in PM10: a one year measurement K. E. Yttri et al. Title Page Abstract Introduction Conclusions References Tables Figures ◭ ◮ ◭ ◮ Back CloseFull Screen / Esc
Printer-friendly Version Interactive Discussion
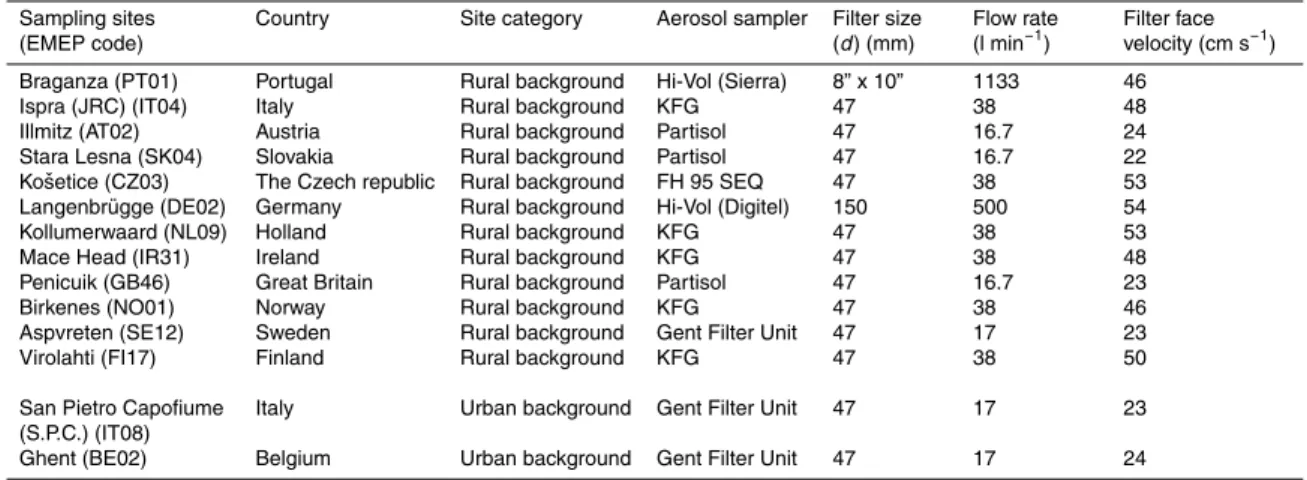
Table 1. Sampling sites and operational parameters of the sampling equipment used at the
various sites. The sites are ordered from south to north by latitude.
Sampling sites (EMEP code)
Country Site category Aerosol sampler Filter size
(d ) (mm)
Flow rate
(l min−1) Filter facevelocity (cm s−1)
Braganza (PT01) Portugal Rural background Hi-Vol (Sierra) 8” x 10” 1133 46
Ispra (JRC) (IT04) Italy Rural background KFG 47 38 48
Illmitz (AT02) Austria Rural background Partisol 47 16.7 24
Stara Lesna (SK04) Slovakia Rural background Partisol 47 16.7 22
Koˇsetice (CZ03) The Czech republic Rural background FH 95 SEQ 47 38 53
Langenbr ¨ugge (DE02) Germany Rural background Hi-Vol (Digitel) 150 500 54
Kollumerwaard (NL09) Holland Rural background KFG 47 38 53
Mace Head (IR31) Ireland Rural background KFG 47 38 48
Penicuik (GB46) Great Britain Rural background Partisol 47 16.7 23
Birkenes (NO01) Norway Rural background KFG 47 38 46
Aspvreten (SE12) Sweden Rural background Gent Filter Unit 47 17 23
Virolahti (FI17) Finland Rural background KFG 47 38 50
San Pietro Capofiume (S.P.C.) (IT08)
Italy Urban background Gent Filter Unit 47 17 23
Ghent (BE02) Belgium Urban background Gent Filter Unit 47 17 24
ACPD
7, 3859–3899, 2007 Elemental and organic carbon in PM10: a one year measurement K. E. Yttri et al. Title Page Abstract Introduction Conclusions References Tables Figures ◭ ◮ ◭ ◮ Back CloseFull Screen / Esc
Printer-friendly Version Interactive Discussion
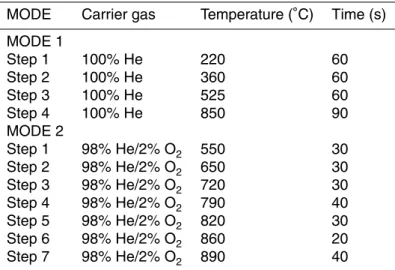
Table 2. Quartz parameter temperature program.
MODE Carrier gas Temperature (◦C) Time (s)
MODE 1 Step 1 100% He 220 60 Step 2 100% He 360 60 Step 3 100% He 525 60 Step 4 100% He 850 90 MODE 2 Step 1 98% He/2% O2 550 30 Step 2 98% He/2% O2 650 30 Step 3 98% He/2% O2 720 30 Step 4 98% He/2% O2 790 40 Step 5 98% He/2% O2 820 30 Step 6 98% He/2% O2 860 20 Step 7 98% He/2% O2 890 40 3883
ACPD
7, 3859–3899, 2007 Elemental and organic carbon in PM10: a one year measurement K. E. Yttri et al. Title Page Abstract Introduction Conclusions References Tables Figures ◭ ◮ ◭ ◮ Back CloseFull Screen / Esc
Printer-friendly Version Interactive Discussion
Table 3. Magnitude of the positive artefact reported for various European sites obtained using
tandem filter sampling.
References Location Site Size Sampling Correction/FFV Positive OC (µg m−3)
and time category fraction time (h) (cm s−1) artifact (%)
Viidanoja et al. (2002) Helsinki (FI), 1 year Urban PM2.5 24 QBQ/22 17±6 3.0 (1.0–8.5)
Salma et al. (2004) Budapest (HU), Spring Kerbside PM2.5 12 (day) QBQ/22 15±2
1
6.8 (3.5–14) (Median)
12 (night) QBQ/22 6.9 (3.6–15) (Median)
PM10 12 (day) QBQ/22 10±21 11 (5.9–24) (Median)
12 (night) QBQ/22 11 (4.6–23) (Median)
Viana et al. (2006a) Ghent (BE), Summer Urban backgr. PM2.5 24 QBQ/22 6 2.7±0.9 (Mean)
Maenhaut et al. (2003) Ghent (BE), Winter Urban backgr. PM2.5 48–72 QBQ/22 10 5.6 (5.4–12.6) (Median)
Viana et al. (2006b) Barcelona (ES), Summer Urban backgr. PM2.5 24 QBQ/22 14 3.6±1.4 (Mean)
Barcelona (ES), Winter 10 6.9±2.2 (Mean)
Putaud and Cavalli (2006) Ispra (IT), Winter Rural backgr. PM2.5 24 QBT/22 31±20 7.5±4.4 (Mean)
Ispra (IT), Summer 24 QBT/22 31±12 5.5±2.0 (Mean)
1
Both for day and night.
ACPD
7, 3859–3899, 2007 Elemental and organic carbon in PM10: a one year measurement K. E. Yttri et al. Title Page Abstract Introduction Conclusions References Tables Figures ◭ ◮ ◭ ◮ Back CloseFull Screen / Esc
Printer-friendly Version Interactive Discussion
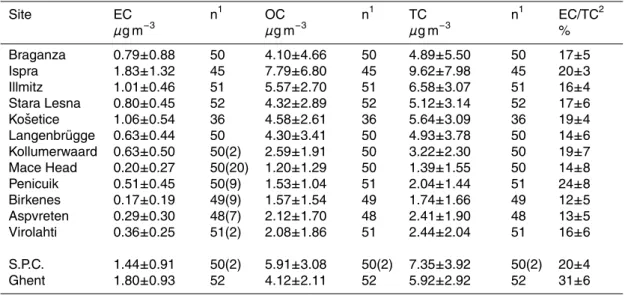
Table 4. Annual ambient concentrations of EC, OC, and TC, and relative contribution of EC to
TC. The sites are ordered from south to north by latitude.
Site EC µg m−3 n1 OC µg m−3 n1 TC µg m−3 n1 EC/TC2 % Braganza 0.79±0.88 50 4.10±4.66 50 4.89±5.50 50 17±5 Ispra 1.83±1.32 45 7.79±6.80 45 9.62±7.98 45 20±3 Illmitz 1.01±0.46 51 5.57±2.70 51 6.58±3.07 51 16±4 Stara Lesna 0.80±0.45 52 4.32±2.89 52 5.12±3.14 52 17±6 Koˇsetice 1.06±0.54 36 4.58±2.61 36 5.64±3.09 36 19±4 Langenbr ¨ugge 0.63±0.44 50 4.30±3.41 50 4.93±3.78 50 14±6 Kollumerwaard 0.63±0.50 50(2) 2.59±1.91 50 3.22±2.30 50 19±7 Mace Head 0.20±0.27 50(20) 1.20±1.29 50 1.39±1.55 50 14±8 Penicuik 0.51±0.45 50(9) 1.53±1.04 51 2.04±1.44 51 24±8 Birkenes 0.17±0.19 49(9) 1.57±1.54 49 1.74±1.66 49 12±5 Aspvreten 0.29±0.30 48(7) 2.12±1.70 48 2.41±1.90 48 13±5 Virolahti 0.36±0.25 51(2) 2.08±1.86 51 2.44±2.04 51 16±6 S.P.C. 1.44±0.91 50(2) 5.91±3.08 50(2) 7.35±3.92 50(2) 20±4 Ghent 1.80±0.93 52 4.12±2.11 52 5.92±2.92 52 31±6 1
n denotes the number of samples, whereas the number in parentheses is the number of samples below the detection limit. Samples with a concentration < detection limit are not included in the annual mean. Only days where EC and TC > detection limit are included in the mean EC/TC ratio.
ACPD
7, 3859–3899, 2007 Elemental and organic carbon in PM10: a one year measurement K. E. Yttri et al. Title Page Abstract Introduction Conclusions References Tables Figures ◭ ◮ ◭ ◮ Back CloseFull Screen / Esc
Printer-friendly Version Interactive Discussion
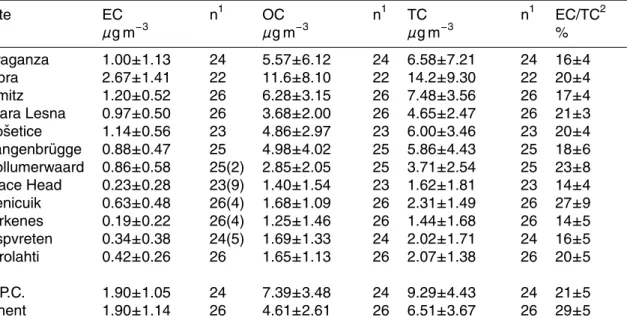
Table 5. Ambient wintertime (1 October 2002–1 April 2003) concentrations of EC, OC, and TC,
and relative contribution of EC to TC. The sites are ordered from south to north by latitude.
Site EC µg m−3 n1 OC µg m−3 n1 TC µg m−3 n1 EC/TC2 % Braganza 1.00±1.13 24 5.57±6.12 24 6.58±7.21 24 16±4 Ispra 2.67±1.41 22 11.6±8.10 22 14.2±9.30 22 20±4 Illmitz 1.20±0.52 26 6.28±3.15 26 7.48±3.56 26 17±4 Stara Lesna 0.97±0.50 26 3.68±2.00 26 4.65±2.47 26 21±3 Koˇsetice 1.14±0.56 23 4.86±2.97 23 6.00±3.46 23 20±4 Langenbr ¨ugge 0.88±0.47 25 4.98±4.02 25 5.86±4.43 25 18±6 Kollumerwaard 0.86±0.58 25(2) 2.85±2.05 25 3.71±2.54 25 23±8 Mace Head 0.23±0.28 23(9) 1.40±1.54 23 1.62±1.81 23 14±4 Penicuik 0.63±0.48 26(4) 1.68±1.09 26 2.31±1.49 26 27±9 Birkenes 0.19±0.22 26(4) 1.25±1.46 26 1.44±1.68 26 14±5 Aspvreten 0.34±0.38 24(5) 1.69±1.33 24 2.02±1.71 24 16±5 Virolahti 0.42±0.26 26 1.65±1.13 26 2.07±1.38 26 20±5 S.P.C. 1.90±1.05 24 7.39±3.48 24 9.29±4.43 24 21±5 Ghent 1.90±1.14 26 4.61±2.61 26 6.51±3.67 26 29±5 1
n denotes the number of samples, whereas the number in parentheses is the number of samples below the detection limit. Samples with a concentration < detection limit are not included in the annual mean. Only days where EC and TC > detection limit are included in the mean EC/TC ratio.
ACPD
7, 3859–3899, 2007 Elemental and organic carbon in PM10: a one year measurement K. E. Yttri et al. Title Page Abstract Introduction Conclusions References Tables Figures ◭ ◮ ◭ ◮ Back CloseFull Screen / Esc
Printer-friendly Version Interactive Discussion
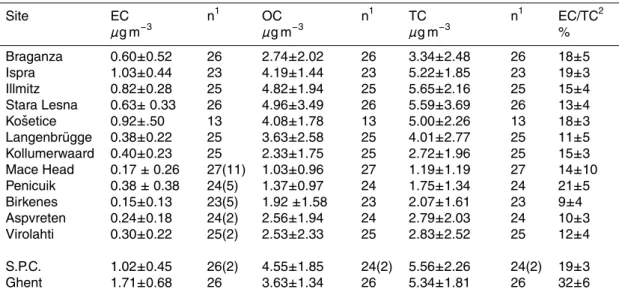
Table 6. Ambient summertime (1 July 2002–1 October 2002 and 1 April 2003–1 July 2003)
concentrations of EC, OC, and TC, and relative contribution of EC to TC. The sites are ordered from south to north by latitude.
Site EC µg m−3 n1 OC µg m−3 n1 TC µg m−3 n1 EC/TC2 % Braganza 0.60±0.52 26 2.74±2.02 26 3.34±2.48 26 18±5 Ispra 1.03±0.44 23 4.19±1.44 23 5.22±1.85 23 19±3 Illmitz 0.82±0.28 25 4.82±1.94 25 5.65±2.16 25 15±4 Stara Lesna 0.63± 0.33 26 4.96±3.49 26 5.59±3.69 26 13±4 Koˇsetice 0.92±.50 13 4.08±1.78 13 5.00±2.26 13 18±3 Langenbr ¨ugge 0.38±0.22 25 3.63±2.58 25 4.01±2.77 25 11±5 Kollumerwaard 0.40±0.23 25 2.33±1.75 25 2.72±1.96 25 15±3 Mace Head 0.17 ± 0.26 27(11) 1.03±0.96 27 1.19±1.19 27 14±10 Penicuik 0.38 ± 0.38 24(5) 1.37±0.97 24 1.75±1.34 24 21±5 Birkenes 0.15±0.13 23(5) 1.92 ±1.58 23 2.07±1.61 23 9±4 Aspvreten 0.24±0.18 24(2) 2.56±1.94 24 2.79±2.03 24 10±3 Virolahti 0.30±0.22 25(2) 2.53±2.33 25 2.83±2.52 25 12±4 S.P.C. 1.02±0.45 26(2) 4.55±1.85 24(2) 5.56±2.26 24(2) 19±3 Ghent 1.71±0.68 26 3.63±1.34 26 5.34±1.81 26 32±6 1
n denotes the number of samples, whereas the number in parentheses is the number of samples below the detection limit. Samples with a concentration < detection limit are not included in the annual mean. Only days where EC and TC > detection limit are included in the mean EC/TC ratio.
ACPD
7, 3859–3899, 2007 Elemental and organic carbon in PM10: a one year measurement K. E. Yttri et al. Title Page Abstract Introduction Conclusions References Tables Figures ◭ ◮ ◭ ◮ Back CloseFull Screen / Esc
Printer-friendly Version Interactive Discussion
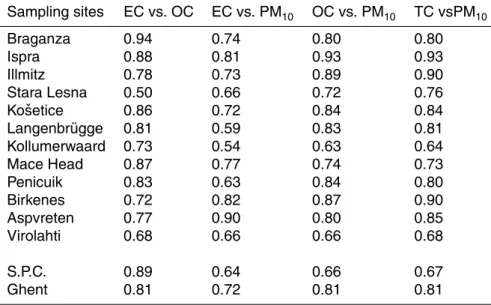
Table 7. Pearson correlation coefficients for EC vs. OC, EC vs. PM10, OC vs. PM10, and TC vs.
PM10. The sites are ordered from south to north by latitude.
Sampling sites EC vs. OC EC vs. PM10 OC vs. PM10 TC vsPM10 Braganza 0.94 0.74 0.80 0.80 Ispra 0.88 0.81 0.93 0.93 Illmitz 0.78 0.73 0.89 0.90 Stara Lesna 0.50 0.66 0.72 0.76 Koˇsetice 0.86 0.72 0.84 0.84 Langenbr ¨ugge 0.81 0.59 0.83 0.81 Kollumerwaard 0.73 0.54 0.63 0.64 Mace Head 0.87 0.77 0.74 0.73 Penicuik 0.83 0.63 0.84 0.80 Birkenes 0.72 0.82 0.87 0.90 Aspvreten 0.77 0.90 0.80 0.85 Virolahti 0.68 0.66 0.66 0.68 S.P.C. 0.89 0.64 0.66 0.67 Ghent 0.81 0.72 0.81 0.81 3888
ACPD
7, 3859–3899, 2007 Elemental and organic carbon in PM10: a one year measurement K. E. Yttri et al. Title Page Abstract Introduction Conclusions References Tables Figures ◭ ◮ ◭ ◮ Back CloseFull Screen / Esc
Printer-friendly Version Interactive Discussion
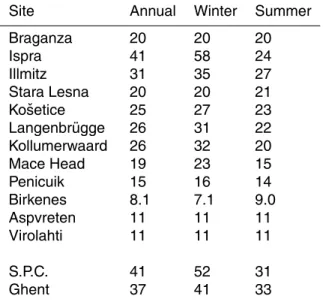
Table 8. Annual concentrations of PM10 (1 July 2002–1 July 2003), summertime
concentra-tions of PM10 (1 July 2002–1 October 2002 and 1 April–1 July 2003), and wintertime concen-trations of PM10(1 October 2002–1 April 2003). The sites are ordered from south to north. The concentrations are in µg m−3.
Site Annual Winter Summer
Braganza 20 20 20 Ispra 41 58 24 Illmitz 31 35 27 Stara Lesna 20 20 21 Koˇsetice 25 27 23 Langenbr ¨ugge 26 31 22 Kollumerwaard 26 32 20 Mace Head 19 23 15 Penicuik 15 16 14 Birkenes 8.1 7.1 9.0 Aspvreten 11 11 11 Virolahti 11 11 11 S.P.C. 41 52 31 Ghent 37 41 33 3889
ACPD
7, 3859–3899, 2007 Elemental and organic carbon in PM10: a one year measurement K. E. Yttri et al. Title Page Abstract Introduction Conclusions References Tables Figures ◭ ◮ ◭ ◮ Back CloseFull Screen / Esc
Printer-friendly Version Interactive Discussion
Table 9. Conversion factors used to convert organic carbon to organic matter and applied to
the sites in the campaign (n = number of samples subjected to WSOC analysis). The sites are ordered from south to north by latitude.
Site Conversion factor
Braganza 1.8 (n=11) Ispra 1.6 (n=5) Illmitz 1.7 (n=5) Stara Lesna 1.5 (n=4) Koˇsetice 1.4 (n=6) Langenbr ¨ugge 1.7 (n=11) Kollumerwaard 1.7 (n=3) Mace Head 1.4 (n=4) Penicuik 1.5 (n=5) Birkenes 1.7 (n=4) Aspvreten 1.6 (n=4) Virolahti 1.71 S.P.C. 1.7 (n=5) Ghent 1.8 (n=4)
The conversion factors are based on relative amounts of WSOC and WINSOC at the sites investigated. For WSOC a conversion factor of 2.1 has been used, whereas a factor of 1.3 was applied for WINSOC. A conversion factor of 1.1 was used to convert EC to EM.1Conversion factor is an average of the sites Aspvreten and Birkenes.