Science Arts & Métiers (SAM)
is an open access repository that collects the work of Arts et Métiers Institute of
Technology researchers and makes it freely available over the web where possible.
This is an author-deposited version published in: https://sam.ensam.eu Handle ID: .http://hdl.handle.net/10985/13074
To cite this version :
Ehsan ENFERAD, Christophe GIRAUD-AUDINE, Michel AMBERG, Betty LEMAIRE-SEMAIL, Frédéric GIRAUD - Differentiated Haptic Stimulation by Modal Synthesis of Vibration Field - In: World Haptic 2018, Etats-Unis, 2018-03-25 - World Haptic 2018 - 2018
Any correspondence concerning this service should be sent to the repository Administrator : [email protected]
Differentiated Haptic Stimulation by Modal Synthesis of Vibration Field
Ehsan Enferad
1, Christophe Giraud-Audine
1, Fr´ed´eric Giraud
1,
Michel Amberg
1and Betty Lemaire-Semail
1Abstract— To date, several focusing techniques have been proposed to realize localized stimulation on haptic interfaces. The localized stimulation can be achieved using arrays of actuators with delayed excitation, or by time reversal techniques which require a preliminary learning phase. The stimulation is thus limited to prerecorded cases. Additionally, these techniques are sensitive to parameters variation and disturbances. On the other hand, modal decomposition is another technique which allows to realize arbitrary vibration fields congruent with the boundary conditions without any preliminary learning phase. In this paper, we propose to use modal decomposition to realize a desired vibration velocity field in order to have differentiated stimuli. The experimental results validate the ability of the method to approximate satisfactorily a desired reference form. The psychophysic evaluations show that users can differentiate and localize the stimulation while exploring a surface with two fingers.
I. INTRODUCTION
Currently, there is a growing effort to implement haptic feedback on devices such as smartphones or tablets to en-hance the user’s experience. As an alternative to unbalanced rotor of rotating actuators, which offer poor controllability and cause a global vibration of the device, many proposal can be found in literature such as friction modulation [1], or focused elastic deformation [2]. The first approach is based on the vibration of the whole active surface (usually the screen). This results in a modulation of the apparent friction coefficient, which can be explained by the non linear behavior of the air trapped between the interface and the finger (squeeze effect), or by intermittent contact of the vibrating surface with the finger [3], [4]. The vibration can then be switched on and off according to a measurement of the user’s finger position to lure the user and render texturized surfaces [5]. However, since the whole surface is vibrated, it is difficult to offer a multi finger haptic interaction although some approaches could address this problem [6]. The second category, i.e focusing techniques, is realized using phase array or time reversal. Localized deformation of the interface can then be realized which can be used to create differentiated stimulation. In phase array techniques, a large number of transducers generate vibrations which are emitted with a time delay proportional to the distance separating a transducer and the focus area [2]. The signals *This work was realized in the frame of the MINT Team of the Institut de Recherche sur les Composants logiciels et mat´eriels pour lInformation et la Communication Avanc´ee IRCICA
1 The authors are with Univ. Lille, Centrale Lille, Arts
et M´etiers Paris Tech, HEI, EA 2697 - L2EP - Laboratoire d’Electrotechnique et d’Electronique de Puissance, F-59000 Lille, [email protected]
are simple, usually a few periods of sine waves, but the result can be somewhat coarse, and since the energy is spread on a large area the deformation is limited. Time reversal on the other hand uses more complicated signals which are recording by transducers of the propagated vibration due to an initial deformation at some location. Each transducer then plays backward the recorded signal, in a synchronous manner, to ”replay” the original deformation [7]. Therefore, an identification procedure, is required. The main drawback is that the tests conditions may differ from the operational condition in a real environment. To address this issue, closed loop is devised, but to our knowledge, not implemented yet. This paper is a first step toward generating arbitrary vibration field based on control in the modal space with an evaluation of its potential for multifinger tactile exploration. The main idea of the paper is to use the property of the modal shapes of an elastic structure which, under some assumptions, form an orthogonal basis. In the first part we recall the main prop-erties, and the protocol to realize a given velocity field thanks to its projection on a reduced set of modal shapes. Imposing velocity is motivated by the result found in [3]. In addition, we propose a way to calculate the voltages waveform applied to the transducers to control the transient in open-loop. The second part is devoted to experimental validations of the proposed method. A simple velocity field is successfully approximated over a limited number of identified modes measured on a simple thin beam equipped with piezoelectric ceramics. Finally, the third part discusses psychophysic tests that demonstrate the ability of the proposed technique to suggest different sensations on two fingers of the user. The results show that the users are able to recognize the zone with the largest velocity.
II. THEORETICAL BACKGROUND
We consider a device constituted by an elastic media equipped with piezoelectric ceramic glued on one side. The geometry considered here is flat, prismatic and thin compared to other dimensions, similar to a screen. The material is linear, the dissipation is small, i.e the structure is lightly damped. In such case, the theory recalled below holds [8] [9].
A. Modal decomposition
The solution to vibration problem of an elastic medium can be addressed using modal decomposition. The mode shapes displacement vectors ϕk, which depends on the geometry of the structure and the boundary conditions (BC), actually
define a complete orthogonal basis with respect to the inner product :
hϕj, ϕki =
Z
Dϕj· ϕkdΩ (1)
where D denotes the integration domain, and dΩ is an
elementary volume. For the scope of the paper, only plane geometries submitted to flexing deformation will be con-sidered. As a consequence, the only relevant component of the displacement vector ϕk is the out of plane displacement component, that will be denoted ϕk in the following. To obtain a normalized basis, one defines the normalization by setting the amplitude of the mode shape such that :
hρϕj, ϕki = δjk (2)
where ρ is the density of the medium, ϕjare the normalized modal shapes, and δjk= 1 if k = j and 0 otherwise . Hence, any time varying shape w(x, y,t) compatible with the BC can finally be expressed as : w(x, y,t) = ∞
∑
k=1 ϕk(x, y)ηk(t) (3)where ηk(t) are the time coefficients relative to mode k. In order to find these functions, the dynamic equation of the plate which is written :
ρ h ¨w+ D∇2w+ p(x, y,t) = 0 (4)
where D is the flexing rigidity of the plate, h is its thickness, and ∇2is the double Laplacian operator. Moreover, p(x, y,t) is the normal loading of the plate. It is either due to external perturbations, or, in our case, by actuators such as piezoelectric patches. Applying the inner product 1 to Eq 4 and a given mode ϕk, and considering the property (2) yields the decoupled dynamic equations governing each mode :
¨
ηk(t) + 2ξkωkη˙k(t) + ωk2ηk(t) = ψk(t) ψk(t) = h−p(t), ϕki
(5) ωkis the resonant frequency of mode k, and ξk is a damping coefficient introduced empirically to account for the damping of the mode. ψk is the modal force. Since p accounts for the forces applied by the piezoelectric actuators, the definition given in 5 shows that any mode can be excited by an actuator as long as the geometry of the actuator is chosen to ensure that ψk6= 0. Hence, an actuator will be able to excite several modes as long as the previous condition is fulfilled and that the time variation of p is chosen adequately with regards to the frequency response of the selected modes. Moreover, p is proportional to the voltage v(t) applied to the ceramics, and therefore it is also the case for ψk(t) : ψk(t) = Gkv(t), with Gk the gain. This property will be helpful to define the voltages.
B. Modes selection
As discussed above, in theory, an infinite number of modes is required to realize a given deformation shape. While, due to the physical constrains in the actuators such as their placement, the available geometries and more importantly
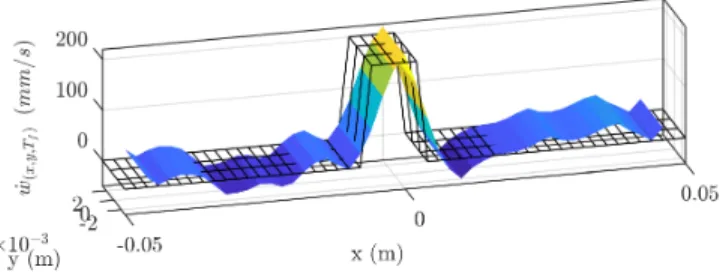
Fig. 1. Ideal reference velocity field (black meshed surface) and prac-tical reference velocity field obtained after modal superimposition on the truncated experimental modal basis (colored surface).
Fig. 2. Modal coefficient of nine modelled modes of the beam (black bars) for the desired velocity field and the selected modal coefficient to excite in experiment (blue bars)
calculation time limitation in the case of closed loop control, a finite number of modes should be excited practically. Con-sequently, the first issue is to simplify the modal projection of the desired velocity field. This will of course result in an approximation. Therefore, the included modes, which are called modelled modes, should be selected properly to yield an acceptable trade-off between complexity and fidelity to the initial desired velocity field. In this paper, as an example, the objective is to generate at the given time TF the velocity map depicted on Fig. 1 (black meshed surface). The desired deformation velocity field at focusing point ˙w(x, y, TF) has been decomposed to the first fifty modes and the modal velocity coefficients of the modes have been calculated for nine modelled modes as shown in Fig. 2 in black color. According to this figure, six modes have a significantly higher contribution in ˙w(x, y, TF), and were selected as a possible simplification. The selected modes were ϕ1, ϕ3, ϕ5, ϕ7, ϕ11and ϕ13which are shown in blue color in Fig. 2 and the resulting velocity is shown in color surface in Fig. 1. As it is seen, an acceptable approximation of desired velocity field can be achieved utilizing six selected modes.
Using modal decomposition, the initial value of the modes at focusing moment is known and their time dependence is described by eq. (5). As a result, a comprehensive knowledge of the excitation signal is available and in the perspective of closed loop control, an at resonance control of the modes is required, which already exists in literature [10] [5].
C. Open loop voltages calculation
The choice of the modes and their amplitudes as discussed above only concerns the instant when the focusing occurs that is the procedure above has yield the values ˙ηk(tF). Therefore, it remains to define the transient of the modes i.e calculate the time law ˙ηk(t) while ensuring their calculated values at t = tF. To do so, we base the choice of these functions on the following consideration : in order to limit the driving voltages that will result from the procedure, the frequency used to excite a mode should be close to its resonant frequency, and we set its raise time. Therefore, the time law (reference trajectory) during the raising phase is an increasing modulated exponential defined by :
˙
ηk(t) = Akectsin (dt − αk) (6)
where Akis an amplitude that must be determined, c = ξkωk and d =
q
1 − ξ2kωk. ξk is the transient damping that will be imposed with the relevant voltage. The corresponding displacement field ηk(t) and acceleration field ¨ηk can be deduced by integrating and differentiating with respect to time respectively. Moreover, the initial condition ηk(0) = 0 is imposed. In this paper, we chose c = a and d = b, that is the modes should evolve close to their natural (free) motion. This is motivated by the fact that at resonance, the forces –hence the voltages– needed for the vibration are minimal. Considering now the dynamic equation of one mode (5), and replacing the displacement, velocity and acceleration fields, one gets after some algebra :
ψk(t) = Ak
4a2ea(t−tF)sin (bt − α
k)
b (7)
To ensure the required modal velocities, it remains to cal-culate Ak from the condition AkeatFsin (btF) = ˙ηk(tF). To ensure that the modes are in phase at the focusing instant tF, one must set the phase αk such that btF− αk= ±π2+ 2nkπ where nk is an arbitrary integer. Finally, the voltages are deduced thank to the velocity gain of the considered mode. This is done through an identification procedure described in the next section.
III. EXPERIMENTAL SET UP
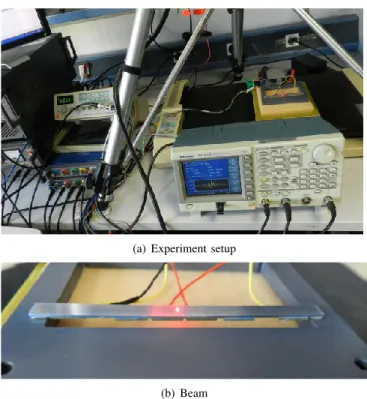
In order to investigate the feasibility of generating desired vibration field with modal excitation method, an experi-mental setup was designed to test a simple case of modal vibration generation. For this purpose, a beam equipped with piezoelectric actuators was realized and is presented in subsection III-A. The excitation voltage signals of actuator have been generated by a Textronix AFG 3022B arbitrary function generator. The generated signal has been connected to actuator after amplification with the power amplifier, as shown in Fig. 3(a). Velocity is measured a single point laser vibrometer (Polytec OFV 505). The measured vibration velocity is acquired by a Picoscope 3404 oscilloscope. All measurements are synchronized and processed using dedi-cated MATLAB routines that we developed.
(a) Experiment setup
(b) Beam
Fig. 3. (a) The photo of experimental setup with the beam on the xy-plotter, measurement and excitation equipments. (b) The geometry of beam which is fixed to a plastic chassis with double sided tape glue, the six actuator are visible in bottom side of the beam.
A. Design of beam
An aluminum beam with dimensions 100×6×2 mm3with
free-free boundary condition has been designed (Fig. 3(b)). Six piezoelectric actuators were glued on the beam and can excite the fifteen identified modes although as discussed only six of them will be used in this study. The two actuators at the center and the two outermost are respectively electrically connected, while the last ones are not used in the experiment, but provide some homogeneity of the geometry in order to avoid localized deformation resulting from the section variation.
B. Identification of mode shapes and modal parameters The characteristic modal parameters (ωk,ξk and Gk) must be identified on the actual mechanical structure. To do so, a frequency domain identification test has been realized on the beam. The piezoelectric actuators were excited with a chirp signal while the vibration of the beam was measured using a laser vibrometer to construct the Frequency Response Function (FRF) at regularly spaced location of the beam. Using peak-picking method, the resonance frequencies ( fk=
ωk
2π) were measured. By measurement of the half-power band-width around each resonance frequency, the damping factors (ξk) were identified. Finally, since at resonance ˙ηk=G2ξkv(t)
kωk2, the modal gains (Gk) have been identified. The identified parameters are presented in table I for nine identified modes and their mode shapes (ϕk(x, y)) are depicted on Fig. 4.
Fig. 4. Identified mode shapes (ϕk(x, y)) for nine modelled modes of beam.
TABLE I
IDENTIFIED MODAL PARAMETERS
Mode fk(Hz) ξk Gk(mm/(sV )) ϕ1 229 0.0437 +114 ϕ3 2553 0.0165 +654 ϕ5 7137 0.0265 +6500 ϕ7 12701 0.0168 -8346 ϕ9 22810 0.0112 +10414 ϕ11 29390 0.0166 -6285 ϕ13 58303 0.0101 -41448 ϕ15 68543 0.0176 -166030 ϕ17 87855 0.0147 +134615
IV. EXPERIMENTAL VALIDATION OF MODAL FOCUSING
A. Validation of the proposed method
Here, the method to implement the multi-modal excitation in the beam is validated against the desired final velocity field. As was discussed, the six more significant modes were selected, and were excited using two sets of actuators. Indeed, to avoid saturation of the amplifiers, the voltage resulting of the superimposition of the ”modal” voltages defined by eq. (7) were split between the center actuator set (ϕ1,ϕ3, ϕ11, ϕ13 ) and the side actuator set (ϕ5, ϕ7). The assignment of a particular mode excitation to an actuator set is done by selecting the best modal gain values between the two sets.
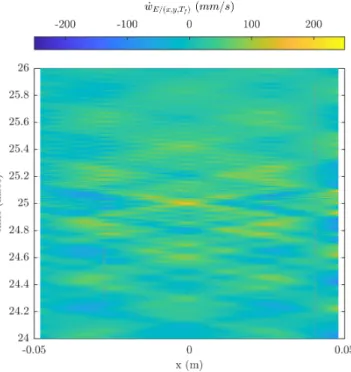
On fig. 5, the amplitude vs position on the beam (horizontal axis) and time (vertical axis) is presented near the focusing which was set to be at 25 ms and in the middle of the beam. It is clearly visible that the velocity field in this area is dominating on a spot measuring roughly 1.5 cm, the speed measured being 200 mm s−1. This speed is maintained to that level for roughly 20 µs. The overall process lasts 50 ms.
Fig. 5. spatial-temporal evolution of multi-modal vibration. Vertically : time from 24 ms 26 ms, horizontally : position along the central line of beam. Relative vibration velocity in mm/s
Fig. 6. The comparison of excited (used) mode coefficients (blue bars) with experimentally measured on the structures (green bars).
B. Evaluation of the velocity field at focusing time
To validate the velocity field obtained at t = 25 ms, fig. 7 presents its modal projection. The first two modes have been very well excited, but then some discrepancies are observed especially for modes ϕ5and ϕ11 with a maximum value of the error of 6 mm s−1. Considering the fact that this is obtained in open loop from experimental estimates of the damping, these results are considered satisfactory. This is confirmed by the experimental velocity field at the focusing instant, which is depicted on fig. 7, and is similar to the reference on fig . 1. However, it can be noticed that in addition to the bending, a torsion movement is present, probably due to the imperfection in the gluing of the actuator or of the boundary conditions. This could also explain the
Fig. 7. Experimental carthography of spatial form generation in t = TF
Fig. 8. Sprectrogram of the vibration velocity at the center during a focusing
differences between the desired and the experimental modal projections. However, the experimental velocity field is close enough to the reference to consider that the effect on the tactile stimulation should be similar.
V. PSYCHO PHYSIC EVALUATION A. Scope of the study
The idea is to evaluate the impact of the gradient of the velocity field for multi-finger interaction by contrast with a located interaction with a single finger as in [7]. The point is that, at this stage, the rise time of the two lowest frequencies modes are prominent as can be seen from the spectrogram of fig. 8. Thus, using one finger to explore the beam lead to no specific stimulation apart from shocks detectable everywhere. By contrast, the effect is striking when two fingers or more are in contact with the vibrating surface. In this case, the vibrating sensation ceases in the finger in contact with the lowest level of velocity, while the second finger still detects repeated ”shocks”. To confirm this, the following experiment was set.
Fig. 9. The scheme of beam which is divided to five spots of (’A’, ’B’, ’C’, ’D’ and ’E’), the participant is touching spot ’A’ by index finger and spot ’C’ by middle finger in photo.
B. Protocol
The surface of the beam has been divided into five equal zones, named ’A’, ’B’, ’C’, ’D’ and ’E’ as shown in Fig. 9. During the psychophysic test, the users were asked to use two fingers simultaneously, each of them being located on two different zones. The combination imposed were (A,C), (B,D) and (C,E), in order to reduce the mechanical cross talk between two fingers too close. The users were asked to test one of the combination at random, while the voltage were set to obtain maximum speeds 80 mm s−1, 100 mm s−1, 150 mm s−1 and 200 mm s−1 in random order. The stimuli for a given setting and location were repeated at a frequency of 7 Hz. For each run, the participants were asked to situate where they detected an event. The answers were categorized as ”right”, ”left” or ”both”. Ten participants, 3 women and 7 men aged between 22 and 38 years old, have been repeating the above mentioned processes for two sets of psycho physic experiments. In one experiment, the participants were asked to put index and middle finger of one hand on the sets of locations (A,C), (B,D) and (C,E) and compare the sensations under the index and middle fingers of the same hand (test 1). In the second experiment, participants put the index fingers of both hands simultaneously on the same sets of location and answered the same question (test 2).
C. Results and discussion
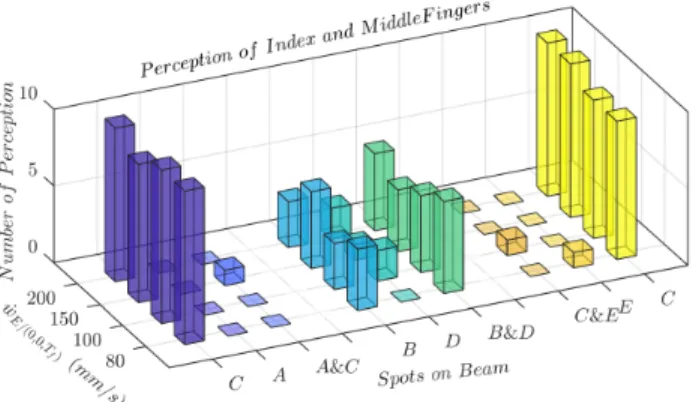
Fig. 10 sums up the result of test 1. In this figure, the dark blue bars with labels of ’C’, ’A’ and ’C & A’ represents the answers of participants when comparing vibration in spot ’A’ and ’C’ on the beam (as shown in Fig. 9), and clearly show that the participants dominantly chose spot ’C’ regardless of the vibration amplitude. They declared to have no feeling at ’A’ and to detect a vibration at ’C’. Only one participant had a similar feeling at 150 mm s−1. The yellow bars in Fig. 10, illustrates response of participant for comparing the haptic feeling between spot ’C’ and ’E’, this time the ’C’ column is dominantly selected by the ten participants for all vibration amplitudes. Only one participant felt that the stimulations in
Fig. 10. The perception results of index and middle fingers of ten participants, dark blue bars are number of perception for comparison of (A,C) spots, light blue bars are for (B,D) and yellow bars are for (C,E) spots.
Fig. 11. The perception results of right hand index and left hand index fingers of ten participants, dark blue bars are number of perception for comparison of (A,C) spots, light blue bars are for (B,D) and yellow bars are for (C,E) spots.
’C’ and ’E’ were the same when vibration the amplitude was at the lowest levels 80 mm s−1 and 100 mm s−1.
In the third case, comparing between spot ’B’ and ’D’ represented as light blue and light green bars on the Fig. 10 (column ’B’, ’D’ and ’B and D’), the sensation is different. Some participants felt a stronger vibration on the spot ’B’, while only one chose ’D’. Actually, most participants had the impression that both fingers were stimulated hence the majority of ’B & D’.
In fact, although the instantaneous speed in ’C’ on vibration velocity field when focusing occurs ( fig. 7) dominates, looking at the temporal evolution of the vibration on Fig. 5 shows that during transient spots ’B’ and ’C’ (located in the vicinity of −0.025 mm and 0.025 mm on the horizontal ’x’ axis) present symmetrical speed extrema before and after the focusing (roughly at 24.8 ms and 25.2 ms) although the amplitudes represent roughly half of the central speed at focusing. That is the whole focusing process influences the haptic feeling experience of the users. Actually, it seems that the user ”filters out” the vibration as if, in the process, the dominant speed was the only one perceived. Indeed, the ’A & C’ and ’C & E’ combination present the highest speed contrast, as opposed to ’B & D’ where the speeds are
almost equal. In the two first cases, the participants decide for the correct location, while for the last they cannot decide, and actually describe the experience as ”shocks between the fingers”. The second experience was designed to confirm that this ability to feel only the dominant side was not induced by some mechanical coupling induced by the hand : if the whole hand is vibrated at the lowest vibration amplitude, it makes sense that we feel only the difference of speed. Hence, a similar psycho physic experiment was repeated by the participants using both index as it is very unlikely that the path between the hands through the body can propagate the vibration. The results are repeated and follow the pattern observed in the previous test (depicted in Fig. 11).
VI. CONCLUSIONS
In this paper, the concept of the modal projection and modal excitation of vibration was proposed for haptic appli-cations and applied to realize a simple haptic interface. The voltages were calculated to obtain the focusing at a specified time. The resulting velocity field presented the high speed contrast as expected and a limited number of the modes was used. According to the psycho physic experiment results, the participants experience a differentiated haptic stimulation when using two fingers of the same or two different hands. Moreover, they can localize correctly the peak of the velocity field at the center of beam (’C’ spot). The first observations indicate that the sensation results from the difference of the vibration speed under each finger so that only the finger exposed to the largest amplitude feels the stimulation.
REFERENCES
[1] M. Biet, F. Giraud, and B. Lemaire-Semail. Squeeze film effect for the design of an ultrasonic tactile plate. IEEE Transactions on Ultrasonics, Ferroelectrics, and Frequency Control, 54(12):2678–2688, December 2007.
[2] Jung-Han Woo and Jeong-Guon Ih. Vibration rendering on a thin plate with actuator array at the periphery. 349:150–162.
[3] E. Vezzoli, W. Ben Messaoud, M. Amberg, F. Giraud, B. Lemaire-Semail, and M.-A. Bueno. Physical and Perceptual Independence of Ultrasonic Vibration and Electrovibration for Friction Modulation. IEEE Transactions on Haptics, 8(2):235–239, April 2015.
[4] Michal Wiertlewski, Rebecca Fenton Friesen, and J. Edward Colgate. Partial squeeze film levitation modulates fingertip friction. Proceedings of the National Academy of Sciences, 113(33):9210–9215, August 2016.
[5] W. Ben Messaoud, F. Giraud, B. Lemaire-Semail, M. Amberg, and M. A. Bueno. Amplitude control of an ultrasonic vibration for a tactile stimulator. IEEE/ASME Transactions on Mechatronics, 21(3):1692– 1701.
[6] S. Ghenna, C. Giraud-Audine, F. Giraud, M. Amberg, and B. Lemaire-Semail. Control and evaluation of a 2-d multimodal controlled-friction display. In 2017 IEEE World Haptics Conference (WHC), pages 593– 598.
[7] C. Hudin, J. Lozada, and V. Hayward. Localized Tactile Feedback on a Transparent Surface through Time-Reversal Wave Focusing. IEEE Transactions on Haptics, 8(2):188–198, April 2015.
[8] B. Porter and R. Crossley. Modal control theory and applications. Taylor and Francis, London 1972.
[9] Daniel J. Inman. Active modal control for smart structures. Philo-sophical Transactions of the Royal Society of London A: Mathemati-cal, Physical and Engineering Sciences, 359(1778):205–219, January 2001.
[10] F. Giraud, C. Giraud-Audine, M. Amberg, and B. Lemaire-Semail. Vector control method applied to a traveling wave in a finite beam. IEEE Transactions on Ultrasonics, Ferroelectrics, and Frequency Control, 61(1):147–158.