DISTRIBUTION OF TEMPERATURE AND SALINITY IN NORTHERN BAFFIN BAY DURING THE INTERNATIONAL NORTH WATER PROGRAM
(AUGUST 1997, APRIL TO JULY 1998, AND SEPTEMBER 1999) by
Yves Gratton1, Mathieu Ouellet2, Marie-Emmanuelle-Rail1 land R. Grant Ingram3
1
INRS-Eau, terre et environnement 490 de la Couronne
Québec, Qc Canada, G1K 9A9
2
Integrated Science Data Management Fisheries and Oceans Canada 200 Kent Ottawa, ON K1A 0E6
3
Dept. Oceanography University of British Columbia
Vancouver, B.C. Canada
© 2006, INRS-Eau, terre et environnement ISBN : 2-89146-386-2
CORRECT CITATION FOR THIS PUBLICATION :
Gratton, Y, M. Ouellet, M.-E. Rail and R.G. Ingram, 2006. Distribution of temperature and salinity in Northern Baffin Bay during the International North Water program (August 1997, April to July 1998, and September 1999). Internal Report No R987, INRS-ETE, Québec (Qc): x + 124 p.
ABSTRACT
This report presents the CTP (Conductivity, Temperature and Pressure) and ADCP (Acoustic Doppler Current Profiler) data obtained in Northern Baffin Bay during the International North Water Polynya (NOW) program, between August 1997 and October 1999. Temperature and salinity data are presented as West-East and South-North sections (color contours), while the 1997-1998 ADCP data from the first 100 m of the water column are presented as stick diagrams.
RÉSUMÉ
Ce rapport présente les données de CTP (conductivité, température et pression) et d’ADCP (Acoustic Doppler Current Profiler) recueillies entre août 1997 et octobre 1999 lors des campagnes d'échantillonnage dans le nord de la mer de Baffin, dans le cadre du projet international NOW (Étude de la polynie des eaux du nord). Les données de CTP sont présentées sous forme de sections (contours en couleurs) ouest-est et sud-nord. Les données d’ADCP pour les premiers 100 m sous la surface sont présentées sous forme de diagrammes en bâtonnets.
TABLE OF CONTENTS
Abstract / Résumé... iii
Table of Contents………...………. iv
List of Figures………...……… v
List of Tables...….………...v
List of Appendices...…..vi
Foreword : the NOW Research Network ………...x
Introduction...1
NOW field work…………...…...2
Data processing...………...3 CTP Data………...3 Mooring Data………...4 Discussion...………...…. ..6 Acknowledgements………..8 References...……..8 Appendices………..15
LIST OF FIGURES
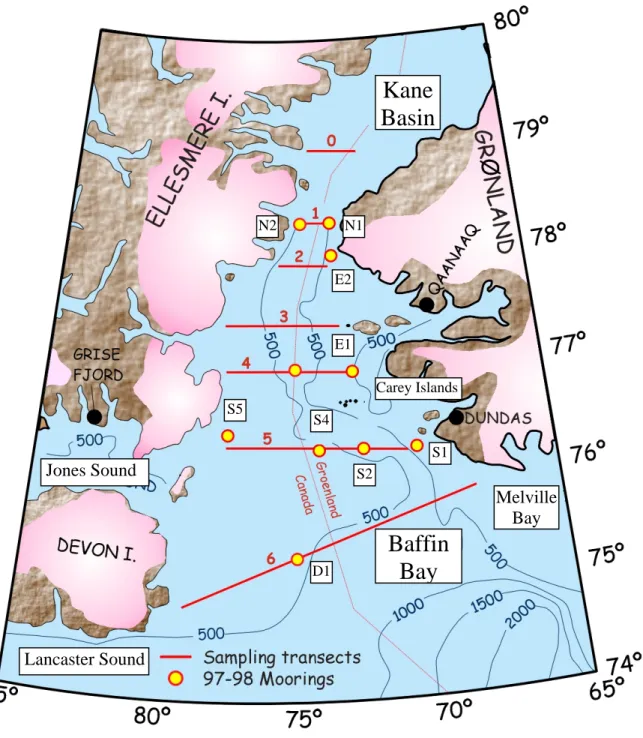
Figure 1. Map of Northern Baffin Bay, showing the seven sections, the 1997-1998 moorings and the bathymetry……..………...9
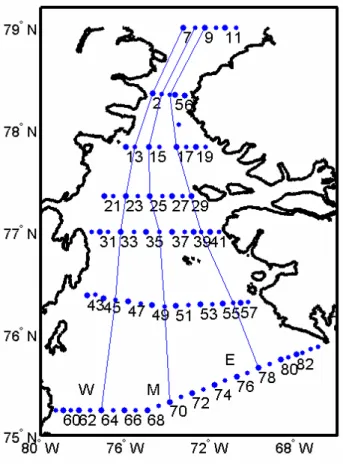
Figure 2. Theoretical location of the NOW stations for the six legs. The location of the three South-North Lines are also shown ………...10 Figure 3. High resolution sampling along section 6 (September 1999)…..…11
LIST OF TABLES
Table 1. Summary of moored instrument location, depth and data recovery for 1997-98 of the North Water Project (from Melling, 1999)……...12
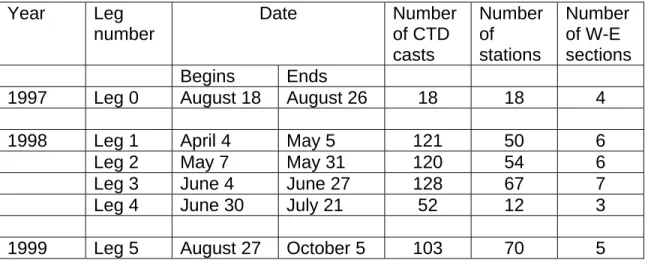
Table 2. Summary of the CTD sampling between 1997 and 1999………….13
Table 3 . Falmouth ICTD sensor specifications………..13
LIST OF APPENDICES
Appendix I : CTP casts location, sampling time, water depth and corresponding station (or mooring) numbers
I.1 Leg 0...16 I.2 Leg 1...17 I.3 Leg 2...20 I.4 Leg 3...23 I.5 Leg 4...27 I.6 Leg 5...29
Appendix II : Maps showing the casts positions for each leg II.1 Leg 0...33 II.2 Leg 1...34 II.3 Leg 2...35 II.4 Leg 3...36 II.5 Leg 4...37 II.6 Leg 5...38
Appendix III : Salinity and potential temperature sections; Leg0, August 1997 III.1 Section 1...40
III.2 Section 2...41
III.3 Section 3...42
III.4 Section 5...43
Appendix IV : Salinity and potential temperature sections; Leg1, April 1998 IV.1 Section 0...45
IV.2 Section 1...46
IV.3 Section 2...47
IV.4 Section 3...48
IV.6 Section 5...50
Appendix V : Salinity and potential temperature sections; Leg 2, May 1998 V.1 Section 0...52 V.2 Section 1...53 V.3 Section 2...54 V.4 Section 3...55 V.5 Section 4...56 V.6 Section 5...57
Appendix VI : Salinity and potential temperature sections; Leg 3, June 1998 VI.1 Section 0...59 VI.2 Section 1...60 VI.3 Section 2...61 VI.4 Section 3...62 VI.5 Section 4...63 VI.6 Section 5...64 VI.7 Section 6...65
Appendix VII : Salinity and potential temperature sections; Leg 4, July 1998 VII.1 Section 1...67
VII.2 Section 4...68
VII.3 Section 5...69
Appendix VIII : Salinity and potential temperature sections; Leg 5, September 1999 VIII.1 Section 1...71 VIII.2 Section 2...72 VIII.3 Section 4...73 VIII.4 Section 5...74 VIII.5 Section 6...75
Appendix IX : Longitudinal Sections (Lines)
IX.1 Leg 0, Line W (Western transect)...77
IX.2 Leg 0, Line E (Eastern transect)...78
IX.3 Leg 1, Line W (Western transect)...79
IX.4 Leg 1, Line M (Middle transect)...80
IX.5 Leg 1, Line E (Eastern transect)...81
IX.6 Leg 2, Line W (Western transect)...82
IX.7 Leg 2, Line M (Middle transect)...83
IX.8 Leg 2, Line E (Eastern transect)...84
IX.9 Leg 3, Line W (Western transect)...85
IX.10 Leg 3, Line M (Middle transect)...86
IX.11 Leg 3, Line E (Eastern transect)...87
IX.12 Leg 4, Line E (Eastern transect)...88
IX.13 Leg 5, Line W (Western transect)...89
IX.14 Leg 5, Line M (Middle transect)...90
IX.15 Leg 5, Line E (Eastern transect)...91
Appendix X : Low-frequency ADCP Data : Mooring N2 X.1 September 1997...93 X.2 October 1997...94 X.3 November 1997...95 X.4 December 1997...96 X.5 January 1998...97 X.6 February 1998...98 X.7 March 1998...99 X.8 April 1998...100 X.9 May 1998...101 X.10 June 1998...102
Appendix X1 : Low-frequency ADCP Data : Mooring S1 XI.1 September 1997...104 XI.2 October 1997...105 XI.3 November 1997...106 XI.4 December 1997...107 XI.5 January 1998...108 XI.6 February 1998...109 XI.7 March 1998...110 XI.8 April 1998...111 XI.9 May 1998...112 XI.10 June 1998...113
Appendix XII : Low-frequency ADCP Data : Mooring S2 XII.1 September 1997...115 XII.2 October 1997...116 XII.3 November 1997...117 XII.4 December 1997...118 XII.5 January 1998...119 XII.6 February 1998...120 XII.7 March 1998...121 XII.8 April 1998...122 XII.9 May 1998...123 XII.10 June 1998...124
FOREWORD : THE NOW NETWORK
The NOW research program was funded by Fisheries and Oceans Canada, Environment Canada and the National Sciences and Engineering Research Council of Canada under the Research Network Program. The NOW Network (1997-2001) was led by Prof. Louis Fortier of Laval University (Québec City), with the purpose of conducting the International North Water Polynya Study (NOW), as part of the International Arctic Polynya Program (IAPP) of the Arctic Ocean
Science Board (AOSB). In addition and most importantly, the Network has
maintained old and developed new national and international collaborations in Arctic marine science. Canadian leadership of an international Research Network focused on an integrated high-latitude study has substantially improved the stature of Canada in the study and stewardship of northern marine waters.
INTRODUCTION
Polynyas are regions of much reduced sea ice or open water in high latitude areas that are normally covered by sea ice. The North Water (NOW), which is located at the northern end of Baffin Bay and the southern part of Smith Sound (Fig. 1), is a recurring polynya. Although the boundaries of the North Water vary interannually, we define the polynya to be bounded by the coasts of Ellesmere Island and Greenland between latitudes 760 and 790N.
There are few published studies of field data from the NOW. Muench (1971) published the most comprehensive review of the physical oceanography of Northern Baffin Bay and the North Water polynya. He used the available historical data up to 1971 to describe the water masses, circulation and transports in the region. Addison (1987) analyzed over 130 CTD profiles from a 1986 cruise in Northern Baffin Bay and Nares Strait. Finally, a brief sampling program (Lewis et al. 1996) was conducted in the NOW polynya during May 1991. Fourteen stations were occupied (between 76020' - 77020'N). During this 48 h cruise, the first set of springtime physical and biological oceanographic data ever collected in the NOW were obtained. Bacle (2000) and Melling et al. (2001) analyzed the hydrographic and current meter mooring data, respectively, from the NOW 1997-1998 field experiment. Two journal special issues have now been published: volume 29, no 3, in Atmosphere-Ocean (2001) and volume 49, no 22-23, in Deep-Sea Research II (2002)
The objective of this report is to provide the NOW community with a synthesis of the enormous number, close to 600, of hydrographic CTP (Con-ductivity, Temperature and Pressure) profiles obtained between 1997 and 1999. We also present the (complex demodulated) near-surface (15 to 120 m) velocity from the three ADCP (Acoustic Doppler Current Profiler) moored in 1997-1998.
THE NOW FIELD PROGRAM : 1997-1999
The NOW data set consists of two years of moored data (temperature, salinity and currents) and three years of rosette sampling of biological, chemical and physical parameters. Current meters, thermistor chains and sediment traps were moored in August 1997: the location of the moorings is shown in Fig. 1 and a summary of the recovered data (from Melling, 1999) is presented in Table 1. The instruments were recovered in July 1998 and moored again until August 1999. The 1998-1999 data is still being processed.
Northern Baffin Bay and Southern Nares Strait were closed with a set of seven (7) sections (see fig. 1). A set of 84 “theoretical” stations, 10 km apart, was determined: their location is shown in Fig. 2. The region was visited six times between August 1997 and October 1999. The six visits or legs will be designated as Leg 0 to Leg 5 (see Table 2). Leg 0 (August 1997) was dedicated the mooring deployment and only 18 stations were visited. Leg 4 (July 1998) was also dedicated to mooring recuperation and re-deployment: only 12 stations were visited. Legs 1 (April 1998), 2 (May 1998), 3 (June 1998) and 5 (September 1999) lasted a month each, approximately. The objective of those four legs was to sample as many stations as possible within this time frame. The number of stations visited depended only on the ice cover and the meteorological conditions.
Up to five rosette casts were needed at some stations, the number of casts depending on the biologists / chemists water demands. A few (ca 25) ad
hoc stations were added on the way. A summary of all the CTP casts available in
the NOW data base in presented in Appendix I. The actual position of each cast is shown in Appendix II, where we included maps showing the spatial coverage for each of the six legs.
DATA PROCESSING
CTP Data
Hydrographic profiles were acquired during the International North Water Project using instruments provided by the Department of Fisheries and Oceans through the Institute of Ocean Sciences. Falmouth Scientific Inc (FSI ICTD) was the manufacturer of the CTD probe and the data acquisition and recording system. Electro-optical sensors for the measurement of light transmission (Sea Tech Inc, now Wet Labs) and chlorophyll fluorescence (same supplier) were mounted on the frame of the rosette sampler and interfaced to the CTD for data acquisition and recording. The ICTD sensor specifications are given in Table 3.
The quality control process included the usual steps: initial editing, sensor delay adjustment, sensor calibration, comparisons with bottle samples, spike editing and bin averaging (0.5 db). The profiles were then linearly interpolated every decibar (db). Profiles obviously in error or that did not cover 80% of the water column were discarded. Salinity, potential temperature, potential density and Brunt-Väisälä frequency were then computed according to the UNESCO (1985) standards. The resulting profiles were decimated every 5 m.
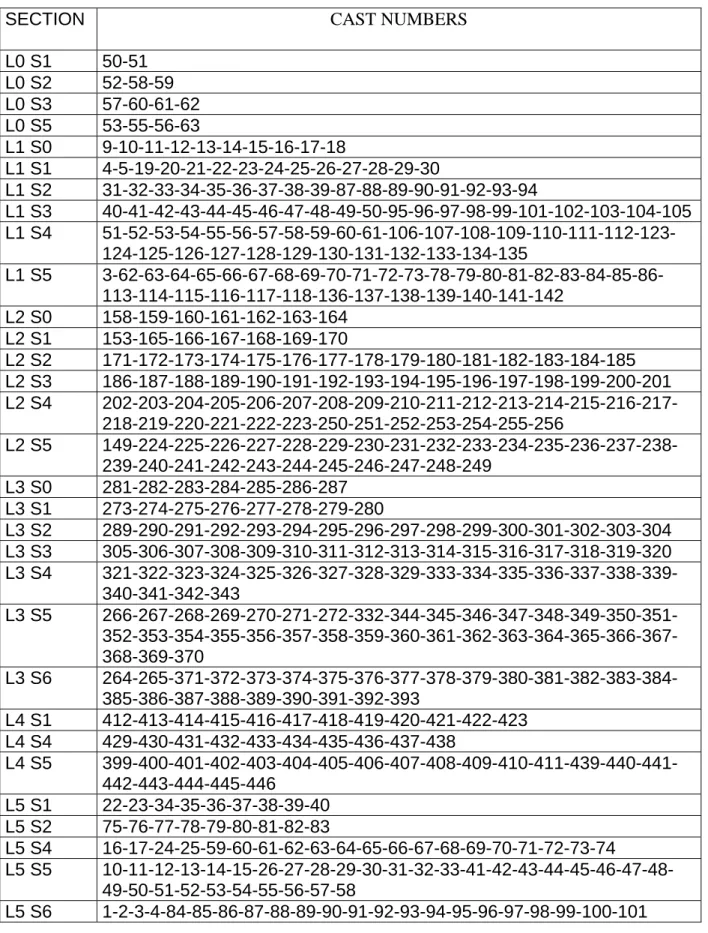
To reduce the quantity of information to a manageable level, temperature and salinity contours were prepared for each of the seven sections shown in Figure 1. The sections, organized by leg number, are presented in Appendices III to VIII. The number of sections in each leg is given in Table 2. All the available profiles along the same section were used in the interpolation process. The temperature and salinity data were interpolated on a 2 km by 10 m grid with a triangle-based cubic interpolation method and then contoured with Matlab. The origin of each section is the westernmost cast. Canada is therefore on the left
and Greenland on the right. The same color scale (except for Fig. 3) was used for all the zonal sections and meridional lines (see below) presented in this report.
Bacle (2000) discussed the South-North distribution of temperature and salinity in Leg 3 using three South-North lines or transects. The lines are shown in Figure 2. Appendix IX presents the distribution of temperature and salinity along those lines, for each leg. South is on the left and North on the right. The origin is always the southernmost station in each leg.
Moored ADCP Data
A detailed description of the mooring data quality control and processing can be found in Melling (1999). Here, we will briefly describe the ADCP data processing.
Six RD Instruments 300 kHz Workhorse ADCPs (Acoustic Doppler Current Profiler) were moored at approximately 150 m, on top of moorings N1, N2, E2, S1, S2 and S4. One was lost and two malfunctioned. The quality control (see Melling, 1999) of the remaining series show numerous gaps. To close the gaps and extract the low-frequency signal, complex demodulation was prefered over classical filtering.
Complex demodulation offers a more ‘intelligent’ approach to this challenge of determining current variation at low frequency. The intelligence of this approach is embedded in the kinematic model used to represent the variation in current within a short (< 36-hour) analysis window. The model used here to represent the variation of current is a rotating vector that traces out an ellipse over a specified short (< 24-hour) period added to a linearly changing vector that represents the background flow of longer period. Mathematically, with vectors represented by complex numbers, the kinematic model is expressed as:
− + − − + + +
+
+
⋅
′
⋅
+
′
+
⋅
+
jωt θ jωt θe
A
e
A
t
v
j
u
v
j
u
)
(
)
(
Here, j is (-1)1/2, t is time, (u, v) is the initial velocity, (ul, vl) is the
acceleration, ω is the angular frequency (radians/s) of the oscillatory vector that is the sum of a clockwise rotating vector of amplitude A+ and phase θ + and a
counter-clockwise rotating vector of amplitude A- and phase θ -. This model is fitted to available data by the method of least squares. The filtering results of the previous section reveal that currents in northern Baffin Bay have a strong semi-diurnal component, a weak semi-diurnal component and slower fluctuations at periods of days. We apply this model over a 30-hour analysis window, within which it is a good representation of reality. Since semi-diurnal tidal components cannot be resolved within such a short window, a single period equal to 12.4 hours has been assumed. The M2 tide (12.42 h) dominates the S2 (12.00 h) and N2 (12.66 h) tides.
Stick diagrams of the lowpass currents in the surface layer at N2, S1 and
DISCUSSION
The main features of the circulation that emerge from the literature are the southward flowing cold and fresher Baffin Current, the northward flowing warmer and saltier West Greenland Current and the eastward going Jones and Lancaster Sound net outflows. The complex bathymetry also plays a major role in the
circulation. Shallow sills (< 200 m) are found in Kane Basin, Jones Sound and Lancaster Sound, which restrict the inflow of Arctic water at depth. Also, a deep north-south trough (500 to 900 m) is found between Nares Strait and Melville Bay. The general circulation is cyclonic, with the West Greenland Current branching westward at three locations: in Melville Bay (following the 600 m
isobath), near the Carey Islands and in Smith Sound. These three main branches later join the Baffin Current.
Our geostrophic calculations (not shown) confirm the general circulation pattern but yields unreasonably large values of geostrophic flow. We believe that these large values are not associated with unreasonable vertical profiles of
temperature and salinity or with anomalous T-S correlations. It is possible that large values of shear are a consequence of an aliasing of the underlying
hydrographic structure by internal tides. The time required to complete sections is long relative to the semi-diurnal period. Time series of density derived from
moored instruments do contain appreciable variance of semi-diurnal period.
The other interesting feature is the location of a front observed at the same location on Section 6 (Appendix VI.7) in June 1998 and September 1999 (Appendix VIII.6). After observing the front in 1998 (fig. 3, upper panel), it was
decided to sample the region between stations 68 and 70 at a higher spatial resolution in 1999. Five additional CTD casts were obtained between the two stations (fig. 3, bottom panel). The front was at the same location and separates the warm West Greenland Current from the cooler water on the Canadian side.
ACKNOWLEDGEMENTS
We would like to thank the Captains and crews of the Canadian Icebreakers Louis St-Laurent and Pierre Radisson for their outstanding collaboration. Thank you also to the students, technicians and scientists who contributed to the rosette sampling, cast after cast after cast. Thank you to Doug Sieberg and Paul Peltola for the moorings.
REFERENCES
Addison, V.G. Jr, 1987. Physical oceanography of the Northern Baffin Bay-Nares Strait region. M.Sc. thesis, Naval Postgraduate School, Monterey, 99 p. Bacle, J., 2000. The physical oceanography of waters under the North Water
Polynya. M.Sc. thesis, McGill University, Montreal, Qc, 104 p. Ingram, R.G., J. Bacle, D. G. Barber , Y. Gratton, and H. Melling. Physical
processes in the North Water Polynya. Deep Sea Res. II, 49, 4893-4906. Lewis, E.L., D. Ponton, L. Legendre and B. Leblanc, 1996. Springtime sensible
heat, nutrients and phytoplankton in the Northwater Polynya, Canadian Arctic. Cont. Shelf Res. 16: 1775-1792.
Melling, H., 1999.Observations by moored instruments in Northern Baffin Bay 1997-1998. Unpub. Rep., Institute of Ocean Sciences, Sydney, B.C., 37 p. Melling. H, Y. Gratton and R.G. Ingram. Oceanic circulation within the North Water
polynya in Baffin Bay. Atmosphere-Ocean, 39, 301-325.
Muench R.D. 1971 The physical oceanography of the Northern Baffin Bay
Region. AINA Research Paper No 1. The Arctic Institute of North America, University of Calgary, Calgary, Alberta, Canada. 150 pp.
UNESCO, 1985. The international system of units (SI) in oceanography.
Figure 1. Map of the NOW sampling region, showing the seven sections and the bathymetry. Depth contours are in meters.
Jones Sound Lancaster Sound
Baffin
Bay
Kane
Basin
Melville Bay Carey Islands N1 N2 E2 E1 D1 S5 S4 S2 S1Figure 2. Theoretical location of the NOW stations for the six legs. The three South-North Lines (W, M and E) are also shown.
Figure 3. Section 6 from June 1998 (top) and September 1999 (bottom). 0 10 20 30 40 50 60 70 80 90 Distance -600 -500 -400 -300 -200 -100 0 Dep th (m) Stn.66 68 69 70 72 0 50 100 150 200 250 300 350 400 Distance (km) -600 -500 -400 -300 -200 -100 0 De pth (m ) 59 372-3 62 64 66 68 70 72 74 76 78 80 82
Table I. Summary of moored instrument location, depth and data recovery for 1997-98 of the North Water Project (from Melling, 1999).
Site H (nT) Decl (deg) Depth (m) Level (m) Instrument s/n Current Speed Current
Direction Temperature Salinity Pressure Echo Comment Start Stop
N2 78 21.26 74 42.74 3303 -73.2 484 108 ADCP 273 15 levels 15 levels 1 level 15 levels Depth varies by 140 m 1-Sep-97 13-Jul-98 203 BIO Trap 1 9 of 14 cups functioned 15-Nov-97 13-Jul-98
284 RCM7 10298 x x 1 level 1 level 1 level Rotor/compass malfunctions 19-Aug-97 13-Jul-98
394 BIO Trap 2 455 RCM7 9179 478 Release 5270923
N1 78 20.80 73 38.40 3412 -72.4 560 121 SeaCat 88
191 RCM7 10761 x x x x No data recorded
321 RCM4 7921 1 level 1 level 1 level 1 level 20-Aug-97 10-Jul-98
491 RCM7 10270 1 level 1 level 1 level 1 level 20-Aug-97 10-Jul-98
554 Release 5240917
E2 78 02.47 73 16.29 3496 -71.3 248 87 ADCP 272 x x 1 level 8 levels Compass malfunction 1-Dec-97 15-Jul-98 89 SeaCat 89
242 WLR-7 1427 1 level 1 level 20-Aug-97 25-Jun-98
243 Release 17309
E1 76 59.75 72 23.91 3760 -67.9 587 120 ADCP 296 x x x x No data recorded
300 RCM7 10301 1 level 1 level 1 level 1 level 22-Aug-97 19-Jun-98
549 RCM4 1930 1 level 1 level 1 level 1 level 22-Aug-97 19-Jun-98 581 Release 4940882
S1 76 18.17 70 13.77 4130 -64.8 272 83 ADCP 335 8 levels 8 levels 1 level 8 levels 1-Sep-97 5-Jul-98 259 RCM4 7913
266 Release 4940877
S2 76 17.39 71 56.37 3939 -65.8 556 97 ADCP 333 10 levels 10 levels 1 level 10 levels 1-Sep-97 20-Jul-98
198 Technicap PPS.3/3 12 cups 23-Aug-97 1-Jul-98
279 RCM7 10306 1 level x 1 level 1 level 1 level Compass malfunction 23-Aug-97 20-Jul-98
507 Technicap PPS.3/3 12 cups 23-Aug-97 1-Jul-98
525 RCM4 7911 1 level 1 level 1 level 1 level 23-Aug-97 20-Jul-98 550 Release 5270918
S4 76 15.82 74 10.09 3686 -67.0 443 104 ADCP 367 ? ? 1 level 11 levels No compass calibration 1-Sep-97 7-Jul-98
205 OSU Tracer 15 14 cups 26-Aug-97 1-Jul-98
284 RCM4 7914 1 level 1 level 1 level 1 level 25-Aug-97 7-Jul-98 393 OSU Tracer 15
423 RCM4 7916 437 Release 5270919
S5 76 22.59 77 24.03 3287 -69.1 365 138 SeaCat 87 1 level 1 level 1 level 21-Aug-97 7-Jul-98
206 RCM7 10302 1 level 1 level 1 level 1 level 1 level 21-Aug-97 7-Jul-98
257 Technicap PPS.3/3 12 cups 21-Aug-97 1-Jul-98
315 Technicap PPS3 6 cups 21-Aug-97 18-May-98
340 RCM4 7920 1 level x 1 level 1 level Compass malfunction 21-Aug-97 7-Jul-98 359 Release 5270925
D1 75 15.30 74 59.13 3764 -64.5 477 250 Parflux McLean 21 cups 27-Aug-97 1-Jul-98
297 RCM7 12213 1 level 1 level 1 level 1 level 26-Aug-97 6-Jun-98
361 RCM7 12214 1 level 1 level 1 level 1 level 26-Aug-97 1-Jul-98
406 Parflux McLean 21 cups 27-Aug-97 1-Jul-98
469 Release 471 Release
Instrument not recovered
Instrument not recovered Instrument not recovered Instrument not recovered Instrument not recovered
Instrument not recovered
North Latitude
West Longitude
Instrument not recovered Instrument not recovered Instrument not recovered Instrument not recovered
Table 2. Summary of the CTD sampling between 1997 and 1999. Year Leg number Date Number of CTD casts Number of stations Number of W-E sections Begins Ends
1997 Leg 0 August 18 August 26 18 18 4 1998 Leg 1 April 4 May 5 121 50 6 Leg 2 May 7 May 31 120 54 6 Leg 3 June 4 June 27 128 67 7 Leg 4 June 30 July 21 52 12 3 1999 Leg 5 August 27 October 5 103 70 5
Table 3 . Falmouth ICTD sensor specifications
Sensor Range Accuracy
Pressure 0 to 7000 db 0.03% Conductivity 1 to 65 µS cm-1 0.003 Temperature -2° to 32°C 0.003
Table 4 . Lists of the casts used for each section.
SECTION CAST NUMBERS
L0 S1 50-51 L0 S2 52-58-59 L0 S3 57-60-61-62 L0 S5 53-55-56-63 L1 S0 9-10-11-12-13-14-15-16-17-18 L1 S1 4-5-19-20-21-22-23-24-25-26-27-28-29-30 L1 S2 31-32-33-34-35-36-37-38-39-87-88-89-90-91-92-93-94 L1 S3 40-41-42-43-44-45-46-47-48-49-50-95-96-97-98-99-101-102-103-104-105 L1 S4 51-52-53-54-55-56-57-58-59-60-61-106-107-108-109-110-111-112-123-124-125-126-127-128-129-130-131-132-133-134-135 L1 S5 3-62-63-64-65-66-67-68-69-70-71-72-73-78-79-80-81-82-83-84-85-86-113-114-115-116-117-118-136-137-138-139-140-141-142 L2 S0 158-159-160-161-162-163-164 L2 S1 153-165-166-167-168-169-170 L2 S2 171-172-173-174-175-176-177-178-179-180-181-182-183-184-185 L2 S3 186-187-188-189-190-191-192-193-194-195-196-197-198-199-200-201 L2 S4 202-203-204-205-206-207-208-209-210-211-212-213-214-215-216-217-218-219-220-221-222-223-250-251-252-253-254-255-256 L2 S5 149-224-225-226-227-228-229-230-231-232-233-234-235-236-237-238-239-240-241-242-243-244-245-246-247-248-249 L3 S0 281-282-283-284-285-286-287 L3 S1 273-274-275-276-277-278-279-280 L3 S2 289-290-291-292-293-294-295-296-297-298-299-300-301-302-303-304 L3 S3 305-306-307-308-309-310-311-312-313-314-315-316-317-318-319-320 L3 S4 321-322-323-324-325-326-327-328-329-333-334-335-336-337-338-339-340-341-342-343 L3 S5 266-267-268-269-270-271-272-332-344-345-346-347-348-349-350-351- 352-353-354-355-356-357-358-359-360-361-362-363-364-365-366-367-368-369-370 L3 S6 264-265-371-372-373-374-375-376-377-378-379-380-381-382-383-384-385-386-387-388-389-390-391-392-393 L4 S1 412-413-414-415-416-417-418-419-420-421-422-423 L4 S4 429-430-431-432-433-434-435-436-437-438 L4 S5 399-400-401-402-403-404-405-406-407-408-409-410-411-439-440-441-442-443-444-445-446 L5 S1 22-23-34-35-36-37-38-39-40 L5 S2 75-76-77-78-79-80-81-82-83 L5 S4 16-17-24-25-59-60-61-62-63-64-65-66-67-68-69-70-71-72-73-74 L5 S5 10-11-12-13-14-15-26-27-28-29-30-31-32-33-41-42-43-44-45-46-47-48-49-50-51-52-53-54-55-56-57-58 L5 S6 1-2-3-4-84-85-86-87-88-89-90-91-92-93-94-95-96-97-98-99-100-101
Appendix I : CTD casts location, sampling time, water depth
and corresponding station or mooring numbers (C.H. stands for Cape Hershey).
Warning : station numbers in leg 0 DO NOT correspond the station numbers of the other five (5) legs.
Cast Number Station / mooring Start Date UTC Start Time UTC Start Latitude (N) Start Longitude (W) Sounder depth (m)
LEG 0
* 50 L2 / N2 19-08-97 0319 78°21.47 74°42.37 510 51 L5 / N1 19-08-97 1930 78°20.53 73°40.77 656 52 E2 20-08-97 0504 78°02.74 73°17.94 267 53 L44 / S5 21-08-97 1412 76°22.72 77°24.30 371 54 L40 / E1 21-08-97 0018 76°59.76 72°24.33 581 55 L58 / S1 22-08-97 1235 76°18.34 70°13.78 280 56 L54 / S2 22-08-97 2028 76°17.46 71°56.17 575 57 L22 23-08-97 1206 77°21.82 73°37.40 295 58 L24 23-08-97 1918 78°00.17 73°53.36 515 59 L25 23-08-97 2342 77°59.87 75°0.73 515 60 L28 24-08-97 1123 77°21.15 76°22.18 392 61 L29 24-08-97 1644 77°21.53 74°59.85 642 62 L22-2 24-08-97 2203 77°21.58 73°36.37 296 63 L50 / S4 25-08-97 1559 76°15.90 74°10.17 447 64 L68 / D1 25-08-97 2133 75°14.94 74°59.83 500 65 L10 26-08-97 1214 75°53.06 75°43.11 374 66 L11 26-08-97 1711 75°43.00 77°10.00 260 67 L12 26-08-97 2340 75°30.95 78°34.95 561 *Station numbers in leg 0 DO NOT correspond the station numbers of the other five (5) legs.
Cast Number Station / mooring Start Date UTC Start Time UTC Start Latitude (N) Start Longitude (W) Sounder depth (m)
LEG 1
3 A49 4-4-98 2303 76°17.192 074°47.455 478 4 A2 9-4-98 2105 78°21.696 074°42.657 290 5 A2 10-4-98 0040 78°20.338 074°45.320 450 8 C.H. 11-4-98 0824 78°35.977 074°20.641 189 9 A7 11-4-98 1228 78°59.344 073°16.611 250 10 A7 11-4-98 1502 78°59.818 073°15.042 252 11 A8 11-4-98 1734 78°59.997 072°45.364 287 12 A9 11-4-98 2134 79°00.564 072°16.481 260 13 A9 11-4-98 2316 79°00.200 072°16.140 240 14 A7 12-4-98 0812 79°00.557 073°11.331 240 15 A7 12-4-98 1121 78°59.976 073°18.281 249 16 A7 12-4-98 1345 78°59.897 073°16.220 249 17 A7 12-4-98 1815 79°00.098 073°12.342 250 18 A89 13-4-98 0015 78°58.088 071°10.142 397 19 A4 13-4-98 0419 78°20.679 074°18.000 604 20 A4 13-4-98 0700 78°21.551 073°51.815 520 21 A3 13-4-98 1012 78°20.438 074°19.620 470 22 A2 13-4-98 1136 78°21.896 074°41.310 539 23 A2 13-4-98 1402 78°21.437 074°40.420 624 24 A2 13-4-98 1719 78°22.041 074°43.764 205 25 A2 13-4-98 1945 78°21.232 074°40.439 635 26 A2 13-4-98 2310 78°22.267 074°42.438 330 28 A2 14-4-98 0957 78°21.588 074°39.853 631 29 A2 14-4-98 1154 78°21.968 074°39.568 627 31 A14 15-4-98 1851 77°48.992 075°28.930 610 32 A14 15-4-98 2052 77°50.000 075°25.000 630 33 A15 16-4-98 0210 77°50.135 074°55.515 689 35 A16 16-4-98 0849 77°50.068 074°26.775 730 36 A16 16-4-98 1148 77°48.658 074°23.694 644 37 A16 16-4-98 1643 77°49.992 074°23.597 690 38 A16 16-4-98 1948 77°50.837 074°47.368 670 39 A16 16-4-98 2335 77°49.623 074°22.422 650 40 A25 17-4-98 0427 77°21.539 074°49.106 669 41 A25 17-4-98 0723 77°22.197 074°55.065 662 42 A24 17-4-98 1017 77°20.461 075°26.383 595 43 A23 17-4-98 1211 77°20.580 075°58.783 538 44 A23 17-4-98 1426 77°21.054 076°00.464 54045 A22 17-4-98 2112 77°20.525 076°28.909 428 47 A22 18-4-98 0135 77°20.497 076°28.849 425 48 A22 18-4-98 0316 77°20.497 076°28.849 427 49 A22 18-4-98 0649 77°20.523 076°28.935 429 51 A34 18-4-98 1849 77°00.903 075°39.715 520 52 A33 18-4-98 2027 76°59.670 076°12.569 204 53 A33 18-4-98 2224 76°59.000 076°13.696 199 54 A32 19-4-98 0117 77°00.281 076°49.276 164 56 A35 19-4-98 1009 76°59.008 075°02.572 547 57 A35 19-4-98 1454 77°00.187 075°01.799 557 58 A35 19-4-98 1808 76°59.838 075°01.245 554 59 A31 19-4-98 2158 77°00.390 077°00.384 287 60 A31 19-4-98 2341 76°59.321 077°10.339 310 61 A30 20-4-98 0204 77°01.116 077°31.856 197 62 A44 20-4-98 0711 76°23.655 077°24.188 330 63 A45 20-4-98 1026 76°20.558 077°01.256 298 64 A45 20-4-98 1250 76°19.471 077°01.926 297 65 A46 20-4-98 1521 76°20.216 076°27.822 163 66 A47 20-4-98 1801 76°19.643 075°53.083 295 67 A47 20-4-98 2009 76°19.100 075°53.488 325 68 A48 20-4-98 2237 76°17.759 075°18.064 394 70 A44 21-4-98 1020 76°22.947 077°23.148 358 71 A44 21-4-98 1533 76°22.822 077°24.364 373 73 A44 21-4-98 1831 76°21.434 077°24.542 400 74 A92 22-4-98 0118 76°03.068 077°21.442 378 75 A93 22-4-98 0518 76°02.872 076°19.605 282 76 A94 22-4-98 0919 76°02.765 075°23.142 342 77 A95 22-4-98 1330 76°03.176 074°19.810 405 78 A49 22-4-98 2310 76°20.150 074°41.951 469 79 A49 23-4-98 0050 76°20.151 074°41.951 473 80 A49 23-4-98 0219 76°20.179 074°42.734 474 83 A49 23-4-98 1001 76°19.224 074°40.304 464 85 A49 23-4-98 1328 76°19.117 074°41.199 466 86 A49 24-4-98 1752 76°14.587 074°34.454 446 87 A14 26-4-98 0306 77°49.895 075°28.948 594 88 A14 26-4-98 0602 77°49.912 075°28.873 592 89 A15 26-4-98 0846 77°50.702 074°53.254 705 90 A16 26-4-98 1108 77°49.549 074°26.839 710 91 A16 26-4-98 1336 77°49.365 074°26.553 710 92 A17 26-4-98 1605 77°50.126 073°35.090 265 93 A18 26-4-98 1845 77°50.381 073°04.406 161 94 A18 26-4-98 2025 77°51.016 073°02.341 158 95 A27 27-4-98 0256 77°22.998 073°50.023 344 96 A27 27-4-98 0540 77°20.694 073°47.259 360
97 A27 27-4-98 0808 77°20.963 073°46.778 338 99 A27 27-4-98 1137 77°23.484 073°53.141 362 101 A26 27-4-98 1835 77°20.342 074°19.462 718 102 A25 27-4-98 2016 77°20.054 074°52.831 676 103 A25 27-4-98 2255 77°18.948 074°57.214 661 104 A24 28-4-98 0129 77°21.510 075°24.837 590 105 A23 28-4-98 0304 77°21.014 075°56.677 543 106 A30 28-4-98 1646 77°01.257 077°32.088 204 107 A35 28-4-98 2341 76°58.151 075°04.386 545 108 A35 29-4-98 0137 76°58.195 075°04.254 544 109 A34 29-4-98 0359 77°00.400 075°37.657 510 110 A33 29-4-98 0626 77°00.309 076°13.444 213 111 A32 29-4-98 0920 76°58.714 076°48.312 184 112 A31 30-4-98 2356 76°59.498 077°09.241 304 113 A45 30-4-98 0944 76°20.482 077°04.021 295 114 A46 30-4-98 1206 76°19.960 076°30.928 168 115 A47 30-4-98 1809 76°19.790 075°52.374 324 116 A48 30-4-98 2127 76°18.326 075°17.076 399 117 A49 01-4-98 0045 76°16.594 074°39.801 455 119 A96 01-5-98 0756 76°26.801 074°47.333 524 120 A97 01-5-98 1002 76°39.191 074°59.042 447 121 A97 01-5-98 1233 76°37.435 074°59.061 472 122 A98 01-5-98 1642 76°48.606 075°00.106 475 123 A35 01-5-98 2020 76°58.971 075°03.748 547 124 A35 01-5-98 2327 76°56.634 075°05.665 547 126 A36 02-5-98 0352 77°00.621 074°21.767 583 127 A37 02-5-98 0655 77°00.398 074°46.131 313 128 A38 02-5-98 1001 76°59.897 074°13.099 325 129 A38 02-5-98 1144 76°59.730 073°13.521 307 130 A39 02-5-98 1317 76°59.808 072°49.357 382 131 A40 02-5-98 1756 76°59.361 072°30.642 495 132 A40 02-5-98 2150 76°58.851 072°30.055 510 133 A40 02-5-98 2333 76°58.147 072°29.326 510 134 A40 03-5-98 0208 76°57.294 072°28.304 520 136 A54 03-5-98 2318 76°18.927 071°50.768 600 137 A54 04-5-98 0415 76°20.113 071°54.849 600 139 A53 04-5-98 0741 76°18.016 072°22.574 549 140 A52 04-5-98 0917 76°18.212 073°06.330 620 141 A51 04-5-98 1230 76°15.733 073°36.128 500 142 A50 04-5-98 1415 76°16.981 074°07.863 452
Cast Number Station / mooring Start Date UTC Start Time UTC Start Latitude (N) Start Longitude (W) Sounder depth (m)
LEG 2
143 B100 7-5-98 1242 76°37.953 077°00.591 227 144 B100 7-5-98 1433 76°37.805 077°00.473 226 145 B102 7-5-98 1955 76°36.039 076°29.283 112 146 B102 7-5-98 2332 76°36.161 076°29.565 112 147 B102 8-5-98 0104 76°36.099 076°29.993 109 148 B102 8-5-98 0312 76°35.782 076°30.866 107 149 B104 8-5-98 0812 76°23.077 076°42.721 200 150 B103 8-5-98 1014 76°27.651 075°35.892 313 151 B101 8-5-98 1321 76°45.102 075°49.316 361 152 B2 9-5-98 0204 78°23.716 074°42.391 408 153 B2 9-5-98 0914 78°20.167 074°50.542 273 154 B2 9-5-98 1839 78°17.592 074°51.840 610 155 B2 9-5-98 2151 78°15.512 074°53.943 600 156 B2 10-5-98 0217 78°16.595 074°50.244 600 158 B9 11-5-98 1638 78°59.589 072°19.352 246 159 B9 11-5-98 1940 78°58.066 072°24.661 259 160 B8 11-5-98 2103 78°59.727 072°44.106 292 161 B7 11-5-98 2215 78°59.711 073°17.168 247 162 B7 12-5-98 0205 79°00.096 073°16.885 252 163 B7 12-5-98 0341 78°59.440 073°19.964 251 164 B7 12-5-98 1121 78°59.652 073°17.060 250 165 B2 12-5-98 2351 78°18.643 074°44.087 600? 166 B2 13-5-98 0412 78°20.609 074°42.029 600 167 B3 13-5-98 0552 78°20.322 074°17.351 500 168 B4 13-5-98 0725 78°20.554 073°56.578 610 169 B4 13-5-98 0909 78°19.562 074°00.515 603 170 B4 13-5-98 1522 78°20.114 073°59.589 587 171 B13 13-5-98 2250 77°49.761 076°01.145 600 172 B14 14-5-98 0033 77°49.490 075°26.924 614 173 B14 14-5-98 0241 77°49.377 075°28.096 604 174 B14 14-5-98 0409 77°49.361 075°29.946 593 175 B14 14-5-98 0639 77°48.172 075°38.028 517 176 B14 14-5-98 1023 77°49.458 075°33.388 536 177 B15 14-5-98 2358 77°49.374 074°48.278 697 178 B18 15-5-98 0344 77°49.914 073°09.014 172 179 B18 15-5-98 0456 77°49.998 073°07.791 166 180 B18 15-5-98 0632 77°49.984 073°09.502 166181 B18 15-5-98 0815 77°50.009 073°09.239 173 182 B18 15-5-98 1355 77°49.982 073°09.568 164 183 B17 15-5-98 1807 77°49.658 073°36.713 273 184 B16 15-5-98 2029 77°49.357 074°24.394 667 185 B16 15-5-98 2345 77°49.653 074°25.520 703 186 B24 16-5-98 0309 77°21.462 075°23.999 590 187 B25 16-5-98 0640 77°20.592 074°50.309 678 188 B27 16-5-98 2313 77°20.938 073°46.535 ~400 189 B27 17-5-98 0038 77°20.601 073°47.046 ~400 190 B27 17-5-98 0214 77°20.472 073°47.520 ~400 191 B27 17-5-98 0359 77°21.123 073°48.429 350 192 B27 17-5-98 0818 77°20.884 073°49.286 ~400 193 B26 17-5-98 1245 77°20.962 074°16.793 714? 194 B25 17-5-98 1649 77°21.199 074°51.406 676 195 B24 17-5-98 1840 77°21.036 075°27.393 591 196 B23 17-5-98 2213 77°20.366 076°01.022 543 197 B23 18-5-98 0025 77°20.795 075°57.709 538 198 B22 18-5-98 0342 77°23.317 076°15.694 419 199 B22 18-5-98 0603 77°24.290 076°13.732 438 200 B22 18-5-98 1024 77°25.806 076°10.992 461 201 B22 18-5-98 1401 77°26.182 076°07.980 479 202 B34 19-5-98 2217 76°59.938 075°33.228 517 203 B34 20-5-98 0218 76°56.716 075°28.005 508 204 B34 20-5-98 0355 76°55.516 075°28.910 500 205 B34 20-5-98 0558 76°55.384 075°28.884 494 206 B34 20-5-98 0956 76°54.505 075°30.974 494 207 B31 23-5-98 0022 77°02.024 077°02.905 288 208 B31 23-5-98 0209 77°00.996 076°59.068 175 209 B31 23-5-98 0334 77°02.042 077°02.634 295 210 B31 23-5-98 0552 77°01.588 077°01.346 236 211 B31 23-5-98 0918 77°01.951 076°57.135 177 212 B31 23-5-98 1112 77°03.385 076°55.993 195 213 B40 24-5-98 1652 76°59.914 072°24.490 591 214 B40 24-5-98 2048 76°59.669 072°25.873 561 215 B40 24-5-98 2217 76°59.958 072°25.303 575 216 B40 25-5-98 0054 77°00.377 072°26.559 540 217 B40 25-5-98 0218 77°00.279 072°26.079 548 218 B40 25-5-98 0537 77°00.526 072°26.676 535 219 B39 25-5-98 0936 77°00.249 072°48.041 412 220 B38 25-5-98 1102 77°00.120 073°12.260 336 221 B38 25-5-98 1251 76°59.996 073°10.170 336 222 B37 25-5-98 1540 76°59.099 073°43.033 291 223 B36 25-5-98 1731 76°59.179 074°24.978 574 224 B54 26-5-98 0125 76°18.562 071°59.100 582
225 B54 26-5-98 0311 76°17.720 071°54.711 586 226 B54 26-5-98 0538 76°17.449 071°53.257 586 227 B54 26-5-98 1006 76°16.049 071°51.873 565 228 B54 26-5-98 1346 76°16.831 071°51.754 576 229 B54 26-5-98 1528 76°16.711 071°50.619 579 230 B53 26-5-98 1910 76°17.124 072°27.714 560 231 B52 26-5-98 2043 76°16.810 073°01.562 562 232 B52 26-5-98 2257 76°16.898 073°02.800 563 233 B51 27-5-98 0105 76°16.116 073°35.695 512 234 B50 27-5-98 0300 76°15.032 074°10.291 457 235 B50 27-5-98 0729 76°15.032 074°10.068 759 236 B49 27-5-98 2015 76°16.719 074°46.977 481 237 B49 27-5-98 2158 76°16.860 074°45.670 472 238 B48 27-5-98 2332 76°17.675 075°20.079 387 239 B47 28-5-98 0114 76°18.999 075°58.320 331 240 B47 28-5-98 0450 76°18.656 075°56.004 351 241 B46 28-5-98 0719 76°19.279 076°33.421 201 242 B44 28-5-98 0931 76°22.467 077°20.729 364 243 B44 28-5-98 1617 76°22.745 077°15.711 339 244 B44 28-5-98 1841 76°21.517 077°10.073 316 245 B44 28-5-98 2008 76°20.947 077°06.627 309 246 B44 28-5-98 2226 76°20.321 077°07.608 335 247 B44 29-5-98 0027 76°19.200 077°08.940 387 248 B44 29-5-98 0207 76°20.233 077°10.878 378 249 B45 29-5-98 0358 76°20.694 077°02.322 296 250 B30 29-5-98 0821 77°00.666 077°27.116 172 251 B31 29-5-98 0931 76°59.860 077°11.098 277 252 B32 29-5-98 1211 77°00.034 076°47.750 189 253 B33 29-5-98 1734 76°59.550 076°11.077 207 254 B33 29-5-98 1928 76°58.732 076°09.920 220 255 B34 29-5-98 2100 76°59.905 075°34.070 513 256 B35 29-5-98 2218 76°59.604 075°03.381 550 257 B105 30-5-98 0313 77°31.032 076°14.046 485 258 B106 30-5-98 0644 77°40.487 075°50.321 684 259 B107 30-5-98 1127 78°06.074 075°06.324 619 260 C.H. 30-5-98 2318 78°30.828 074°10.608 368 261 B108 31-5-98 1523 75°26.168 076°00.894 397 262 B109 31-5-98 1825 75°17.737 075°58.033 404 263 B110 31-5-98 2215 75°10.439 075°54.353 421
Cast Number Station / mooring Start Date UTC Start Time UTC Start Latitude (N) Start Longitude (W) Sounder depth (m)
LEG 3
264 C68 4-6-98 1620 75°12.718 074°57.403 487 265 C68 4-6-98 1849 75°12.512 074°56.841 493 266 C54 5-6-98 0554 76°17.230 071°54.485 578 267 C54 5-6-98 0836 76°18.685 071°55.919 591 268 C49 5-6-98 1915 76°17.049 074°45.391 474 269 C49 5-6-98 2221 76°17.386 074°46.301 473 270 C49 6-6-98 0212 76°16.586 074°45.320 475 271 C49 6-6-98 0332 76°17.134 074°45.763 472 272 C49 6-6-98 1004 76°17.257 074°43.230 460 273 C2 7-6-98 0836 78°20.779 074°44.576 410 274 C2 7-6-98 1535 78°20.516 074°41.265 612 275 C2 7-6-98 2031 78°19.984 074°39.375 610 276 C2 8-6-98 0040 78°21.965 074°37.135 581 277 C2 8-6-98 0349 78°20.733 074°41.094 614 278 C3 8-6-98 1157 78°21.028 074°19.967 497 279 C4 8-6-98 1311 78°20.950 073°54.314 568 280 C4 8-6-98 1527 78°20.709 073°51.449 541 281 C9 8-6-98 2139 78°59.785 072°17.143 251 282 C9 9-6-98 0011 79°01.417 072°12.453 211 283 C8 9-6-98 0152 79°00.042 072°43.899 288 284 C7 9-6-98 0310 79°00.177 073°20.606 253 285 C7 9-6-98 0443 78°59.650 073°21.282 253 286 C7 9-6-98 0621 79°00.159 073°17.506 247 287 C7 9-6-98 0909 79°00.634 073°14.322 240 288 CP 9-6-98 1753 78°35.106 074°25.520 225 289 C14 10-6-98 0538 77°50.196 075°33.017 542 291 C14 10-6-98 0815 77°49.885 075°33.114 536 292 C14 10-6-98 1122 77°49.680 075°33.936 524 293 C14 10-6-98 1246 77°49.723 075°32.946 542 294 C13 10-6-98 1855 77°49.844 076°01.273 562 295 C15 11-6-98 0111 77°49.645 074°54.251 690 296 C15A 11-6-98 0230 77°49.931 074°36.362 705 297 C16 11-6-98 0418 77°50.248 074°24.637 708 298 C16 11-6-98 0827 77°49.386 074°24.806 680 299 C17 11-6-98 1159 77°50.031 073°37.111 284 300 C18 11-6-98 1334 77°49.841 073°08.682 190 301 C18 11-6-98 1448 77°50.126 073°09.065 171302 C18 11-6-98 1858 77°49.423 073°08.566 174 303 C18 11-6-98 2311 77°50.050 073°06.497 170 304 C18 12-6-98 0015 77°50.662 073°09.934 179 305 C25 12-6-98 0646 77°20.735 074°55.459 665 306 C25 12-6-98 1011 77°21.377 074°48.651 674 307 C26 12-6-98 1323 77°20.966 074°15.992 728 308 C27 12-6-98 1528 77°20.998 073°47.366 346 309 C27 12-6-98 1743 77°20.967 073°47.623 345 310 C27 12-6-98 2201 77°20.817 073°48.615 362 311 C27 13-6-98 0226 77°20.978 073°47.844 350 312 C27 13-6-98 0337 77°21.100 073°47.998 348 313 C24 13-6-98 0716 77°20.877 075°25.153 592 314 C23 13-6-98 0859 77°20.960 076°00.110 537 315 C23 13-6-98 1110 77°21.774 075°52.164 555 316 C21 13-6-98 1648 77°20.263 076°56.379 433 317 C22 13-6-98 2331 77°20.583 076°34.611 401 318 C22 14-6-98 0102 77°21.093 076°34.054 357 319 C22 14-6-98 0449 77°21.080 076°35.157 344 320 C22 14-6-98 0638 77°20.950 076°33.665 387 321 C30 14-6-98 1215 77°00.198 077°27.098 164 322 C31 14-6-98 1343 77°00.285 077°12.904 239 323 C32 14-6-98 1737 77°00.414 076°48.687 166 324 C33 14-6-98 2057 77°00.358 076°12.833 209 325 C33 14-6-98 2240 76°58.908 076°13.764 199 326 C34 15-6-98 0024 77°00.411 075°36.568 514 328 C31 15-6-98 2015 76°58.141 077°18.216 330 329 C35 16-6-98 1002 76°59.831 075°02.701 559 330 C101 16-6-98 2030 76°44.861 076°10.491 107 331 C102 17-6-98 0025 76°35.607 076°32.998 112 332 C104 17-6-98 0518 76°23.333 076°43.387 201 333 C36 18-6-98 1803 77°00.863 074°25.145 610 334 C36 18-6-98 2032 76°59.453 074°23.315 582 335 C37 18-6-98 2228 77°00.511 073°47.562 320 336 C40 19-6-98 0135 77°00.062 072°25.472 567 337 C40 19-6-98 0330 77°00.604 072°23.375 519 338 C40 19-6-98 0448 77°00.004 072°25.053 570 339 C40 19-6-98 0628 77°00.024 072°26.350 559 340 C40 19-6-98 1022 77°00.607 072°27.029 535 341 C39 19-6-98 1949 77°00.263 072°47.663 413 342 C38 19-6-98 2355 76°59.962 073°17.039 293 343 C38 20-6-98 0119 76°59.810 073°12.968 327 344 C51 20-6-98 0843 76°16.410 073°37.484 507 345 C52 20-6-98 1052 76°17.069 073°03.220 568 346 C52 20-6-98 1350 76°17.052 073°03.313 568
347 C53 20-6-98 1731 76°17.361 072°27.361 562 348 C54 21-6-98 0148 76°20.174 071°49.762 630 349 C54 21-6-98 0610 76°19.667 071°54.138 616 350 C54 21-6-98 1830 76°18.127 071°56.504 580 351 C55 22-6-98 0412 76°17.936 071°24.714 650 352 C56 22-6-98 0545 76°18.356 070°54.513 655 353 C53 22-6-98 1313 76°16.978 072°31.736 467 354 C50 22-6-98 1755 76°16.240 074°07.936 450 355 C50 22-6-98 1933 76°16.309 074°07.599 446 356 C50 22-6-98 2347 76°16.308 074°13.706 450 357 C50 23-6-98 0222 76°15.707 074°13.271 457 358 C50 23-6-98 0341 76°15.895 074°11.521 456 359 C49 23-6-98 0746 76°17.876 074°41.886 461 360 C48 23-6-98 1155 76°18.570 075°20.880 390 361 C46 23-6-98 1352 76°19.882 076°28.165 171 362 C47 23-6-98 1517 76°19.245 075°49.034 346 363 C47 23-6-98 1826 76°19.655 075°54.435 323 364 C45 23-6-98 2038 76°20.186 077°00.188 295 365 C44 24-6-98 0105 76°22.843 077°25.113 385 366 C44 24-6-98 0235 76°22.856 077°25.521 395 367 C44 24-6-98 0356 76°22.289 077°26.459 399 368 C44 24-6-98 0548 76°22.490 077°25.651 400 369 C44 24-6-98 1011 76°22.113 077°24.740 394 370 C43 24-6-98 1742 76°23.622 077°45.005 266 371 C59 25-6-98 0409 75°15.371 079°15.715 407 372 C60 25-6-98 0530 75°15.416 078°55.009 642 373 C60 25-6-98 0756 75°15.158 078°56.001 642 374 C61 25-6-98 1045 75°14.730 078°34.639 550 375 C62 25-6-98 1226 75°15.016 078°12.775 453 376 C64 25-6-98 1730 75°14.567 077°09.372 383 377 C64 25-6-98 1940 75°14.136 077°09.565 382 378 C66 25-6-98 2209 75°15.439 076°04.638 402 379 C68 26-6-98 0019 75°15.479 074°59.658 476 380 C68 26-6-98 0426 75°14.921 075°00.356 480 381 C68 26-6-98 0552 75°15.060 075°02.655 478 382 C70 26-6-98 1017 75°20.519 073°53.565 604 383 C72 26-6-98 1418 75°26.248 072°53.150 607 384 C74 26-6-98 2125 75°30.133 071°48.823 597 385 C76 27-6-98 0132 75°35.271 070°46.538 550 386 C76 27-6-98 0347 75°36.158 070°50.174 547 387 C78 27-6-98 0709 75°39.819 069°42.783 530 388 C80 27-6-98 0955 75°44.770 068°39.898 361 389 C80 27-6-98 1155 75°44.588 068°38.689 353 390 C81 27-6-98 1441 75°46.349 068°17.381 333
391 C82 27-6-98 1706 75°48.208 067°56.476 295 392 C82 27-6-98 2050 75°47.512 067°58.002 298 393 C83 27-6-98 2214 75°48.683 067°40.402 221
Cast Number Station / mooring Start Date UTC Start Time UTC Start Latitude (N) Start Longitude (W) Sounder depth (m)
LEG 4
394 D68 / D1 30-6-98 1803 75°15.236 075°00.650 477 395 D68 / D1 1-7-98 0015 75°14.915 075°00.783 478 396 D68 / D1 1-7-98 0302 75°15.309 074°59.510 477 397 D68 / D1 1-7-98 1225 75°14.589 074°56.634 481 398 D68 / D1 1-7-98 2314 75°14.025 074°57.717 486 399 D50 / S4 3-7-98 0152 76°16.697 074°11.315 453 400 D50 / S4 4-7-98 0006 76°16.462 074°09.227 450 401 D50 / S4 4-7-98 0242 76°17.075 074°09.056 456 402 D50 / S4 4-7-98 1306 76°16.518 074°13.604 448 403 D58 / S1 5-7-98 0233 76°18.978 070°13.393 265 404 D58 / S1 5-7-98 0429 76°18.984 070°13.689 264 405 D58 / S1 5-7-98 0809 76°18.961 070°14.421 255 406 D58 / S1 5-7-98 2233 76°19.356 070°12.357 221 407 D50 / S4 6-7-98 0454 76°16.827 074°09.668 450 408 D44 / S5 7-7-98 0658 76°22.137 077°23.476 370 409 D44 / S5 8-7-98 0206 76°21.344 077°25.932 395 410 D44 / S5 8-7-98 0401 76°20.001 077°22.619 402 411 D44 / S5 9-7-98 0646 76°23.549 077°25.517 368 412 D44 / S5 9-7-98 0804 76°22.955 077°24.515 368 413 D5 / N1 10-7-98 1458 78°20.812 073°37.921 581 414 D5 / N1 11-7-98 0025 78°21.005 073°38.595 565 415 D5 / N1 11-7-98 0309 78°20.749 073°38.933 598 416 D5 / N1 11-7-98 0806 78°20.902 073°39.828 555 417 D3 / N3 11-7-98 1638 78°21.107 074°26.214 530 418 D2 / N2 12-7-98 0207 78°21.499 074°40.610 632 419 D2 / N2 13-7-98 0014 78°22.788 074°35.011 550 420 D2 / N2 13-7-98 0310 78°22.392 074°42.789 313 421 D2 / N2 13-7-98 0906 78°21.678 074°41.170 560 422 D2 / N2 13-7-98 2306 78°21.004 074°43.178 450 423 D2 / N2 14-7-98 1102 78°21.660 074°41.109 559 424 E2 15-7-98 0009 78°01.406 073°14.255 204 425 E2 15-7-98 1546 78°03.168 073°32.419 372 426 E2 16-7-98 0013 78°02.351 073°20.020 276 427 E2 16-7-98 0308 78°03.422 073°18.894 258 428 E2 16-7-98 0551 77°54.372 073°42.735 376 429 D40 / E1 16-7-98 1715 77°00.949 072°31.547 499 430 D40 / E1 17-7-98 0035 77°00.385 072°41.995 454431 D40 / E1 17-7-98 0300 77°00.090 072°44.878 428 432 D40 / E1 17-7-98 0804 77°02.243 072°44.389 478 433 D40 / E1 17-7-98 2037 77°07.246 073°07.138 392 434 D2 18-7-98 0019 76°59.772 074°59.548 562 435 D2 18-7-98 0911 77°00.267 074°59.119 565 436 D2 19-7-98 0031 76°59.793 075°00.315 559 437 D2 19-7-98 0301 77°00.357 074°59.717 569 438 D2 19-7-98 0456 76°57.826 074°49.775 555 439 D54 / S2 20-7-98 0016 76°17.620 071°54.651 582 440 D54 / S2 20-7-98 0606 76°17.012 071°59.555 563 441 D54 / S2 20-7-98 1130 76°17.975 071°52.702 586 442 D54 / S2 20-7-98 1407 76°17.348 071°54.714 579 443 D54 / S2 20-7-98 2348 76°17.444 071°55.020 582 444 D54 / S2 21-7-98 0325 76°17.344 071°52.853 578 445 D54 / S2 21-7-98 0527 76°16.621 071°50.218 577 446 D54 / S2 21-7-98 0732 76°09.650 071°40.838 540
Cast Number Station / mooring Start Date UTC Start Time UTC Start Latitude (N) Start Longitude (W) Sounder depth (m)
LEG 5
1 F65 27-8-99 0325 75°14.6 076°21.9 388 2 F66 27-8-99 0426 75°15.26 076°03.319 412 3 F67 27-8-99 0526 75°16.062 075°45.041 430 4 F67-1 27-8-99 0624 75°16.745 075°26.763 439 5 F67-2 27-8-99 0719 75°17.689 075°08.920 441 6 F68 / D1 27-8-99 0825 75°15.3 074°51.9 472 7 F68 / D1 27-8-99 1200 75°16.2 075°08.5 461 8 F68-1 28-8-99 0302 75°18.6 074°50.1 493 9 F69 28-8-99 0435 75°19.46 074°31.645 523 10 F50 / S4 28-8-99 2045 76°15.8 074°16.4 465 11 F50 / S4 29-8-99 0947 76°17.2 074°12.3 459 12 F50 / S4 29-8-99 1050 76°17.5 074°18.9 462 13 F50 / S4 29-8-99 1430 76°16.42 074°22.75 464 14 F44 / S5 30-8-99 0700 76°24.445 077°26.315 347 15 F44 / S4 30-8-99 1135 76°24.48 077°25.72 337 16 F2 / N2 01-9-99 0922 76°57.57 074°59.14 550 17 F2 / N2 01-9-99 1345 76°57.50 074°58.8 542 18 E2 02-9-99 2105 78°02.48 073°19.23 269 19 E2 03-9-99 0605 78°02.64 073°18.72 287 20 E2 03-9-99 0820 78°02.63 073°19.75 294 21 E2 03-9-99 0845 78°02.54 073°21.30 294 22 F3 / N3 04-9-99 1010 78°20.93 074°20.57 503 23 F3 / N3 04-9-99 1205 78°18.25 074°27.31 561 24 F40 / E1 06-9-99 0604 76°59.625 072°27.306 546 25 F40 / E1 06-9-99 0840 76°59.93 072°26.89 558 26 F54 / S2 07-9-99 0815 76°17.54 071°54.46 590 27 F54 / S2 07-9-99 1016 76°17.33 071°54.66 589 28 F54 / S2 07-9-99 2023 76°17.47 071°54.94 592 29 F58 / S1 08-9-99 0705 76°18.312 070°13.444 290 30 F58 / S1 08-9-99 0915 76°18.32 070°14.2 288 31 F50 / S4 09-9-99 2115 76°16.27 074°10.72 457 32 F50 / S4 10-9-99 0705 76°16.13 074°09.33 454 33 F50 / S4 10-9-99 1005 76°15.40 074°08.90 457 34 F2 / N2 11-9-99 0715 78°20.976 074°42.700 528 35 F2 / N2 11-9-99 1010 78°21.94 074°42.51 458 36 F3 / N3 12-9-99 1707 78°19.197 074°30.096 579 37 F4 12-9-99 2317 78°22.42 073°49.22 57638 F5 13-9-99 0305 78°20.86 073°43.20 569 39 F6 13-9-99 0705 78°20.182 073°20.316 467 40 F6 13-9-99 0910 78°19.52 073°23.48 560 41 F43 17-9-99 1515 76°22.33 077°49.10 210 42 F44 17-9-99 2205 76°24.77 077°49.71 380 43 F45 18-9-99 1005 76°21.12 077°02.98 304 44 F45 18-9-99 1045 76°21.12 077°02.87 304 45 F45 18-9-99 1225 76°20.94 077°05.55 314 46 F46 18-9-99 1455 76°18.40 076°34.26 215 47 F47 18-09-99 1740 76°18.794 075°54.855 342 48 F48 18-09-99 2130 76°16.97 075°02.04 446 49 F50 19-09-99 0104 76°16.809 074°23.22 465 50 F51 19-09-99 0305 76°16.30 073°37.32 512 51 F52 19-09-99 0700 76°16.884 073°02.416 570 52 F53 19-09-99 0900 76°17.16 072°27.72 570 53 F54 19-09-99 1105 76°17.52 071°55.46 589 54 F54 19-09-99 1345 76°17.41 071°55.78 585 55 F55 19-09-99 2136 76°17.84 071°24.94 670 56 F56 19-09-99 2311 76°18.21 070°54.64 662 57 F57 20-09-99 0255 76°18.41 070°33.89 204 58 F58 20-09-99 0610 76°18.139 070°13.80 287 59 F42 20-09-99 1742 77°00.93 071°37.836 985 60 F41 20-09-99 2046 77°00.09 072°00.42 1050 61 F40 21-09-99 0600 76°59.057 072°28.205 539 62 F40 21-09-99 0725 76°58.602 072°28.494 542 63 F40 21-09-99 0930 76°58.52 072°28.17 548 64 F39 21-09-99 1240 76°59.98 072°47.99 413 65 F38 21-09-99 1405 77°00.12 073°12.87 343 66 F37 21-09-99 2348 77°00.19 073°48.39 335 67 F36 22-09-99 0315 76°59.08 074°27.81 583 68 F35 22-09-99 0810 76°58.66 075°03.46 552 69 F34 22-09-99 1035 77°00.11 075°40.02 513 70 F33 22-09-99 1420 77°00.30 076°09.80 227 71 F32 22-09-99 1729 77°00.356 076°45.754 197 72 F32 22-09-99 1949 77°00.007 076°46.293 203 73 F31 23-09-99 0830 77°00.23 077°10.69 283 74 F31 23-09-99 1132 77°00.66 077°13.27 230 75 F18 24-09-99 1158 77°50.02 073°09.26 180 76 F18 24-09-99 1410 77°48.76 073°09.18 178 77 F19 24-09-99 2226 77°50.11 072°41.17 75 78 F20 25-09-99 0350 77°50.09 072°14.99 40 79 F17 25-09-99 0705 77°50.473 073°34.887 277 80 F16 25-09-99 0925 77°50.48 074°15.09 625 81 F15 25-09-99 1405 77°48.53 074°54.17 705
82 F14 25-09-99 1931 77°48.137 075°29.912 609 83 F14 26-09-99 0104 77°47.48 075°21.25 645 84 F62 29-09-99 2033 75°14.98 078°13.23 458 85 F64 30-09-99 0024 75°15.31 077°07.76 395 86 F66 30-09-99 0935 75°14.97 076°03.62 405 87 F66 30-09-99 1139 75°14.78 076°03.67 404 88 F68 30-09-99 1428 75°15.33 074°59.13 486 89 F68-1 30-09-99 1515 75°15.98 074°48.45 494 90 F68-2 30-09-99 1617 75°17.141 074°36.714 525 91 F69 30-09-99 1719 75°17.832 074°26.322 550 92 F69-1 30-09-99 1810 75°18.608 074°14.796 576 93 F69-2 30-09-99 1903 75°19.373 074°04.533 600 94 F70 30-09-99 1957 75°20.090 073°54.00 609 95 F72 01-10-99 0002 75°25.03 072°51.71 635 96 F74 01-10-99 0202 75°29.96 071°49.31 608 97 F76 01-10-99 1120 75°34.87 070°45.87 552 98 F76 01-10-99 1300 75°35.27 070°47.48 560 99 F78 01-10-99 1530 75°39.90 069°42.78 534 100 F80 01-10-99 1732 75°44.9 068°42.1 383 101 F82 01-10-99 1934 75°48.161 067°57.182 307 102 F201 02-10-99 1910 72°37.827 075°47.500 570 103 F202 03-10-99 1740 72°07.941 067°11.667 2365 104 F203 05-10-99 0020 67°19.89 061°29.51 183 105 F204 05-10-99 1410 64°09.96 062°54.980 138
Appendix II.4 : Casts positions for Leg 3 (June 1998). 79
r
78.5 78 77.5 77 76.5 Leg 3 . . . + . . • * 285.
.,.
."
293 300..
.
..
'..
.• 314 307 • * ... 329 343 ~..
..
.
.
.'.
:..
.
,
... • • .. (3~O' 357..
364 76~
75.5 ~385 378....
•••
, • 392 '264V~~3~7~1,-~~~~~~~~~~~~~~~~
75 -80+
-78 -76 -74 -72 -70 -68 -66Appendix II.5 : Casts positions for Leg 4 (July 1998). 79
r
78.5 78 77.5 77 76.5 \412..
76~
75.5 Leg 4 P. • 418 436'.
".
. 424••
430 ~..
..
"400 394•
~442 C)<5
• 40675t:~~~~-'~~~~~_7~2~~_7~0~~_~6;8~-:_6~6
-80 -78 -76 -74Appendix III : Salinity and potential temperature sections for Leg 0, August 1997.
The same color scale is used for all sections. Canada is on the left and Greenland is on the right.
Appendix III.1: Salinity and potential temperature along Section 1 of Leg 0 (August 1997). Canada is on the left and Greenland is on the right.
30 30.5 31 31.5 32 32.5 33 33.5 34 34.5 Leg 0 Section 1 Distance (km) W-E De p th ( m ) 31 31.5 31.5 32 32 32.5 32.5 32.5 33 33 33 33.5 33.5 33.5 33.7 33.7 33.7 33.9 33.9 33.9 34.1 34.1 34.1 Salinity 0 2 4 6 8 10 12 -700 -600 -500 -400 -300 -200 -100 0 -1 0 1 2 3 4 Leg 0 Section 1 Distance (km) W-E De p th ( m ) -1.2 -1.2 -1.2 -1.2 -1.2 -1 -1 -1 -1 -1 -1 -1 -1 -1 -1 -0.7 -0.7 -0.7 -0.7 -0.7 -0.5 -0.5 -0.5 -0.2 -0.2 θ (°C) 0 2 4 6 8 10 12 -700 -600 -500 -400 -300 -200 -100 0
Appendix III.2 : Salinity and potential temperature along Section 2 of Leg 0 (August 1997). Canada is on the left and Greenland is on the right.
30 30.5 31 31.5 32 32.5 33 33.5 34 34.5 Leg 0 Section 2 Distance (km) W-E De p th ( m ) 31.5 31.5 31.5 32 32.5 32.5 32.5 33 33 33 33.5 33.5 33.5 33.7 33.7 33.7 33.9 33.9 33.9 34 .1 34.1 Salinity 0 5 10 15 20 25 -700 -600 -500 -400 -300 -200 -100 0 -1 0 1 2 3 4 Leg 0 Section 2 Distance (km) W-E De p th ( m ) -1 -1 -1 -1 -1 -1 -1 -1 -1 -0.5 -0.5 -0.5 -0.5 -0.5 -0.5 -0.5 -0.5 0 0 0.4 θ (°C) 0 5 10 15 20 25 -700 -600 -500 -400 -300 -200 -100 0
Appendix III.3 : Salinity and potential temperature along Section 3 of Leg 0 (August 1997). Canada is on the left and Greenland is on the right.
30 30.5 31 31.5 32 32.5 33 33.5 34 34.5 Leg 0 Section 3 Distance (km) W-E De p th ( m ) 31.5 32 32 32 32.5 32.5 32.5 33 33 33 33.5 33.5 33.5 33.7 33.7 33.7 33.9 33.9 33.9 34.1 34.1 34.1 34.1 Salinity 0 10 20 30 40 -700 -600 -500 -400 -300 -200 -100 0 -1 0 1 2 3 4 Leg 0 Section 3 Distance (km) W-E De p th ( m ) -1.2 -1.2 -1.2 -1.2 -1.2 -1.2 -1.2 -1.2 -0.9 -0.9 -0.9 -0.9 -0.9 -0.9 -0.6 -0.6 -0.6 -0.6 -0.6 -0 .3 -0.3 -0.3 -0.3 θ (°C) 0 10 20 30 40 -700 -600 -500 -400 -300 -200 -100 0
Appendix III.4 : Salinity and potential temperature along Section 5 of Leg 0 (August 1997). Canada is on the left and Greenland is on the right.
30 30.5 31 31.5 32 32.5 33 33.5 34 34.5 Leg 0 Section 5 Distance (km) W-E De p th ( m ) 31 31.5 32 32 32.5 32.5 32.5 33 33 33 33.5 33.5 33.5 33.7 33.7 33.7 33 .9 33.9 33.9 34.1 34.1 34 .1 34 .3 34 .3 Salinity 0 20 40 60 80 100 -700 -600 -500 -400 -300 -200 -100 0 -1 0 1 2 3 4 Leg 0 Section 5 Distance (km) W-E De p th ( m ) -1.1 -1.1 -1.1 -1.1 -1.1 -1.1 -0.6 -0.6 -0.6 -0.6 -0.6 -0.6 -0.1 -0.1 -0.1 -0 .1 -0.1 -0.1 -0.1 0.3 0.8 0.3 1.3 1.3 θ (°C) 0 20 40 60 80 100 -700 -600 -500 -400 -300 -200 -100 0
Appendix IV : Salinity and potential temperature sections; Leg 1, April 1998
The same color scale is used for all sections. Canada is on the left and Greenland is on the right
Appendix IV.1 :Salinity and potential temperature along Section 0 of Leg 1 (April 1998). Canada is on the left and Greenland is on the right.
-1 0 1 2 3 4 Leg 1 Section 0 Distance (km) W-E De p th ( m ) -1.5 -1.5 -1.2 -1.2 -1.2 -0.8 -0.8 -0.8 -0.5 -0.5 θ (°C) 0 5 10 15 20 25 -700 -600 -500 -400 -300 -200 -100 0 30 30.5 31 31.5 32 32.5 33 33.5 34 34.5 Leg 1 Section 0 Distance (km) W-E De p th ( m ) 33 33 33.5 33.5 33.5 33.7 33.7 33.7 33.9 33.9 33.9 34 .1 34.1 34.3 34.3 34.5 Salinity 0 5 10 15 20 25 -700 -600 -500 -400 -300 -200 -100 0
Appendix IV.2 : Salinity and potential temperature along Section 1 of Leg 1 (April 1998). Canada is on the left and Greenland is on the right.
30 30.5 31 31.5 32 32.5 33 33.5 34 34.5 Leg 1 Section 1 Distance (km) W-E De p th ( m ) 33 33 33 33.2 33.2 33.2 33.4 33.4 33.4 33.6 33.6 33.6 33.8 33.8 33.8 34 34 34 34.2 34.2 34.2 Salinity 0 2 4 6 8 10 -700 -600 -500 -400 -300 -200 -100 0 -1 0 1 2 3 4 Leg 1 Section 1 Distance (km) W-E De p th ( m ) -1.6 -1.6 -1.6 -1.6 -1.6 -1.6 -1.6 -1.3 -1.3 -1.3 -1.1 -1.1 -1.1 -0.9 -0.9 -0.9 -0.6 -0.6 -0.6 -0.6 θ (°C) 0 2 4 6 8 10 -700 -600 -500 -400 -300 -200 -100 0
Appendix IV.3 : Salinity and potential temperature along Section 2 of Leg 1 (April 1998). Canada is on the left and Greenland is on the right.
30 30.5 31 31.5 32 32.5 33 33.5 34 34.5 Leg 1 Section 2 Distance (km) W-E De p th ( m ) 33 33 33 33 33. 2 33.2 33.2 33.4 33.4 33.6 33.6 33.6 33.8 33.8 33.8 34 34 34.2 34.2 Salinity 0 5 10 15 20 25 30 35 -700 -600 -500 -400 -300 -200 -100 0 -1 0 1 2 3 4 Leg 1 Section 2 Distance (km) W-E De p th ( m ) -1.6 -1.6 -1.6 -1.6-1.6 -1.2 -1.2 -1.2 -0.9 -0.9 -0.9 -0.6 -0.6 -0.6 -0.6 θ (°C) 0 5 10 15 20 25 30 35 -700 -600 -500 -400 -300 -200 -100 0
Appendix IV.4 : Salinity and potential temperature along Section 3 of Leg 1 (April 1998). Canada is on the left and Greenland is on the right.
30 30.5 31 31.5 32 32.5 33 33.5 34 34.5 Leg 1 Section 3 Distance (km) W-E De p th ( m ) 32.8 33 33.2 33.2 33.4 33.4 33.6 33.6 33.6 33.8 33.8 33.8 34 34 34 34 34.2 34.2 34.2 Salinity 0 10 20 30 40 -700 -600 -500 -400 -300 -200 -100 0 -1 0 1 2 3 4 Leg 1 Section 3 Distance (km) W-E De p th ( m ) -1.4 -1 .4 -1.4 -1.4 -1 -1 -1 -0.5 -0.5 -0 .5 -0.5 -0 .5 -0.5 -0.5 -0 .1 -0 .1 -0 .1 -0.1 θ (°C) 0 10 20 30 40 -700 -600 -500 -400 -300 -200 -100 0
Appendix IV.5 : Salinity and potential temperature along Section 4 of Leg 1 (April 1998). Canada is on the left and Greenland is on the right.
30 30.5 31 31.5 32 32.5 33 33.5 34 34.5 Leg 1 Section 4 Distance (km) W-E De p th ( m ) 33 33 33 .2 33.2 33.2 33.4 33.4 33.4 33.4 33.6 33.6 33.6 33.8 33.8 33.8 34 34 34 34.2 34.2 Salinity 0 10 20 30 40 50 60 70 -700 -600 -500 -400 -300 -200 -100 0 -1 0 1 2 3 4 Leg 1 Section 4 Distance (km) W-E De p th ( m ) -1.4 -1.4 -1 .4 -0.9 -0.9 -0.9 -0.5 -0.5 -0.5 -0.5 -0.5 0 0 θ (°C) 0 10 20 30 40 50 60 70 -700 -600 -500 -400 -300 -200 -100 0
Appendix IV.6 : Salinity and potential temperature along Section 5 of Leg 1 (April 1998). Canada is on the left and Greenland is on the right.
30 30.5 31 31.5 32 32.5 33 33.5 34 34.5 Leg 1 Section 5 Distance (km) W-E De p th ( m ) 33 .233.2 33.4 33.4 33.4 33.6 33.6 33.6 33.6 33.8 33.8 33.8 34 34 34 34.2 34.2 34 .4 Salinity 0 20 40 60 80 -700 -600 -500 -400 -300 -200 -100 0 -1 0 1 2 3 4 Leg 1 Section 5 Distance (km) W-E De p th ( m ) -1.4 -1.4 -1 .4 -1.4 -0.9 -0.9 -0.9 -0.9 -0.5 -0.5 -0.5 0 0 0 0 0 0 0 .8 θ (°C) 0 20 40 60 80 -700 -600 -500 -400 -300 -200 -100 0
Appendix V.1 : Salinity and potential temperature along Section 0 of Leg 2 (May 1998). Canada is on the left and Greenland is on the right.
30 30.5 31 31.5 32 32.5 33 33.5 34 34.5 Leg 2 Section 0 Distance (km) W-E De p th ( m ) 32.5 32.5 33 33 33 33.5 33.5 33.5 33.7 33.7 33.7 33.9 33.9 33.9 34 .1 34.1 34.3 Salinity 0 2 4 6 8 10 12 -700 -600 -500 -400 -300 -200 -100 0 -1 0 1 2 3 4 Leg 2 Section 0 Distance (km) W-E De p th ( m ) -1.5 -1.5 -1.5 -1.5 -1.3 -1.3 -1.3 -1.1 -1.1 -1.1 -0.8 -0.8 -0. 8 -0.6 -0.6 θ (°C) 0 2 4 6 8 10 12 -700 -600 -500 -400 -300 -200 -100 0
Appendix V.2 : Salinity and potential temperature along Section 1 of Leg 2 (May 1998). Canada is on the left and Greenland is on the right.
30 30.5 31 31.5 32 32.5 33 33.5 34 34.5 Leg 2 Section 1 Distance (km) W-E De p th ( m ) 32.6 32.8 32.8 32.8 33 33 33 33.2 33.2 33.2 33.4 33.4 33.4 33.6 33.6 33.6 33.8 33.8 33.8 34 34 34 34.2 34.2 34.2 Salinity 0 2 4 6 8 10 12 -700 -600 -500 -400 -300 -200 -100 0 -1 0 1 2 3 4 Leg 2 Section 1 Distance (km) W-E De p th ( m ) -1.6 -1.6 -1.6 -1.5 -1.5 -1.4 -1.4 -1.2 -1.1 -1.1 -1.1 -1 -1 -1 -0.9 -0.9 -0.9 -0.7 -0.7 -0.7 -0.7 -0.6 -0.6 -0.6 -0.5 -0.5 -0.5 θ (°C) 0 2 4 6 8 10 12 -700 -600 -500 -400 -300 -200 -100 0
Appendix V.3 : Salinity and potential temperature along Section 2 of Leg 2 (May 1998). Canada is on the left and Greenland is on the right.
30 30.5 31 31.5 32 32.5 33 33.5 34 34.5 Leg 2 Section 2 Distance (km) W-E De p th ( m ) 32.8 33 33 33.2 33.2 33.4 33.4 33.4 33.6 33.6 33.6 33.8 33.8 33.8 34 34 34.2 34.2 Salinity 0 10 20 30 40 -700 -600 -500 -400 -300 -200 -100 0 -1 0 1 2 3 4 Leg 2 Section 2 Distance (km) W-E De p th ( m ) -1.5 -1.5 -1.5 -1.5 -1.5 -1.3 -1.3 -1.3 -1.1 -1.1 -1.1 -0.8 -0.8 -0.8 -0.6 -0.6 -0.6 -0.6 θ (°C) 0 10 20 30 40 -700 -600 -500 -400 -300 -200 -100 0
Appendix V.4 : Salinity and potential temperature along Section 3 of Leg 2 (May 1998). Canada is on the left and Greenland is on the right.
-1 0 1 2 3 4 Leg 2 Section 3 Distance (km) W-E De p th ( m ) -1.4 -1.4 -1.4 -1.4 -1 -1 -1 -1 -0.6 -0.6 -0.6 -0.6 -0.3 -0.3 -0.3 θ (°C) 0 5 10 15 20 25 30 -700 -600 -500 -400 -300 -200 -100 0 30 30.5 31 31.5 32 32.5 33 33.5 34 34.5 Leg 2 Section 3 Distance (km) W-E De p th ( m ) 33 33 3 3 33.2 33.2 33.2 33.4 33.4 33.4 33.6 33.6 33.6 33.8 33.8 33.8 34 34 34 34.2 34.2 34.2 34.4 Salinity 0 5 10 15 20 25 30 -700 -600 -500 -400 -300 -200 -100 0
Appendix V.5 : Salinity and potential temperature along Section 4 of Leg 2 (May 1998). Canada is on the left and Greenland is on the right.
30 30.5 31 31.5 32 32.5 33 33.5 34 34.5 Leg 2 Section 4 Distance (km) W-E De p th ( m ) 33 33 33 33.2 33.2 33.2 33.4 33.4 33.4 33.4 33.6 33.6 33.6 33.8 33.8 33.8 34 34 34 34.2 34.2 34.2 34.2 Salinity 0 10 20 30 40 50 60 70 -700 -600 -500 -400 -300 -200 -100 0 -1 0 1 2 3 4 Leg 2 Section 4 Distance (km) W-E De p th ( m ) -1.4 -1.4 -1.4 -1.4 -1.4 -0.9 -0.9 -0.9 -0.9 -0 .5 -0 .5 -0.5 0 0 0 0 0 0 θ (°C) 0 10 20 30 40 50 60 70 -700 -600 -500 -400 -300 -200 -100 0
Appendix V.6 :Salinity and potential temperature along Section 5 of Leg 2 (May 1998). Canada is on the left and Greenland is on the right.
30 30.5 31 31.5 32 32.5 33 33.5 34 34.5 Leg 2 Section 5 Distance (km) W-E De p th ( m ) 33.2 33.2 33.4 33.4 33.4 33.6 33.6 33.6 33.8 33.8 33.8 34 34 34 34.2 34.2 Salinity 0 20 40 60 80 -700 -600 -500 -400 -300 -200 -100 0 -1 0 1 2 3 4 Leg 2 Section 5 Distance (km) W-E De p th ( m ) -1.4 -1.4 -1.4 -1.4 -1.4 -1.4 -1 -1 -1 -1 -1 -0.6 -0.6 -0.6 -0.2 -0.2 -0.2 -0.2 -0.2 -0.2 -0.2 -0.2 -0.2 -0 .2 -0.2 0.2 0.6 θ (°C) 0 20 40 60 80 -700 -600 -500 -400 -300 -200 -100 0
Appendix VI : Salinity and potential temperature; Leg 3, June 1998
The same color scale is used for all sections. Canada is on the left and Greenland is on the right
Appendix VI.1 : Salinity and potential temperature along Section 0 of Leg 3 (June 1998). Canada is on the left and Greenland is on the right.
30 30.5 31 31.5 32 32.5 33 33.5 34 34.5 Leg 3 Section 0 Distance (km) W-E De p th ( m ) 32.5 33 33 33 33.5 33.5 33.5 33.7 33.7 33.7 33.9 33.9 33.9 34 .1 34.1 34.3 Salinity 0 5 10 15 -700 -600 -500 -400 -300 -200 -100 0 -1 0 1 2 3 4 Leg 3 Section 0 Distance (km) W-E De p th ( m ) -1.3 -1.3 -1.3 -1.3 -1.3 -1.3 -1.3 -0.9 -0.9 -0.9 -0.9 -0.9 -0.9 -0.9 -0 .5 -0.5 -0.5 -0.20.6 θ (°C) 0 5 10 15 -700 -600 -500 -400 -300 -200 -100 0
Appendix VI.2 Salinity and potential temperature along Section 1 of Leg 3 (June 1998). Canada is on the left and Greenland is on the right.
30 30.5 31 31.5 32 32.5 33 33.5 34 34.5 Leg 3 Section 1 Distance (km) W-E De p th ( m ) 32.6 32.8 32.8 32.8 33 33 33 33.2 33.2 33.2 33.4 33.4 33.4 33.6 33.6 33.6 33.8 33.8 33.8 34 34 34 34.2 34.2 34.2 Salinity 0 2 4 6 8 10 -700 -600 -500 -400 -300 -200 -100 0 -1 0 1 2 3 4 Leg 3 Section 1 Distance (km) W-E De p th ( m ) -1.3 -1. 3 -1.3 -1.3 -1.1 -1.1 -1.1 -1.1 -1.1 -1.1 -1.1 -1.1 -1.1 -0.9 -0.9 -0.9 -0.9 -0.9 -0.7 -0.7 -0.7 -0.5 -0.5 -0.5 θ (°C) 0 2 4 6 8 10 -700 -600 -500 -400 -300 -200 -100 0
Appendix VI.3 :Salinity and potential temperature along Section 2 of Leg 3 (June 1998). Canada is on the left and Greenland is on the right.
30 30.5 31 31.5 32 32.5 33 33.5 34 34.5 Leg 3 Section 2 Distance (km) W-E De p th ( m ) 32.6 32.6 32.8 32.8 33 33 33 33.2 33.2 33. 2 33.4 33.4 33.4 33.6 33.6 33.6 33.8 33.8 33.8 34 34 34 34.2 34.2 34.2 Salinity 0 10 20 30 40 -700 -600 -500 -400 -300 -200 -100 0 -1 0 1 2 3 4 Leg 3 Section 2 Distance (km) W-E De p th ( m ) -1.3 -1.3 -1.3 -1.3 -1.3 -1.3 -1.3 -0.8 -0.8 -0.8 -0.8 -0.8 -0. 3 -0.3 -0.3 -0.3 0.2 θ (°C) 0 10 20 30 40 -700 -600 -500 -400 -300 -200 -100 0
Appendix VI.4 : Salinity and potential temperature along Section 3 of Leg 3 (June 1998). Canada is on the left and Greenland is on the right.
30 30.5 31 31.5 32 32.5 33 33.5 34 34.5 Leg 3 Section 3 Distance (km) W-E De p th ( m ) 32.6 32.6 32.6 32.8 32.8 32.8 33 33 33 33.2 33.2 33.2 33.4 33.4 33.4 33.6 33.6 33.6 33.8 33.8 33.8 34 34 34 34.2 34.2 34.2 Salinity 0 10 20 30 40 -700 -600 -500 -400 -300 -200 -100 0 -1 0 1 2 3 4 Leg 3 Section 3 Distance (km) W-E De p th ( m ) -1.4 -1.4 -1.4 -1.4 -1.4 -1.4 -1.4 -1.4 -1.1 -1.1 -1.1 -1.1 -1.1 -1. 1 -0.7 -0.7 -0.7 -0.7 -0.7 -0.7 -0 .7 -0.3 -0.3 -0 .3 -0.3 -0.3 -0.3 -0 .3 -0.3 -0.3 -0.3 -0.3 0 0 0 0 0 0 0.4 θ (°C) 0 10 20 30 40 -700 -600 -500 -400 -300 -200 -100 0
Appendix VI.5 : Salinity and potential temperature along Section 4 of Leg 3 (June 1998). Canada is on the left and Greenland is on the right.
30 30.5 31 31.5 32 32.5 33 33.5 34 34.5 Leg 3 Section 4 Distance (km) W-E De p th ( m ) 32.6 32.6 32.8 33 33 33.2 33.2 33.2 33.4 33.4 33.4 33.4 33.4 33.6 33.6 33.6 33.8 33.8 33.8 34 34 34 34 34.2 34.2 34.2 34 .2 34.2 Salinity 0 10 20 30 40 50 60 70 -700 -600 -500 -400 -300 -200 -100 0 -1 0 1 2 3 4 Leg 3 Section 4 Distance (km) W-E De p th ( m ) -1.3 -1 .3 -1.3 -1.3 -1.3 -1 .3 -1.3 -1 .3 -0.8 -0.8 -0.8 -0.8 -0.8 -0.8 -0.3 -0.3 -0.3 -0.3 -0.3 -0.3 0.2 0.2 0.2 0.2 0.2 0.7 0.7 θ (°C) 0 10 20 30 40 50 60 70 -700 -600 -500 -400 -300 -200 -100 0