Pépite | Indentation instrumentée multi-échelles de matériaux homogènes et multi-matériaux
239
0
0
Texte intégral
(2) Thèse de Stephania Kossman, Lille 1, 2017. © 2017 Tous droits réservés.. lilliad.univ-lille.fr.
(3) Thèse de Stephania Kossman, Lille 1, 2017. DOCTORAT DE L'UNIVERSITE DE LILLE 1 SCIENCES ET TECHNOLOGIES. Doctoral School: SPI Sciences pour l’Ingénieur Laboratory: Laboratoire de Mécanique de Lille – FRE 3723 Discipline: Mécanique des solides, des matériaux, des structures et des surfaces. TITLE OF THE THESIS: Multiscale instrumented indentation of homogeneous materials and multimaterials ABSTRACT:. The mechanical properties (hardness and elastic modulus) can be studied at different scales as a function of the composition and microstructure of materials (number of phases, constituent distribution, grain size…). In this work, we studied this mechanical response at the nano, micro and macroscopic scales, through different instruments that allow to apply loads ranging from 10 mN up to 2 kN generating penetrations depths between 50 nm and 250 μm. The first stage consisted in the improvement of the experimental conditions, developing and interpreting the experimental data, following a rigorous metrological methodology, in order to achieve the connection between the results obtained at the three studied scales. These tests were performed in metallic industrial materials, which are sufficiently homogeneous at the tested penetration depths (steels and aluminum alloy). For example, we had proposed an alternative approach to the Oliver and Pharr method to fit the unloading curve to estimate the elastic modulus. Afterwards, this methodology is applied to the study of the response obtained by indentation in a composite material, which is highly heterogeneous, used in the fabrication of brake pads in the railway industry. The obtained results (spatial distribution on the surface and through the volume of hardness and elastic modulus) are going to be valuables in the applications of models to study the squeal noise during braking, looking to reduce its effects.. Keywords:. Multiscale indentation; multicyclic indentation; grid indentation; metrological procedure; heterogeneous materials; brake pads.. i © 2017 Tous droits réservés.. lilliad.univ-lille.fr.
(4) Thèse de Stephania Kossman, Lille 1, 2017. DOCTORAT DE L'UNIVERSITE DE LILLE 1 SCIENCES ET TECHNOLOGIES. Ecole doctorale : SPI Sciences pour l’Ingénieur Laboratoire : Laboratoire de Mécanique de Lille – FRE 3723 Discipline : Mécanique des solides, des matériaux, des structures et des surfaces. TITRE DE LA THÈSE : Indentation instrumentée multi-échelles de matériaux homogènes et multi-matériaux. RÉSUMÉ :. Les propriétés mécaniques (dureté et module d’élasticité) peuvent s’étudier à différentes échelles en fonction de la composition et de la microstructure des matériaux (nombre de phases, répartition des constituants, diamètre des grains…). Dans ce travail nous étudions ces comportements aux échelles nano, micro et macroscopiques, grâce à une gamme d’appareils expérimentaux en indentation instrumentée qui permettent d’appliquer des forces variant de 10 mN à 2 kN et de provoquer des enfoncements mesurables de 50 nm à 250 μm. Une première partie consiste à optimiser les conditions expérimentales, dépouiller et interpréter les données en suivant une démarche métrologique rigoureuse, dans le but d’effectuer le raccordement entre les résultats obtenus aux trois échelles de mesure étudiées. Ces essais sont effectués sur des matériaux métalliques industriels mais suffisamment homogènes (aciers et alliage d’aluminium). Nous proposons par exemple une méthode alternative à celle d’Oliver et Pharr pour estimer le module d’élasticité à partir de la courbe de décharge en indentation. Cette méthodologie est ensuite appliquée à l’étude du comportement sous indentation d’un matériau composite, hautement hétérogène, utilisé pour la fabrication de plaquettes de freinage dans le domaine ferroviaire. Les données obtenues (répartition spatiale en surface et en volume de la dureté et des modules d’élasticité) sont destinées à être utilisées dans les modèles simulant le bruit de crissement au freinage, afin d’en atténuer les effets.. Mots-clefs :. Indentation instrumentée multi-échelles ; indentation multi-cyclique ; cartographie ; démarche métrologique ; matériaux hétérogènes ; plaquettes de freinage. ii © 2017 Tous droits réservés.. lilliad.univ-lille.fr.
(5) Thèse de Stephania Kossman, Lille 1, 2017. Acknowledgments The success of a PhD principally depends on the PhD candidate, and of course on other factors such as the work environment, supervisors, colleagues, etc. I was not the exception it depended mainly on me, but I was very lucky in other aspects, especially regarding the people around me, and here starts my long list. Firstly, I thank God for this great opportunity in my professional career and life, for all the lived experiences, and for giving me the strength to finish it successfully. Then, certainly in the top of the list are my two supervisors, Prof. Chicot and Prof. Iost, they become like dads for me, they were excellent in the human and scientific sense, they are incredible persons with a great sense of humor. I express my eternal gratitude to them because no matter what they always found the time for me, for their patience to response my thousands of “petites questions”, to deal with my personality, and their willingness to help me always. Both had very different mindsets but with the same purpose encouraging and helping me to achieve my goals. They teach me so many things, I was very lucky to share with them that have 30 years in the field of indentation (or even more), we definitely made a great team together. They were the best chefs that I could ever imagine, they were beyond any expectation. I thank them for trusting in me since the beginning, for their continuous motivation, and forging my character. I worked in two laboratories, we were not very numerous but gladly I met great people. I’m grateful to all of them, they become part of my everyday routine, they help me a lot and made my days better, thanks to Isabel, Philemon, Alex, Mohammad, Alberto, Thierry, Francine, Adrien and Cosmin. But I specially thank to: Isabel, because of her contagious spirit and joy, she encourages me many times when I needed, it was like and older sister with a huge heart; Philemon, because of his support, complicity and genuineness, always available to help. Alberto, as Venezuelan compatriot, he remembers me my Venezuelan people. Mohammad, because of his authenticity and deep conversations. Alex, because of his peculiar and funny personality, making me laugh so many times. Thierry, because of his kindness, all his scientific help, all the work together, the teachings hours and coffees with great conversions. I would like to thank to Prof. Mariana, she became like a mother for me, I will be eternally grateful for introduce me to Prof. Chicot and Prof. Iost during my master internship. I express my sincere gratitude for being so special with me, give me her support and put me under. iii © 2017 Tous droits réservés.. lilliad.univ-lille.fr.
(6) Thèse de Stephania Kossman, Lille 1, 2017. pressure when it was necessary. I also thank to the Prof. Eli and Meme for being so kind with me. I thank to my roommate and special friend Krystel, she taught me so many things about life and gave me her support during difficult times. I express my gratitude to Maggie and Paul, for being so kind and care about me. I appreciate all the help that gave me Prof. Philippe and his team, Itziar, Vincent and AnneLise, providing me the samples for the research and the required information. I thank to David for all his scientific help and being so kind. My sincere thanks to Mr. Luis Pérez (my father in law), for his unconditional help, all invested hours in helping me, his gentleness and love. Besides, I express my gratitude to all the members of the evaluation committee present at the dissertation day, and specially to the reviewers of the manuscript Prof. Benayoun and Prof. Nouveau, for their dedication and constructive critics. I specially thank to the Région Hauts-de-France for the financial support to pursue my PhD studies, without their support it would not have been possible to achieve this goal. The top of the list is shared by many persons, I cannot forget to thank to my mother, sisters, and husband. Being so far away from here, their spiritual support and unconditional love were essential for me. I specially thank to my hubby for clear my mind, for pushing me to be better in every sense and showing me a solution for everything, I thank him for being that person that can change my mood.. iv © 2017 Tous droits réservés.. lilliad.univ-lille.fr.
(7) Thèse de Stephania Kossman, Lille 1, 2017. Index Introduction. ................................................................................................................................. 1 CHAPTER I................................................................................................................................... 5 I.1. Introduction. ....................................................................................................................... 5 I.2. Basis of the test. ................................................................................................................. 6 I.2.1. Instrumented indentation tests: load-displacement curve. ....................................... 6 I.2.2. Indenters types. ........................................................................................................... 7 I.2.3. Axisymmetric indenters............................................................................................... 9 I.2.4. Principle of self-similarity or geometric similarity. ................................................. 11 I.2.5. Loading curve. ............................................................................................................ 12 I.2.6. Unloading curves. ...................................................................................................... 14 I.3. Determination of the mechanical properties................................................................... 17 I.3.1. Determination of the hardness from IIT. ................................................................. 17 I.3.2. Elastic modulus calculation....................................................................................... 19 I.3.3. Contact areas. ............................................................................................................ 21 I.3.4. Effective indenter shape. ........................................................................................... 23 I.3.5. Deformation mode sink-in and pile-up. .................................................................... 24 I.3.6. Work of indentation approach. .................................................................................. 27 I.4. Correction of the data. ...................................................................................................... 30 I.4.1. Frame compliance. ..................................................................................................... 31 I.4.2. Indenter area function or tip defect. ......................................................................... 34 I.4.3. Thermal drift. ............................................................................................................. 35 I.4.4. Initial penetration depth or zero-contact point. ....................................................... 35 I.5. Uncertainties in instrumented indentation testing........................................................ 36 I.5.1. Force uncertainties. ................................................................................................... 36 I.5.2. Displacement uncertainties. ...................................................................................... 36 I.5.3. Indenter area function uncertainties. ....................................................................... 37 I.5.4. Frame compliance. ..................................................................................................... 37 1.5.5. Uncertainty perpendicularity and alignment. ......................................................... 38 I.5.6. Surface roughness. ..................................................................................................... 39 I.5.7. Zero contact point....................................................................................................... 40 I.6. Conclusions. ...................................................................................................................... 40 CHAPTER II. .............................................................................................................................. 41 II.1. Characteristics of the instruments. ............................................................................... 41 v © 2017 Tous droits réservés.. lilliad.univ-lille.fr.
(8) Thèse de Stephania Kossman, Lille 1, 2017. II.1.1. Nanoindenter XP. ..................................................................................................... 41 II.1.2. Microindenter CSM2-107. ........................................................................................ 43 II.1.3. Macroindenter ZHU 2.5. .......................................................................................... 45 II.2. Indenters. ........................................................................................................................ 47 II.3. Metallic materials. .......................................................................................................... 49 II.3.1. Steel hardness blocks (39HRC and 63.4HRC). ....................................................... 49 II.3.2. Aluminum alloy (Al). ................................................................................................ 50 II.3.3. Stainless steel grade 316L (SS316L). ...................................................................... 50 II.3.4. Preparation of samples before to indentation tests. ............................................... 51 II.4. Experimental procedure for multiscale indentation tests. ........................................... 52 II.4.1. Multiscale indentation tests. ................................................................................... 52 II.4.2. Corrections of the data. ............................................................................................ 55 II.5. Methodology of calculation. ............................................................................................ 59 II.5.1. Methodology of calculation for E modulus and H from the data of the loaddisplacement curve................................................................................................................... 59 II.5.2. Methodology of calculation of the work of indentation. .......................................... 63 II.5.3. Calculation of elastic modulus by the work of indentation. ................................... 66 CHAPTER III.............................................................................................................................. 67 III.1. Theoretical basis. ........................................................................................................... 67 III.2. A new approach of the Oliver and Pharr model to fit the unloading curve. ............... 71 III.3. Least squares method to fit the unloading curve. ....................................................... 72 III.4. Comparison between the Oliver and Pharr and the inverted models. ....................... 73 III.4.1. Fitting the unloading curves with inverted and Oliver and Pharr models. ........ 75 III.4.2. Testing the robustness of the inverted and Oliver and Pharr models. ................ 78 III.4.3. Variation of fitting parameter with the fraction of the unloading curve. ............ 84 III.5. Conclusions and applications. ....................................................................................... 86 CHAPTER IV. ............................................................................................................................. 89 IV.1. Correction of the frame compliance. ............................................................................. 89 IV.1.1. Correction of the frame compliance in nanoindentation. ...................................... 92 IV.1.2. Correction of the frame compliance in microindentation. ..................................... 95 IV.1.3. Correction of the frame compliance in macroindentation. .................................... 99 IV.1.4. System compliance correction in the three instruments. .................................... 102 IV.2. Mechanical properties obtained by multiscale indentation. ...................................... 104 IV.2.1. Load-displacement curves in multiscale indentation. ......................................... 105 IV.2.2. Elastic modulus obtained by multiscale indentation. ......................................... 110 vi © 2017 Tous droits réservés.. lilliad.univ-lille.fr.
(9) Thèse de Stephania Kossman, Lille 1, 2017. IV.2.3. Hardness obtained by multiscale indentation: HIT, HM. ................................... 121 IV.2.4. Hardness calculation by work of indentation. ..................................................... 128 IV.2.5. Round-robin comparison with previous studies in the literature. ...................... 132 IV.3. Conclusions................................................................................................................... 136 CHAPTER V. ............................................................................................................................ 139 V.1 Introduction and theoretical basis. ................................................................................ 139 V.1.1. Grid indentation. .................................................................................................... 140 V.2. Material and experimental procedure. ......................................................................... 144 V.2.1. Microstructural characterization of brake pad. .................................................... 144 V.2.2 Instrumented indentation tests. ............................................................................. 148 V.3 Results and discussion. .................................................................................................. 151 V.3.1 Grid indentation by nanoindentation tests. ........................................................... 151 V.3.2 Macroindentation tests. ........................................................................................... 168 V.3.3. Multiscale indentation: mixture law (nanoindentation) and macroindentation. 180 V.4. Conclusions. ............................................................................................................... 184 General conclusions. ................................................................................................................. 187 References. ................................................................................................................................ 192 Extended abstract in French ………………………………………………………………………. 203. vii © 2017 Tous droits réservés.. lilliad.univ-lille.fr.
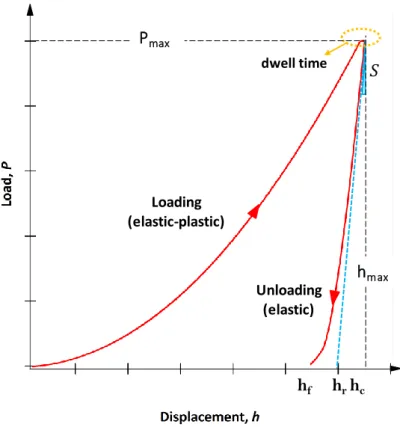
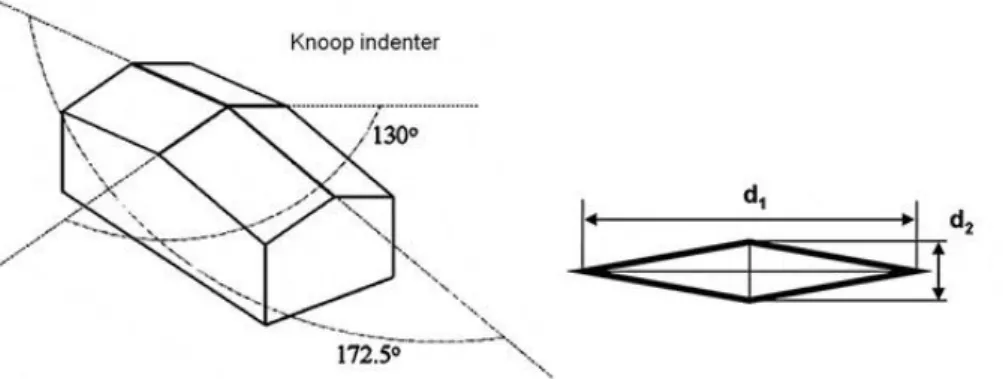
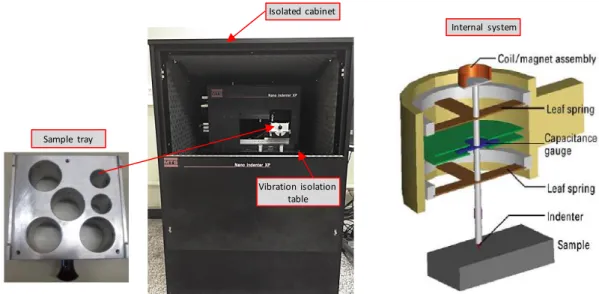
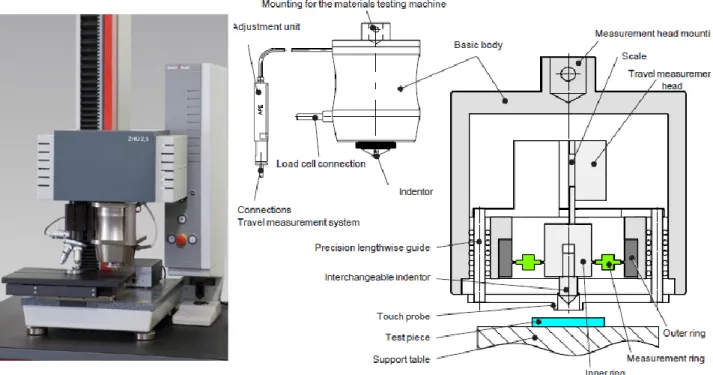
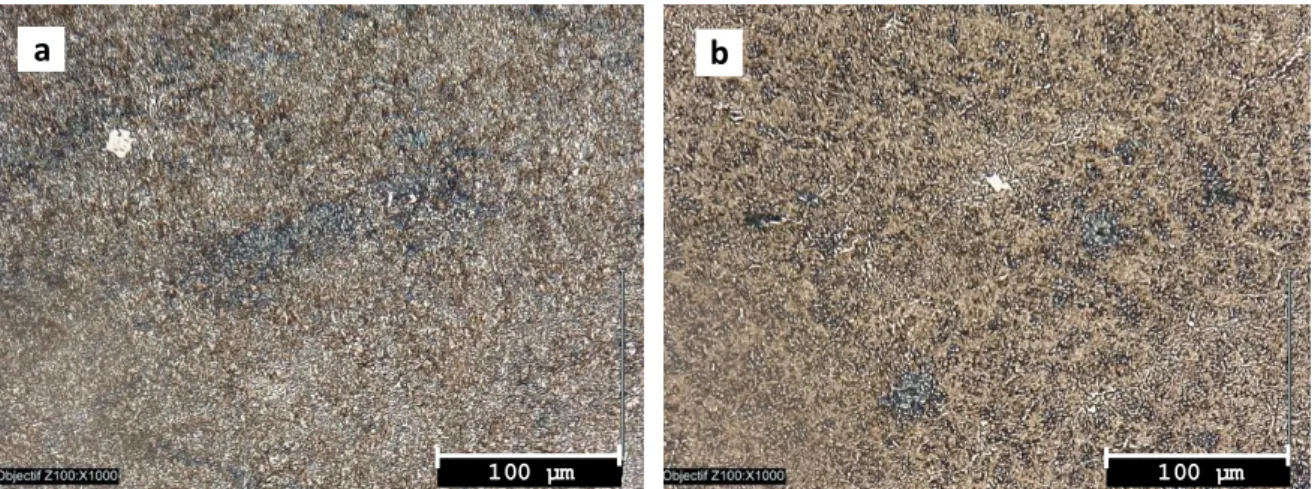
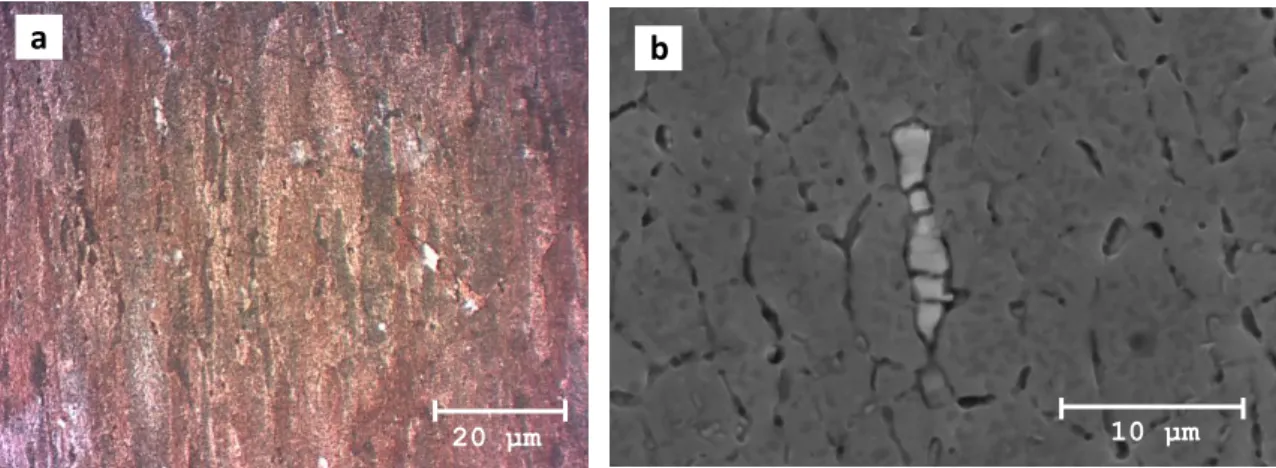
(10) Thèse de Stephania Kossman, Lille 1, 2017. List of figures Fig. I.1. Load displacement curve, showing important quantities and parameters for the analysis to get the elastic modulus and hardness. .................................................................................................................... 7 Fig. I.2. Schematic representation of the indenter geometries, a) Vickers, b) Berkovich, and c) equivalent axisymmetric cone. ............................................................................................................................................. 8 Fig. I.3. Schematic illustration of Knoop indenter, showing the angles between faces and residual impression of diagonals 𝑑1 and 𝑑2. ................................................................................................................... 9 Fig. I.4. Schematic diagram of triangular pyramid indenter of angle 𝜓, and its equivalent axisymmetric conical indenter of angle 𝜃 based on the equivalence of equal base area [47]. ............................................ 10 Fig. I.5. Object with geometric similarity [35]. ............................................................................................... 12 Fig. I.6. Schematic representation of an impression after unloading according to Eq. I.14. ...................... 16 Fig. I.7. Schematic representation of pressure distributions under the indenter during loading, unloading and reloading and effective indenter shape [64]. ........................................................................................... 23 Fig. I.8. Schematic representation of an impression showing pile-up and sink-in. 𝑎𝑐 indicates the contact radius. ............................................................................................................................................................... 25 Fig. I.9. Load-displacement curves pointing out the areas under the curve considered as the work of indentation [105]. ............................................................................................................................................. 27 Fig. I.10. Relation between 𝑊e /𝑊total and 𝐻/𝐸𝑟 by FEA results [95]. ........................................................... 28 Fig. I.11. Schematic flat punch mounting for the determination of the direct frame compliance. The pin locks the punch when the nut is tightened against the threaded post. After the test, the nut is released manually and the pin is removed to allow full retraction of the bunded punch sample [112]. ................... 34 Fig. II.1. Nano Indenter XP by MTS with the operation internal system and the sample tray. ................ 42 Fig. II.2. High load system in the Nanoindenter XP. .................................................................................... 43 Fig. II.3. Microindenter CSM2-107 showing the internal working system. ................................................. 44 Fig. II.4. References forks 1 and 2 used at the microindenter. ..................................................................... 45 Fig. II.5. Macro indenter Zwick ZHU 2.5 and scheme of the operating system. .......................................... 46 Fig. II.6. Evolution of the measuring procedure for the macroindenter ZHU2.5. ℎplastic corresponds to the residual depth after the indenter retreat and ℎelastic corresponds to the penetration depth recovered upon unloading. ................................................................................................................................................ 46 Fig. II.7. Calibration curves performed in fused silica by CSM nanoindentation tests. The validity of the function area starts at the displacement where elastic moduli is constant. ................................................ 47 Fig. II.8. SEM micrographs of the used indenters: (a) Vickers indenter used in macroindentation with a tip defect of ~185 nm. (b) Berkovich indenter used in microindentation with a tip defect of ~100 nm. .... 48 Fig. II.9. Microstructure of hardness block samples etched with Nital at 2%, a) 39HRCand b) 63.4HRC.49 Fig. II.10. a) Microstructure of aluminum alloy (series 7000) showing elongated grains, observed by optical microscopy with polarized light b) precipitates observed by scanning electron microscopy........... 50 Fig. II.11. Microstructure of austenitic stainless steel 316L, etched with HNO3 +HCl + glycerol. ............ 51 Fig. II.12. Load-displacement curves of classic tests: a) Presentation of the principal quantities needed in the analysis, hf residual depth, 𝑆 stiffness, ℎp plastic depth. b) Test performed at the nanoindenter, the thermal drift is corrected at 10% of Pmax. c) Test performed at the microindenter, the deflection at the end of the unloading curve is due to the instrument mechanism. d) Test performed at the macroindenter.... 53 Fig. II.13. Load-displacement curve from multicyclic tests at the microindenter. ...................................... 54 Fig. II.14. Load-displacement curve from classic tests at the nanoindenter in aluminum. 𝑃max = 1400 mN corresponds with the high load range of the instrument. Note the deviation in the unloading curves. ........................................................................................................................................................................... 55 Fig. II.15. a) Load-displacement curve for classical test. b) Zoom of the region of the curve (a) where zero contact point is determined from the slope of the data change. c) Harmonic contact stiffness versus displacement into surface obtained by CSM tests taken from the instrument software. d) Zoom of the. viii © 2017 Tous droits réservés.. lilliad.univ-lille.fr.
(11) Thèse de Stephania Kossman, Lille 1, 2017. region used to determine zero contact point in CSM tests. Note that the change in the slope is more abrupt with the second methodology, which is usually more precise but is material dependent [48]. ...... 56 Fig. II.16. Example of zero contact point determination with the software of the microindenter using the curve force versus time. ................................................................................................................................... 57 Fig. II.17. a) zero contact point correction of a load-displacement curve of aluminum, the enclosed region with the dotted line corresponds to the fitting performed by the software. b) exported load-displacement curves corrected with the zero-contact point with the method of first force increase and polynomial 2nd degree at 5N, exalting the differences between both methods...................................................................... 58 Fig. II.18. Vickers hardness (HV) and Martens hardness (HM) as a function of the reciprocal displacement. For both materials, the zero-contact point was determined by the 2nd degree polynomial for forces below 50 N. ....................................................................................................................................... 59 Fig. II.19. Schematic representation of the procedure used to compute elastic modulus and hardness using the data from instrumented indentation tests. The procedure I should be performed previously to the computation of the elastic modulus and hardness. After I, the steps included in II are performed again, followed by the calculation of the mechanical properties................................................................... 60 Fig. II.20. Load-displacement curve from multicyclic tests showing the difference between the uncorrected and the corrected curve with the frame compliance that affect the calculation of the areas under the curves. .............................................................................................................................................. 64 Fig. II.21. Example of the method to calculate the areas under the curve in multicyclic tests. ................. 65 Fig. III.1. Examples of application of Cagliero et al.[41] model given by Eq. III.4. to fit the unloading curve (a) proper fitting of the unloading curve at 5N with random residuals. (b) fitting of the unloading curve at 100 N, the residuals are not random at the end of the unloading curve (upper region enclosed by dotted line). ....................................................................................................................................................... 70 Fig. III.2. Load-displacement dimensionless curves for the fused silica and aluminum samples.............. 74 Fig. III.3. Schematic representation of Monte Carlo simulation, where 𝑃 and ℎ, are the load and displacement of the experimental data at which is added a Gaussian noise centered at zero (average) and standard deviation different to zero (𝜎). ........................................................................................................ 79 Fig. III.4. Correlation of fitting parameters obtained by the inverted and Oliver and Pharr models. The values are collected from 100000 load-displacement curves obtained from MC simulation....................... 80 Fig. III.5. Histograms of the elastic modulus computed from the curves obtained by MC simulation for the fused silica. stdv represents the standard deviation of the Gaussian noise added to the displacement data. The unloading curves were fitted by the Oliver and Pharr and the inverted models........................ 81 Fig. III.6. Histograms of the elastic modulus computed from the curves obtained by MC simulations for the aluminum sample using the Oliver and Pharr and the inverted models. stdv represents the standard deviation of the Gaussian noise added to the displacement data. The dotted lines represent the average elastic modulus of each data (AVGO&P, AVGinv). For the inverted approach AVGinv the value match with the reference modulus (Ref.) computed without perturbation of the data. .................................................. 82 Fig. III.7. Histograms of the contact stiffness, 𝑆, computed from the fitting of the unloading curves of aluminum by the inverted and Oliver and Pharr models, for the curves obtained by Monte Carlo simulation with different Gaussian noises. Ref. is the reference value of 𝑆 for the curve without perturbation. ..................................................................................................................................................... 83 Fig. III.8. Variation of the fitting parameters with the fraction of the unloading considered to the fit, applying the Oliver and Pharr and the inverted models. The average and standard deviation values are computed from 10000 Monte Carlo simulations. ........................................................................................... 85 Fig. III.9. Variation of stiffness, 𝑆, and elastic modulus, 𝐸, with the percentage of the unloading curve considered to the fit applying the Oliver and Pharr and the inverted models. The average and standard deviation values are computed from 10000 Monte Carlo simulations. ........................................................ 86 Fig. III.10. Fitting parameters of the unloading curves as a function of the applied load obtained by the inverted approach at nano, micro and macroindentation in the steel sample 39HRC. .............................. 88. ix © 2017 Tous droits réservés.. lilliad.univ-lille.fr.
(12) Thèse de Stephania Kossman, Lille 1, 2017. Fig. IV.1. Variation of 1/S vs 1/Ac0.5 and 1/S vs 1/Ac0.5, the interception of the curves with the y-axis in both plots represents the frame compliance for each tested material; Ac corresponds to the computation assuming sink-in as predominant deformation mode.................................................................................... 93 Fig. IV.2. a) Variation of the elastic modulus before and after correction of 𝐶s , the small correction of 𝐶s leads to a diminution of the modulus at larger loads > 100 mN). b) Calculation of the frame compliance by method 1 (dotted line) giving 𝐶s = 0.013 nm/mN, the dashed line is forced to pass by zero for 𝐶𝑠 = 0,both cases lead to a similar slope and the same elastic modulus. ............................................... 94 Fig. IV.3. Variation of elastic modulus without correction of the frame compliance in the microindenter. ........................................................................................................................................................................... 96 Fig. IV.4. System compliance calculation for the sample 63.4HRC tested with reference 1. a) individual multicyclic tests by method 1; b) individual multicyclic tests by method 2; c) all the data from multicyclic tests by method 1; d) classic tests by method 1. ............................................................................................. 97 Fig. IV.5. System compliance calculation by methods 1 and 2 for aluminum sample tested using reference 2. ........................................................................................................................................................................ 98 Fig. IV.6. a) Elastic modulus variation as a function of load with different values of compliance. b) Frame compliance calculation by methods 2 for 39HRC sample using the table or the metrology marble as support. ........................................................................................................................................................... 100 Fig. IV.7. Frame compliance computation by the method proposed by Ullner et al. [113] using the data from the loading curve, where the slope of the curve is the frame compliance, deviations from the straight line indicates load dependence of Cf. a) experimental results of Ullner et al. [113]. b) experimental results of this work. .................................................................................................................................................... 102 Fig. IV.8. a) Load-displacement dimensionless curves corresponding to classic tests performed with the three instruments on the sample 39HRC. b) Initial part of the loading curves, region 1 in a. c) Loading curves at the zone of maximum load, region 2 in a. d) Initial zone of the unloading curves, region 3 in a. ......................................................................................................................................................................... 105 Fig. IV.9. a) Load-displacement dimensionless curves corresponding to multicyclic for the sample 39HRC, comparison between cycles. b) Detail of the unloading curves of various cycles. c) Load-displacement curve from multicyclic test in microindentation, and classic tests in nanoindentation and macroindentation. d) Zoom of the unloading part of (c). ............................................................................. 106 Fig. IV.10. Load-displacement curves obtained from nanoindentation and macroindentation in the samples 39HRC, 63.4HRC, SS316L and Al.................................................................................................. 108 Fig. IV.11. Variation of fitting parameters of the unloading curve (Eq. VI.11) at microindentation, the represented values are the average for each material................................................................................. 109 Fig. IV.12. Load-displacement curves for a conical indenter 𝜃 = 70.3° for two specimens (1) and (2) with the same 𝐸 = 210 GPa and hardness of 5 GPa and 2.65 GPa, respectively. The unloading curves are computed supposing a power law index, 𝑚 = 2 [6]. ..................................................................................... 110 Fig. IV.13. Elastic modulus of aluminum sample obtained by multiscale indentation. ............................ 111 Fig. IV.14. Elastic modulus of stainless steel sample obtained by multiscale indentation. ..................... 111 Fig. IV.15. Elastic modulus calculated by the stiffness method for sink-in and pile-up (Eq. IV.5) and by the work of of indentation (Eq. IV.15). The reported values are the average for all the range of load at each scale of measurement. The dotted lines represent the regions of theoretical values for each sample. ......................................................................................................................................................................... 112 Fig. IV.16. Imprints profiles from macroindentation tests with Vickers indenter obained by optical profilometry. ................................................................................................................................................... 114 Fig. IV.17. Imprints in aluminum sample at the three scales. The observation of the imprints was done by optical profilometry. .................................................................................................................................. 115 Fig. IV.18. Pile-up measures as function of the testing load in macroindentation for sample 39HRC. ... 116 Fig. IV.19. Average values of the ratios hf/hmax and We/Wt for all the range of loads at nano, micro and macro scales. ................................................................................................................................................... 117. x © 2017 Tous droits réservés.. lilliad.univ-lille.fr.
(13) Thèse de Stephania Kossman, Lille 1, 2017. Fig. IV.20. Variation of ratios hf/hmax and We/Wt with the indentation load for the three scales in the aluminum sample........................................................................................................................................... 118 Fig. IV.21. Variation of the reduced elastic modulus at nano, micro and macro scales for SS316L as a function of the ratio 𝑆/𝐴c . a) considering ℎ𝑐 pile−up at the macro scale, b) considering ℎ𝑐 sink−in at the macro scale. ................................................................................................................................................................ 120 Fig. IV.22. Variation of hardness as a function of the testing load at the three scales of measurement for 39HRC sample. At the micro range the values corresponding to classical tests and multicyclic tests are presented. ....................................................................................................................................................... 121 Fig. IV.23. Variation of hardness as a function of the testing load at the three scales of measurement for 63.4HRC sample. At the micro range the values corresponding to classical tests and multicyclic tests are presented. ....................................................................................................................................................... 122 Fig. IV.24. Variation of hardness as a function of the testing load at the three scales of measurement for Al sample. At the micro range the values corresponding to classical tests and multicyclic tests are presented. ....................................................................................................................................................... 122 Fig. IV.25. Variation of hardness as a function of the testing load at the three scales of measurement for SS316L sample. .............................................................................................................................................. 123 Fig. IV.26. Variation of hardness at the nano, micro and macro scales for sample SS316L as a function of the reciprocal penetration depth (circles) or the reciprocal square root of the displacement (squares), reveling the presence of indentation size effect phenomenom. ................................................................... 126 Fig. IV.27. Variation of hardness at the nano, micro and macro scales for sample 39HRC as a function of the reciprocal penetration depth (circles) or the reciprocal square root of the displacement (squares), reveling the presence of indentation size effect phenomenom. ................................................................... 127 Fig. IV.28. Comparison between hardness numbers obtained by the work of indentation with 𝐻𝑀, 𝐻𝐼𝑇, 𝐻𝑀𝑒𝑦𝑒𝑟, at the nano and macro scale for the samples Al and 39HRC. The values represented are the average obtained at each aplied load at the macro scale. ........................................................................... 130 Fig. IV.29. Variation of the ratios 𝑊p /𝑊t with ℎf /ℎmax obtained from the average values of each ratio in the four studied materials. ............................................................................................................................ 131 Fig. IV.30. Comparison between hardness numbers obtained by the work of indentation with HM, HIT, HMeyer, at the nano and macro scales for the sample SS316L. The values represented are the average obtained at each aplied load. ......................................................................................................................... 132 Fig. IV.31. a) Variation of elastic modulus between scales and comparison with previous Round-Robin studies [169,196,197]. b) Variation of elastic modulus for each material with the three instruments. The variation coefficient is computed considering the standard deviation and the average value of results. 133 Fig. IV.32. Variation of hardness at the macro scale and comparison with previous Round-Robin studies [34,169,196,197]. The variation coefficient is computed considering the standard deviation and the average value of results. ................................................................................................................................ 135 Fig. V.1. Schematic representation of grid indentation for heterogeneous materials. Top: large indentation depths h >>D, to obtain the properties of the homogenized medium. Bottom: low penetration depth h << D, to identify the intrinsic properties of each constituent by a multimodal distribution [206]. ......................................................................................................................................................................... 141 Fig. V.2. Manufacturing procedure of brake pads. ...................................................................................... 145 Fig. V.3. Microstructural characterization of brake pads by SEM, (a) top surface after polishing, identifying the main constituents, (b) cross-section of the material after polishing. Where: 1 graphite, 2 SiC, 3 metallic matrix, and 4 ZrSiO4. ............................................................................................................ 146 Fig. V.4. Theoretical diffusion profile for Carbon in γ-Fe, assuming the concentration in the surface as the maximum solubility of Carbon in γ-Fe at 1100 °C during 8 hours. ..................................................... 146 Fig. V.5. Microstructure of brake pad after chemical etching with nital 2%. Left: optical microscopy. Right: detail of the formation of perlite by SEM. ......................................................................................... 147 Fig. V.6. Analysis EDX in an imprint obtained by nanoindentation, to reveal the differences between the phases of the matrix, accompanied of graphite (spot 3). ............................................................................. 147. xi © 2017 Tous droits réservés.. lilliad.univ-lille.fr.
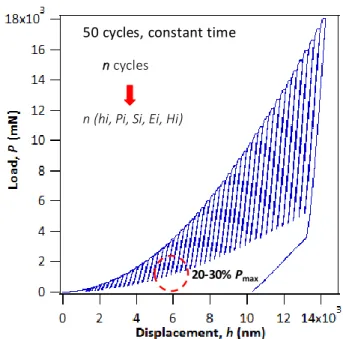
(14) Thèse de Stephania Kossman, Lille 1, 2017. Fig. V.7. Example of creep tests: penetration depth as a function of time 150 N at maximum load, the curves represent two tests made with the same conditions at different places. ........................................ 150 Fig. V.8. Examples of load-displacement curves and elastic modulus as a function of the penetration depth obtained by CSM nanoindentation tests performed on the brake pad. ........................................... 152 Fig. V.9. Microstructure and mapping of elastic modulus and hardness obtained by nanoindentation grid on brake pad material at 250 nm penetration depth. .................................................................................. 154 Fig. V.10. Histogram of instrumented hardness with deconvolution results, and histogram of elastic modulus obtained at 250 nm of penetration depth from 1400 grid indentation tests. The bin size to plot the histograms was 0.2 GPa for hardness, and 3 GPa for elastic modulus. The right-side figures show the detailed regions of ceramic and matrix phases. 𝜇𝑖 represents the mean value, 𝑠𝑖 is the standard deviation and 𝑉𝑖 the volume fraction. ............................................................................................................................ 157 Fig. V.11. Deconvolution of the results of elastic modulus and hardness for graphite phases obtained at 250 nm. Two types of graphite were found, corresponding to an approximated bimodal distribution. The bin sizes to plot the histograms were 1 GPa for the elastic modulus, and 0.05 GPa for hardness........... 159 Fig. V.12. Deconvolution results of elastic modulus and hardness of ceramic phases and metallic matrix (left) and zoom for the ceramic distributions (right) obtained at 100 nm of penetration depth. .............. 161 Fig. V.13. Schematic representation of testing positions in brake pad a) test performed in the middle of a particle implicating a larger thickness. b) test performed at the edge of the particle obtaining a quick influence of the underneath material. c) unpolished material with an initial particle thickness d) polished material reducing the particle thickness. ..................................................................................................... 163 Fig. V.14. Possible configurations analyzed by a model used in multilayer coatings due to the analogy between both systems, composite and coated materials. 𝐴𝑖 /𝐴 represents the contribution of each layer 𝑖 to the measured hardness at a certain penetration depth. ............................................................................. 164 Fig. V.15. Analysis of an nanoindentation CSM curve with a multilayer model[243]. (a) Fit of the model to the experimental curve, the table shows the different staked phases that lead to the behavior of the curve, where 𝐶ti-layer, is given by the product of thickness of the phase (𝑡) by a constant related to the deformation process (𝐶). (b) Contribution of each phase to the composite response vs. the penetration depth. (c) Schematic representation of a multilayer system with the staked particles showing the plastic deformation zone. ........................................................................................................................................... 165 Fig. V.16. (a) Fit of the multilayer model to the elastic modulus variation, (b) Contribution of each phases to the composite elastic modulus vs. the penetration depth, the table shows the different staked phases that lead to the behavior of the curve, (c) Fit of the multilayer model to the hardness variation, (d) Contribution of each phases to the composite hardness vs. the penetration depth, the table shows the different staked phases that lead to the behavior of the curve. .................................................................. 166 Fig. V.17. Load-displacement curves in brake pad by macroindentation multicyclic tests with Vickers indenter. .......................................................................................................................................................... 169 Fig. V.18. Elastic modulus and hardness variation vs the applied load in multicyclic macroindentation tests. ................................................................................................................................................................ 170 Fig. V.19. Histograms of the elastic modulus at each cycle load from 10 to 260 N, corresponding to the tests performed with Vickers indenter in the top surface of the brake pad. .............................................. 171 Fig. V.20. Histograms of the hardness at each cycle load from 10 to 260 N (left), and hardness variation with load (right) corresponding to the tests performed with Vickers indenter in the top surface of the brake pad. ....................................................................................................................................................... 171 Fig. V.21. Load-displacement curves obtained by multicyclic macroindentation tests with Vickers indenter performed in the cross-section of the brake pad. .......................................................................... 172 Fig. V.22. Histograms of the elastic modulus for different applied loads obtained by multicyclic tests with Vickers indenter, and its variation as function of the load corresponding to the tests performed in the cross section of the brake pad. ....................................................................................................................... 173 Fig. V.23. Histogram of the instrumented hardness (left) and hardness variation with load (right) obtained from macroindentation tests with Vickers indenter in the cross section of the brake pad. ...... 173. xii © 2017 Tous droits réservés.. lilliad.univ-lille.fr.
(15) Thèse de Stephania Kossman, Lille 1, 2017. Fig. V.24. Load-displacement curves in brake pad by macroindentation multicyclic tests with spherical indenter. (a) load range 10-260 N, 𝛥𝑃 = 50 𝑁 the difference of the curves because of the sample heterogeneities. (b) load range 50-1450 N, 𝛥𝑃 = 200 𝑁 higher loads reduce the difference between curves due to a bigger indented volume. .................................................................................................................. 174 Fig. V.25. Histograms of the elastic modulus at each cycle load from 10 to 260 N, corresponding to the tests performed with spherical indenter....................................................................................................... 175 Fig. V.26. Histograms of the elastic modulus at each cycle load from 50 to 1450 N, corresponding to the tests performed with spherical indenter....................................................................................................... 176 Fig. V.27. Example of load displacement curve obtained by spherical indentation at 50 N, plotting 𝑃2 versus ℎ3 to obtain a straight line, which slope is directly related to the elastic modulus by the Hertz equation. Note that the curve is well fitted for the first micrometers of penetration. The computed elastic modulus for this case was ~5 GPa. ............................................................................................................... 178 Fig. V.28. Load-displacement curves obtained by macroindentation with Vickers indenter in a sample of the equivalent metallic matrix of the brake pad. ......................................................................................... 179 Fig. V.29. Left: comparison between elastic modulus as a function of the indented volume obtained by multicyclic Vickers and spherical indentation; the Reuss model estimation and the results obtained by compression tests are pointed out as reference values. Right: comparison between the indented volumes as a function of the displacement into surface for Vickers and spherical indentation (𝑑 = 10 mm). ..... 181 Fig. V.30. Stress-strain curves from uniaxial compression tests performed in the brake pad [227]........ 183. xiii © 2017 Tous droits réservés.. lilliad.univ-lille.fr.
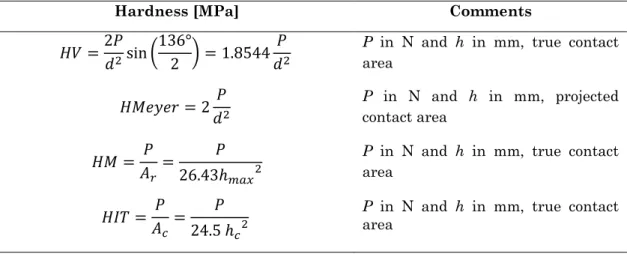
(16) Thèse de Stephania Kossman, Lille 1, 2017. List of tables Table I.1. Projected contact areas and intercept factor for various types of indenters. For pyramidal indenters, the semi-angles are the face angles with the central axis. .......................................................... 10 Table I.2. Hardness numbers for classical indentation tests and instrumented indentation tests, considering the true or the projected contact area. ....................................................................................... 18 Table I.3. Summary of methods used in the frame compliance determination. .......................................... 32 Table II.1.Typical compositions of stainless steel grade 316L. ..................................................................... 50 Table II.2.Theoretical mechanical properties of bulk metallic materials. ................................................... 51 Table II.3. Test conditions for indentation tests in metallic samples using the nanoindenter, microindenter and macroindenter. ................................................................................................................. 52 Table III.1. Fitting parameters obtained by the Oliver and Pharr and by the inverted models using the dimensionless load-displacement curves. ....................................................................................................... 74 Table III.2. Fitting results according to the initial values of parameters for the unloading curve of fused silica sample at 245 mN................................................................................................................................... 76 Table III.3. Fitting results according to the initial values of parameters for the unloading curve of aluminum sample at 245 mN. ......................................................................................................................... 77 Table III.4. Condition number (Eq. III.14) of Oliver and Pharr and inverted models for fused silica and aluminum.......................................................................................................................................................... 78 Table III.5. Elastic moduli obtained by the Oliver and Pharr and inverted models, applying Monte Carlo simulations with different Gaussian noise added to the displacement data of the aluminum sample. .... 82 Table IV.1. System compliance values for the four metallic materials computed by methods 1 and 2. .... 95 Table IV.2. System compliance values computed by methods 1 and 2 in multicyclic and classic tests for the four metallic samples................................................................................................................................. 98 Table IV.3. System compliance values obtained by methods 1 and 2 at the macroindenter. ................... 101 Table IV.4. Parameters and mechanical properties obtained at 2 kN for sample 39HRC, with the correction of the Cs 2.5 nm/N. ........................................................................................................................ 103 Table IV.5. Summary of equations used for the calculation of the elastic modulus and hardness. ......... 104 Table V.1. Composition of brake pad material (f), particles sizes, elastic modulus (Eth) and hardness (Hth) of each phase. ................................................................................................................................................. 145 Table V.2. Test conditions of multiscale indentation in brake pads. .......................................................... 149 Table V.3. Comparison theoretical volume fractions of the phases and experimental volume fraction obtained from the deconvolution of hardness at 250 nm. ............................................................................ 157 Table V.4. Results of the analysis of the hardness and elastic modulus by the deconvolution method of the separated phases distributions from data measured at 250 nm of penetration depth. ...................... 158 Table V.5. Deconvolution results of elastic modulus and hardness for ceramic, graphite and metallic phases in the brake pad from data measured at 100 nm of penetration depth. ........................................ 160 Table V.6. Results obtained from the computation of the elastic modulus and hardness by the mixture law models Reuss, Voigt and Voigt-Reuss-Hill (Eq. V.15) .......................................................................... 180. xiv © 2017 Tous droits réservés.. lilliad.univ-lille.fr.
(17) Thèse de Stephania Kossman, Lille 1, 2017. Introduction Nowadays composite materials are used in several applications since they provide advantages combining very dissimilar properties, with respect to the homogeneous ones. Brake pads for any kind of transport applications, from bikes to airplanes, are known to be heterogeneous materials that overcome critical conditions of temperature, wear, corrosion, etc., during service. Particularly for railway applications, brake pad materials undergo extreme conditions of temperature and wear. In order to predict their service life and their behavior during braking, it is mandatory to know their mechanical properties. The mechanical characterization of these materials has been a challenge for the industry; during many years, the brake pads were produced by trial and error due to their complex structures and characteristics. Today the requirements in service are superior, consequently the actual knowledge of the properties is desired; this last decade many works have been done to accomplish this objective [1–4]. This work is focused on the determination of elastic modulus and hardness of highly heterogeneous brake pads for railway applications; at the macro scale, these materials are typically characterized by classic methods like uniaxial compression performed with a cumbersome procedure to obtain accurate properties [1], which leads to the global properties of the material. In order to achieve the mechanical properties of individual phases or constituents of brake pads, we propose the use of the multiscale instrumented indentation testing (IIT) allowing a very localized response at very small loads, or an overall response at elevated loads. The technique is based on the penetration of an indenter of known geometry and properties into a material of unknown properties, recording a load-displacement curve that allows to obtain the mechanical properties such as hardness and elastic modulus. This technique is very powerful for mechanical characterization because of its experimental simplicity and, as we mentioned before, the possibility to work among different scales of loading, from pico to kilo Newtons and consequently from nano to micrometers of indentation depths [5,6]. Brake pads were studied from the nano range to identify the local intrinsic properties, to the macro range to get their overall properties at different penetration depths, necessary in the squeal noise simulations. Due to the complexity of the characterization of these materials, we previously study the performance and applicability of multiscale indentation in metallic homogeneous materials. In this sense, the investigation was divided in five chapters briefly described below in order to contribute to the understanding of this test at different scales of measurement: 1 © 2017 Tous droits réservés.. lilliad.univ-lille.fr.
(18) Thèse de Stephania Kossman, Lille 1, 2017. Chapter I reports some of the basis of instrumented indentation testing that are. -. fundamental in the analysis and understanding of the load-displacement curves, as well as the calculation of the elastic modulus and hardness, focusing on the study of sharp indentation (pyramidal indenters). We pointed out some of the most important aspects of this method applied to homogeneous materials, that corresponds to the fundamentals of the technique; also, the description of principal parameters affecting the test and the correction of the data are given (frame compliance, deformation mode, tip defect, alignment, etc.), since the reliability of instrumented indentation testing depends on them. Chapter II presents the description of the three instruments used in this research that. -. allow us to perform the indentation tests for loads of 10 mN up to 2 kN: Nanoindenter XP (10 mN-10 N), Microindenter CSM2-107 (0.1-20 N) and Macroindenter ZHU 2.5 (5 N-2 kN), located at two different laboratories (ENSAM Lille and IUT A Lille). As well as the microstructure and references values of the mechanical properties of the metallic materials (aluminum, ferritic and austenitic steel). Different complementary testing methodologies were applied: •. Classic test using only one loading-unloading cycle and subsequently allowing the determination of one couple of hardness and elastic modulus values.. •. Continuous stiffness measurement (CSM) mode which allows the plot of the two mechanical properties versus the indenter displacement (a great number of hardness and elastic modulus couples).. •. Multicyclic tests applied when CSM mode is not available in order to locally obtain additional information compared to the classic tests.. The specifications of these indentation tests for the calculations of the elastic modulus and hardness are described in this chapter Chapter III consists in the development of a new approach proposed to improve the power. -. law model of Oliver and Pharr to fit the unloading curve used to calculate stiffness and elastic modulus of the material. This new approach was developed because the convergence of the power law method was difficult to achieve for materials with significant plastic deformation like most of the metals (almost vertical unloading curve). The methodology relies on two main aspects: the interchange of the load-displacement variables (e.g. displacement dependent variable) since it is a better conditioning problem, and the rewriting of the approach as a dimensionless expression in order to get comparable fitting parameters at different loads and scales. The robustness of both methods was tested through Monte Carlo simulations, introducing a Gaussian noise to the displacement data. 2 © 2017 Tous droits réservés.. lilliad.univ-lille.fr.
(19) Thèse de Stephania Kossman, Lille 1, 2017. to evaluate the effect on calculation of the mechanical properties. The inverted approach was then used to fit the unloading curves of the performed tests. -. Chapter IV is addressed to answer a main interrogative: do the obtained mechanical properties change with the scale of measurement in indentation? It first presents the results obtained by multiscale indentation performed on the metallic materials, for loads ranging from 10 mN up to 2 kN and for penetrations depths ranging from 50 nm up to 250 μm with the three instruments using pyramidal indenters (Berkovich or Vickers). To establish relations among the scales of indentation in heterogeneous materials, we need to understand the phenomenon that happens at each scale of measurement, the data, the similarities in the analysis, the uncertainties, and the limits of the instruments and experiments. This chapter points out the difficulties of the technique, the correction of different parameters such as frame compliance, tip defect, etc., and highlight the importance of considering the deformation mode (sink-in or pile-up) for the calculation of the elastic modulus and hardness. We present the similarities and discrepancies across scales and instruments, validating the methods of analysis and the strategies to be considered in the study of heterogeneous materials.. -. Chapter V should respond to the following question: Highly heterogeneous materials can be mechanically characterized by instrumented indentation? Do the mechanical properties can be compared with the overall response obtained by uniaxial compression? A summary of the background of some pioneering works in instrumented indentation testing on heterogeneous materials from nano to macro scales is firstly presented. At nano scale characterization is focused on grid indentation methodology that consists in performing numerous indentation tests in an organized configuration (mapping) and analyzing them by statistical means. Then, this chapter presents the microstructural characterization and the experimental methodology for the indentation tests; at the nano scale we used CSM tests applied as grid indentation and at the macro scale multicyclic tests with increasing load. The results at the nano scale are based on a statistical interpretation of the properties extracted at shallow penetrations to obtain the individual properties of each component; at this scale, a multilayer model was used for the analysis of the curve following the analogy that multiple stacked phases are equivalent to multilayer systems. The analysis at the macro scale was intended to develop the global mechanical properties and the variation with the penetration depth and test position on the sample by means of multicyclic indentation.. 3 © 2017 Tous droits réservés.. lilliad.univ-lille.fr.
(20) Thèse de Stephania Kossman, Lille 1, 2017. In the conclusion, we present some outlooks for further works, particularly a metrological study of the tests to elucidate the real uncertainties for a better interpretation of the results, and consequently an improvement in the understanding of the indentation technique. Through this research work we achieved the publication of four papers (and one more in submission) and the participation at two conferences listed below: Papers Kossman S., Iost A., Chicot D., Mercier D., Roudet F., Serrano I., Dufrenoy P., Magnier V., Cristol A. Mechanical characterization by multiscale instrumented indentation in highly heterogeneous material. Materials and Design. Submission in Oct 2017 Kazamer N., Kossman S., Baranyi I., Chicot D., Serban V., Rajnai Z. et Voda M. « Effet de l’addition de TiB2 sur les propriétés mécaniques et tribologiques de revêtements NiCrBSi déposés par projection à la flamme ». Matériaux et Techniques. Submmited Sept 2017. (Article written in the framework of a convention with the Association Universitaire de la Francophonie (AUF 2016) between the University of Oboda (Budapest, Hungary), the University of Timisoara (Timisoara, Romania) and the University of Lille I (Lille, France), where I participated). Kossman S., Coorevits T., Iost A., and Chicot D., “A new approach of the Oliver and Pharr model to fit the unloading curve from instrumented indentation testing,” Journal of Materials Research, vol. 32, no. 12, pp. 2230–2240, 2017. Bentoumi M., Bouzid D., Benzaama H., Mejias A., Kossman S., A. Montagne, Iost A., and Chicot D., “Multiscale and multicycle instrumented indentation to determine mechanical properties: Application to the BK7 crown borosilicate,” Journal of Materials Research, vol. 32, no. 8, pp. 1444–1455, 2017. Kossman S., Chicot D., and Iost A., « Indentation instrumentée multi-échelles appliquée à l’étude des matériaux massifs métalliques ». Matériaux et Techniques, vol. 105, no. 1, pp. 104, 2017.. -. -. -. -. -. Conferences European Congress and Exhibition on Advanced Materials and Processes (EUROMAT), September 2017 (Thessaloniki, Greece).. -. Oral presentation: “A new approach of the Oliver and Pharr model to fit the unloading curve from instrumented indentation testing”. Kossman S., Coorevits T., Iost A., and Chicot D. Poster: “Mechanical characterization by multiscale instrumented indentation in highly heterogeneous material”. Kossman S., Iost A., Chicot D., Mercier D., Roudet F., Serrano I., Dufrenoy P., Magnier V., and Cristol A. -. Indentation 2016, October 2016 (Lille, France).. Oral presentation: « Indentation instrumentée multi-échelles appliquée à l’étude des matériaux massifs métalliques ». Kossman S., Chicot D., and Iost A. Poster: “A new approach of the Oliver and Pharr model to fit the unloading curve from instrumented indentation testing”. Kossman S., Coorevits T., Iost A. and Chicot D. 4 © 2017 Tous droits réservés.. lilliad.univ-lille.fr.
(21) Thèse de Stephania Kossman, Lille 1, 2017. Chapter I. Basis of instrumented indentation. CHAPTER I Theoretical background of instrumented indentation testing I.1. Introduction From almost two hundred years ago, hardness measurements have been a valuable technique for material characterization, initially founded in Mohs hardness scale in 1822, which measures the capability of different minerals to lead a permanent scratch into the others, classifying diamond as the maximum value of the scale. Decades later, the interpretation of hardness as the resistance to plastic deformation induced by a stiffer material of known geometry was developed by Brinell in 1900, the tests consist in indenting a flat surface with a spherical indenter made of hardened steel, then the diameter of the indentation was measured. Meyer hardness scale in 1908, was founded in a similar concept but using the projected contact area. Later in 1922 was developed Vickers hardness using a pyramidal square based indenter. Simultaneously Rockwell scale was established, it was given by the measurement of the indentation while the application of the load, the technique used different indenters and procedures according to the indented material [6–9]. These techniques have been very valuable in engineering as a measurement of the mechanical properties and quality control of materials. One of the constrain of these methods is the measurement of the residual imprint by optical devices, particularly to characterize materials at small scales, promoting the development of the instrumented indentation testing (IIT). Since the early 1970’s until now instrumented indention testing has become a first-rate technique for quality control of materials, that allows to quickly characterize them obtaining their mechanical properties. In instrumented indentation testing, load and penetration depth are continuously and simultaneously recorded during the loading-unloading process, typically with a precise control of both parameters. The main advantages of this technique regarding the conventional testing methods, such as traction or compression, are that it is less time consuming, it does not require a special shape of the samples, and it is considered as a non-destructive technique. Through the years, a huge improvement has been done in the instruments design to obtain reliable results with less 5 © 2017 Tous droits réservés.. lilliad.univ-lille.fr.
(22) Thèse de Stephania Kossman, Lille 1, 2017. Chapter I. Basis of instrumented indentation. uncertainty, also new techniques have been developed as the ultra-fast indentation, the coupled instruments with atomic force microscopes (AFM) or scanning electron microscope (SEM) [6,10–14]. IIT is applied in a wide variety of materials such as metals, ceramics, polymers, and composites. Thus, their application areas are broad including microelectronics [15,16], aeronautics [17,18], dental materials [19,20], fracture rocks [21,22], tribological coatings [23– 26], biological materials [27–29], food products [30,31], etc. IIT can be accurately performed from a few pico to kilo Newtons that means penetration depths of some nanometers to hundreds of micrometers, allowing the investigation of the materials across the length scales. At the micro and macro scales it can be compared with conventional hardness tests such as Rockwell, Vickers and Brinell. The investigation of the material behavior through different scales of measurement has become an attractive field of research [32–34]. Theoretical models have emerged to describe material behavior using quantum mechanics, molecular dynamics, dislocation dynamics, and continuum mechanics, i.e. from few atoms to the macroscopic scale [35].. I.2. Basis of the test I.2.1. Instrumented indentation tests: load-displacement curve The instrumented indentation test consists in the application of a load with an indenter of known properties and geometry into the surface material of unknown properties, recording a load-displacement curve during the entire test, which allows to extract the information needed to estimate the mechanical properties, an example is given in Fig. I.1. The most important quantities extracted from the test for the later calculation of the mechanical properties are listed below: ℎmax , 𝑃max : maximum displacement and load, respectively, after dwell time. ℎf : residual depth obtained after the indenter withdrawal. ℎr : intercept of the tangent of the unloading curve. ℎc : contact penetration depth. 𝑆: slope of the unloading curve, tangent at ℎmax .. 6 © 2017 Tous droits réservés.. lilliad.univ-lille.fr.
(23) Thèse de Stephania Kossman, Lille 1, 2017. Chapter I. Basis of instrumented indentation. P max dwell time. 𝑆. Loading (elastic-plastic). Unloading (elastic). hf. hmax. hr hc. Fig. I.1. Load displacement curve, showing important quantities and parameters for the analysis to get the elastic modulus and hardness.. In the subsequent sections we describe different elements related to the application of the test, and some principles involved in the calculation of the mechanical properties of the materials. Since, the test and material response depend directly on the indenter geometry, we first give a brief explanation of the most used indenters and some elements related to them to help in the understanding of the further information, which correspond to the shape and functions describing of the loading and unloading curves.. I.2.2. Indenters types Instrumented indentation tests are typically performed with pyramidal or spherical indenters in a broad range of materials. The more frequently used pyramidal indenters are Vickers and Berkovich, nevertheless Knoop and cube corner exhibit some advantageous applications [36,37]. Spherical indenters allow the direct application of Hertz equations and the relation with stress-strain curves [38,39]. Nowadays flat punch geometry is widely used in the study of biological tissues and food, because it facilitates the estimation of the contact area during penetration [40].. 7 © 2017 Tous droits réservés.. lilliad.univ-lille.fr.
Figure
![Fig. I.7. Schematic representation of pressure distributions under the indenter during loading, unloading and reloading and effective indenter shape [64]](https://thumb-eu.123doks.com/thumbv2/123doknet/3664777.108387/39.892.237.667.418.698/schematic-representation-pressure-distributions-indenter-unloading-reloading-effective.webp)
+7
Documents relatifs
