OATAO is an open access repository that collects the work of Toulouse researchers and
makes it freely available over the web where possible.
This is an author-deposited version published in :
http://oatao.univ-toulouse.fr/
Eprints ID : 9051
To link to this article : DOI: 10. 1080/10255842.2012.713651
URL : http://dx.doi.org/10.1080/10255842.2012.713651
O
pen
A
rchive
T
OULOUSE
A
rchive
O
uverte (
OATAO
)
To cite this version : Campagnolo, Lucie and Roman, Sophie and
Perchoux, Julien and Lorthois, Sylvie A new optical feedback
interferometer for measuring red blood cell velocity distributions
in individual capillaries: a feasibility study in microchannels.
(2012) Computer Methods in Biomechanics and Biomedical
Engineering, vol. 15 (sup1). pp. 104-105. ISSN 1025-5842
Any correspondence concerning this service should be sent to the repository
administrator:
[email protected]
㩷A new optical feedback interferometer for measuring red blood cell velocity distributions
in individual capillaries: a feasibility study in microchannels
L. Campagnoloa,b*, S. Romanc, J. Perchouxa,band S. Lorthoisc
aCNRS, LAAS, 7 Avenue du colonel Roche, F-31400 Toulouse, France;bUniv de Toulouse, INP, LAAS, F-31400 Toulouse, France; c
Institut de Me´canique des Fluides de Toulouse, UMR CNRS 5502, France Keywords: microfluidic; optical feedback interferometry; dual-slit
1. Introduction
The dynamics of blood flow in microvascular networks is of great importance in the exchange of nutrient and waste substances between blood and living tissues. In these vessels of diameter less than 100 mm, the development of quantitative methods for measuring the velocity of red blood cells (RBCs) is still challenging. In this context, the dual-slit (DS) technique, a temporal correlation technique first introduced by Wayland and Johnson (1967), is commonly used. Our group has recently shown that, provided that several operational conditions are fulfilled, this technique can provide a precise measurement of the transverse velocity profile of RBCs, i.e. along the x-axis, as shown in Figure 1. The measured velocities are maximal velocities in the depth of the channel, i.e. y direction (Roman et al. 2012). However, this technique requires expensive equipment (high speed camera), and the related data-treatment is time consuming. Moreover, the duration of the acquisition is long (typically 2 – 40 s). For these reasons, on line measurements, especially in cases of transient regimes, are not possible. The aim of this work was to determine whether optical feedback inter-ferometry, a new optical technique in the microfluidic domain which is based on the optical feedback effect in laser diodes, can be used to perform quantitative measurements of RBCs velocity in channels with diameters less than 100 mm. Optical feedback interferometers (OFIs) are indeed compact, low cost and simple sensors. They are known for providing much shorter response times than DS, currently lower than 10 ms, while keeping the precision of traditional Laser Doppler Interferometers. This technique has been previously applied and validated to measure velocity profiles in 300 mm diameter channels (Nikolic et al. 2011), but its feasibility in smaller channels is still to be demonstrated. For that purpose, the velocity profiles obtained by OFI and DS are compared, using polydimethylsiloxane (PDMS) micro-channels and spheric monodisperse particle suspensions in set-up configurations where the DS has been previously validated (Roman et al. 2012).
2. Methods
Particle suspensions (0.1%(v/v)) are prepared from a concentrated stock solution of 4 mm diameter latex micro-spheres (InvitrogenTM, Life Technologies, Saint Aubin, France).
The flow is controlled in rectangular PDMS micro-channels of size 20 £ 100 mm using a syringe pump (PHD 22/2000 Harvard Apparatus, Holliston, MA) and Hamilton Gastight (Bonaduz, Switzerland) glass syringes.
First, the DS techniqueis applied. In this technique, the channel under study is transilluminated and two photo-sensors (slits) are positioned, separated by a known distance, Ls, along the vessel axis (z direction in Figure 1).
In our case, the slits are regions of interest (1 £ 3 pixels2) on images of particle flows recorded using a high speed video camera (PCO Dimax). The time modulation of light, produced by the passage of the particles flowing through the channel, is deduced by performing the sum of grey levels in both slits at each time step. For various distances Ls between the two slits, a cross correlation velocity,
Vds¼ Ls/Td, is obtained, where Td is the time delay for
which the cross-correlation between the two signals is maximum. For an optimal Ls (Roman et al. 2012), the
final velocity at a given point on the x-axis represents the maximal velocity in the y direction. Finally, the slits are successively positioned in the x direction to obtain a profile of RBCs maximal velocities.
Then, the OFI technique is applied to the same microfluidic set-up. The optical feedback effect occurs when a portion of the light emitted from a laser is reflected from an external target and reenters the laser cavity (Petermann 1995). For flow measurement, light scattered from a single moving particle that is suspended in a fluid is shifted in frequency by the Doppler effect. The light suffering from optical feedback mixes with the initial light, causing optical interferences inside the laser cavity. By amplifying and analysing the laser junction voltage in the frequency domain, the velocity of the particle can
be calculated (Riva et al. 1972). The OFI dedicated experimental set-up was as follows. The laser was a commercial Firecomms vertical cavity surface-emitting laser (VCSEL) lasing at 667 nm. A dual-lens system has been used to minimise the sensing volume, and therefore to improve spatial resolution. The optical head was mounted on a computer-controlled 3-axis motorized micrometer translation stage, and the focus point was stepped through the channel along the x-axis to reconstruct the flow profile. The VCSEL terminal voltage was AC-coupled to a low noise amplifier module and then fed into an analog-to-digital converter for analog-to-digital signal processing on computer. For practical purpose, optical system collects light backscattered from a number of different particles. There-fore, the frequency spectrum contains a distribution of frequencies, which corresponds to a distribution of particle velocities. For this configuration, the maximum velocity in the sensing volume can be associated with the 3dB cut-off frequency of the Doppler spectrum (Riva et al. 1972).
Both experimental set-ups are represented in Figure 1 As shown by Roman et al. (2012), in the conditions of this experiment for the DS technique, the measured velocity at each point in the x direction corresponds to the maximal velocity in the depth of the channel (y direction). Similarly, due to the optical configuration, the maximal velocity in the depth of the channel is also measured by the OFI technique.
3. Results and discussion
In order to validate the OFI technique, the laser spot was first focused in the middle of the channel, and the pumping rate was set from 0.1 to 1 ml/min. The cut-off frequency position varies linearly with the flow rate, showing good agreement with theory (data not shown).
Both reconstructed profiles, and the Newtonian theor-etical profile (Patzek and Silin 2001), normalised by the maximal measured velocity, are plotted in Figure 2. The profile shapes are similar for the two techniques showing that OFI is suitable for measuring velocity distributions in such channels.
These preliminary results demonstrate the feasibility of OFI measurement in microchannels of size below 100 mm. The next step is to use both sensing techniques simultaneously in the same experiment in order to perform quantitative comparisons. The technique is then applied on RBCs flow. This promising low-cost technique brings the possibility of real-time applications, such as in vivo blood flow measurements. Moreover, OFI technique may have the potential for simultaneous measurement of haematocrit (RBCs volume fraction).
Acknowledgements
This work has been partly supported by BQR 2011 INPT VLAM and GDR CNRS 2760. We also thank David Bourrier from ‘Plate forme technologique du LAAS-CNRS’.
References
Nikolic M, Lim YL, Wilson SJ, Rakic AD, Campagnolo L, Perchoux J, Bosch T. 2011. Flow profile measurement in micro-channels using changes in laser junction voltage due to self-mixing effect. Sensors IEEE. 1394 – 1397.
Patzek TW, Silin DB. 2001. Shape factor and hydraulic conductance in noncircular capillaries I: one-phase creeping flow. J Colloid Interface Sci. 236:295 – 304.
Petermann K. 1995. External optical feedback phenomena in semiconductor lasers. IEEE J Quantum Electron. 1:480 – 489. Riva C, Benedek GB, Ross B. 1972. Laser Doppler measurements of blood-flow in capillary tubes and retinal arteries. Invest Ophthalmol. 11:936.
Roman S, Lorthois S, Duru P, Risso F. 2012. An optimized technique for red blood cells velocity measurement in microvessels. accepted to be published in J. Biomech., abstracts of the 18th Congress of the European Society of Biomechanics.
Wayland H, Johnson PC. 1967. Erythrocyte velocity measure-ment in microvessels by a two-slit photometric method. J Appl Physiol. 22:333 – 340.
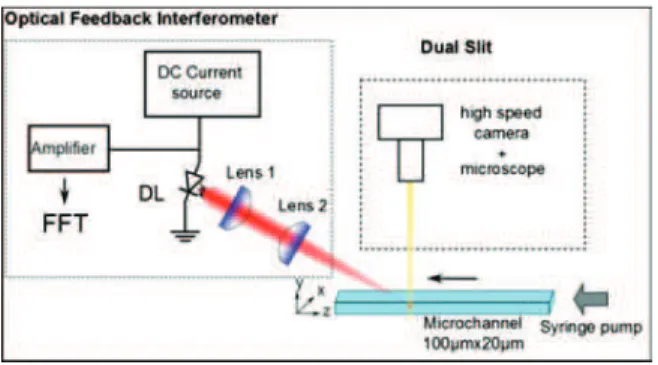
Figure 1. OFI (left) and DS (right) set-ups.
Figure 2. Normalised profiles of maximal velocity measured in a rectangular PDMS channel (100 £ 20 mm), using OFI (blue dashed curve) and DS (red plotted curve).