Accepted Manuscript
Title: Statistical optimization of electrochemical oxidation of ethylene glycol using response surface methodology
Author: Karama Jardak Ahmad Dirany Patrick Drogui My Ali Khakani
PII: S0957-5820(16)30199-9
DOI: http://dx.doi.org/doi:10.1016/j.psep.2016.08.021
Reference: PSEP 862
To appear in: Process Safety and Environment Protection Received date: 12-1-2016
Revised date: 21-8-2016 Accepted date: 31-8-2016
Please cite this article as: Jardak, Karama, Dirany, Ahmad, Drogui, Patrick, Khakani, My Ali, Statistical optimization of electrochemical oxidation of ethylene glycol using response surface methodology.Process Safety and Environment Protection http://dx.doi.org/10.1016/j.psep.2016.08.021
This is a PDF file of an unedited manuscript that has been accepted for publication. As a service to our customers we are providing this early version of the manuscript. The manuscript will undergo copyediting, typesetting, and review of the resulting proof before it is published in its final form. Please note that during the production process errors may be discovered which could affect the content, and all legal disclaimers that apply to the journal pertain.
1
Statistical optimization of electrochemical oxidation of ethylene glycol
using response surface methodology
Karama Jardak 1, Ahmad Dirany 2, Patrick Drogui*3, My Ali Khakani 4
1
Graduated Master Student, Institut national de la recherche scientifique (INRS-Eau Terre et Environnement), Université du Québec, 490 rue de la Couronne, Québec, Qc, Canada, G1K 9A9, Phone: (418) 654-2550, Fax : (418) 654-2600, email: [email protected]
2
Research associate, Institut national de la recherche scientifique (INRS-Eau Terre et Environnement), Université du Québec, 490 rue de la Couronne, Québec, Qc, Canada, G1K 9A9, Phone: (418) 654-2550, Fax : (418) 654-2600, email: [email protected]
3
Professor, Institut national de la recherche scientifique (INRS-Eau Terre et Environnement), Université du Québec, 490 rue de la Couronne, Québec, Qc, Canada, G1K 9A9, Phone: (418) 654-3119, Fax : (418) 654-2600, email: [email protected]
4
Professor, Institut national de la recherche scientifique (INRS-Énergie matériaux et télécommunication), Université du Quebec, 1650, boulevard Lionel-Boulet,Varennes, Québec city, Canada, J3X 1S2, Phone : 514 228-6900, Fax : 450 929-8102, Email: [email protected]
Paper submitted to be published in Process Safety and Environmental Protection
*
Corresponding author:
E-mail: [email protected]
Tel: (418) 654-3119; Fax: (418) 654-2600
2
Research highlights
Electrochemical oxidation of EG was performed using BDD as working anode.
Optimization of operating conditions was carried out using RSM approach.
A maximum COD and TOC removal (91 ± 2.2 % and 80 ± 4 %, respectively) were
recorded.
Current and treatment time contributed with respectively 49 % and 43 % in the COD
removal.
3
Abstract
Large amounts of ethylene glycol (EG) based antifreeze liquids are daily discharge into the receiving waters. The chemical oxygen demand (COD) detected in most of the lakes and rivers close to the discharge points exceeded 100 000 mg O2/L. With such an amount,
biological and chemical processes are inefficient to completely remove EG. In order to efficiently remove EG, electrochemical oxidation (ECO) of EG was carried out. Niobium Boron Doped Diamond (Nb/BDD) was used as anode whereas carbon felt was used as cathode. Different operating parameters including current intensity, treatment time, electrolyte concentration and pollutant concentration were tested. The application of 0.077A/cm2 of current density during 120 min in the presence of 7.0 g/L of Na2SO4 allowed
89.6 ± 0.2 % of COD removal with 490 mg O2/L of residual COD. This result was far below
the legislation standard set by the province of Quebec that allows the discharge of 800 mg O2/L of COD. The efficiency of ECO process was attributed to both direct and indirect
oxidation that generate strong oxidizing species (OH°, S2O82-, H2O2, etc.) capable of
oxidizing organic matters on the surface of the anode and in the bulk of the solution.
Keywords
4
Nomenclature
ECO Electrochemical oxidation
EG Ethylene Glycol
COD Chemical Oxygen Demand TOC Total organic carbon
Nb/BDD Niobium Boron Doped Diamond RSM Response surface methodology
FD Factorial design
CCD Central composite design ANOVA ANalysis Of VAriance
5
1. Introduction
Ethylene glycol (EG) is a dihydroxy alcohol that is well known for its relatively high boiling point (197.6°C) and freezing point well below zero (-13°C) (Kim and Hoffmann, 2008). Owing to these properties, EG could be used in heat exchangers as cooling fluid, in airports as deicer liquid, in pharmaceutical industry as surface active agents, in plastic industries as plasticizers and in resin manufacturing purposes (Orecki et al., 2006; Staples et al., 2001). In 2001, 83 kt of EG were produced in Canada to be used as cooling and antifreeze liquids (EC, 2001). Consequently, large amounts of EG ranging between 1000 and 25 000 mg/L have been detected in wastewaters with a possibility of exceeding 250 000 mg/L in some cases (Araña et al., 2012). Once discharged into lakes, aquatic organisms could be exposed to high concentrations of EG reaching 19 000 mg/L. With such concentrations, the chemical oxygen demand (COD) and the total organic carbon (TOC) increase considerably, thereby causing several environmental damages to the living organisms (brain damage, nervous system damage, etc.) (Louhichi et al., 2008). In order to protect aquatic and terrestrial organisms from EG toxicity effects, biological and chemical treatments have been used. However, EG at large concentrations limit the efficiency of biological processes (McGinnis et al., 1999) whereas with chemical processes such as Photo-Fenton, large amounts of sludge could be generated leading to an increase in the treatment cost (Rajeshwar and Ibanez, 1997).
Over the last few years, advanced oxidation processes such as electrochemical oxidation (ECO) have been proposed as an adequate alternative for biological and chemical treatments (Daghrir et al., 2014). In fact, two mechanisms could be distinguished in ECO process: (1) direct oxidation on the surface of the working anode where the oxidation of water molecules
6
generates strong oxidants (E°(OH°/H2O) = 2.80 V vs.SHE) capable of oxidizing different
organic pollutants and (2) indirect oxidation in the bulk of the solution where the same compounds could be oxidized via other mediators (eg.H2O2, HClO, S2O82-) (Anglada et al.,
2009).
The main objective of this current study was to optimize the operating conditions (EG concentration, current intensity, treatment time and electrolyte type) of EG removal using electrochemical oxidation process. Therefore, a factorial design methodology was applied to investigate the effect and interactions of operating parameters on EG removal followed by a central composite design targeting the optimization of the treatment process. The overall process cost was also investigated at the end of this study.
2. Materials and methods
2.1. EG effluent
The EG solution used in this study was an anti-freeze sample provided by Produits Chimiques Magnus Ltd Company (Boucherville, QC, Canada) and used in industrial cooling systems. It was comprised of 530 g/L of ethylene glycol (C2H6O2), 0.60 g/L of azole and
8.72 g/L of phosphate (PO43-). The EG solution had an initial COD content of more than 100
g/L and a pH around 9.5. Synthetic EG effluents having different concentrations (2.5 to 3.5 g/L) were prepared using distilled water. 7g/L of salt (Na2SO4 or NaCl) was added to
increase the electrical conductivity. The choice of such EG and electrolyte concentrations was based on previous study conducted by Jardak et al. (2016). Mixing and stirring time of 5 min was required to completely dissolve sodium salt.
7
2.2. Electrolytic reactor set up
The electrolytic cell used was made of Plexiglas material with a dimension of 17 cm (depth) × 5cm (width) × 15cm (length). It was comprised of one anode and one cathode with an inter-electrode gap of 1 cm. The anode had a solid surface area of 65 cm2 and a void surface area of 45cm2. The circular anode (12 cm of diameter × 0.1 cm thick) was made of niobium coated with boron doped diamond (Nb/BDD) whereas the cathode was a carbon felt having a surface area of 127cm2.The electrodes were vertically installed on a perforated Plexiglas plate at 2 cm from the bottom of the cell.
All experiments were carried out in a closed loop as shown in Fig1. The loop consisted of 2.0 L of a Plexiglas tank (1), a peristaltic recycling pump (2) and the electrolytic cell (3). During the treatment, the solution in the electrolytic cell was recirculated through the pump. A recycle flow rate of 170 ml/min was maintained using the peristaltic recycling pump (Master flex, Model 77200-50, USA). A current intensity ranging between 3.0 and 6.0 A was imposed during 60 to 120 min of treatment time. The current intensity was delivered by means of DC power supply Xantrex XFR 40-70 (Aca Tmetrix, Mississauga, Ontario, Canada). All experiments were carried out at room temperature (25 ± 0.1 °C) with a total volume of 1.0 L.
2.3. Experimental design
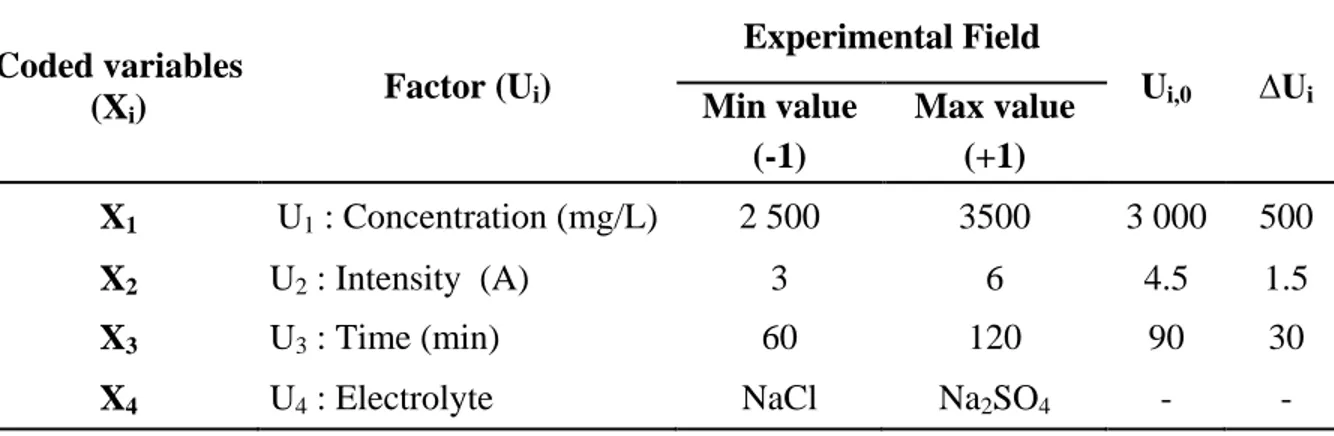
Four different operating parameters including EG concentration (X1), current intensity (X2),
treatment time (X3) and electrolyte type (X4) were chosen as the most important parameters
in the electrochemical oxidation of EG. In order to optimize these parameters, a response surface methodology (RSM) has been considered. RSM is a collection of mathematical and statistical methods for modeling, optimizing, and analyzing a treatment process in which the
8
response can be influenced by several variables (Daghrir et al., 2012). Both factorial design (FD) and central composite design (CCD) are the most widely used design in experimental design methodology. The objective of FD is to determine the main interactions and effects of the selected factors on the target responses whereas CCD allows the optimization of the treatment process.
In this case of study, the number of factors was set to 4 (X1, X2, X3, and X4) and responses to
2 (COD and TOC removal). The FD matrix was comprised of 16 experiments (2k= 24, k is the number of factors) where each factor was fixed to two different levels (-1) and (+1), as illustrated in Table 1. The CCD matrix, on the other hand, was comprised of FD matrix (16 experiments) with 24 additional assays. Based on the categorical factor (electrolyte type), six assays were run at the center of the domain whereas the other six were axial assays (with α = ± 1.68).
2.4. Analytical details
The pH was determined using a pH-meter (Fisher Acumet model 915) equipped with a double junction Cole-Palmer electrode with Ag/AgCl reference cell. The conductivity was also measured using a conductivity meter (Oakton Model 510). During this study, the Chemical Oxygen Demand (COD ) was determined using the method prescribed by the Ministry of Sustainable Development, Environment and Parks, Quebec (Analysis method – AM. 315-DCO 1.0). The reading was realized using a spectrophotometer (λ = 600nm). Total organic carbon (TOC) was also investigated using a Shimadzu TOC 5000A analyzer. The identification and quantification of EG by products was performed using high pressure liquid chromatography (HPLC).
9
2.7. Economic aspect
During electrochemical treatment, different chemical reagents such as sodium sulfate Na2SO4 and sodium hydroxide NaOH were used. A unit cost of 0.1$/kg for Na2SO4 and
3.84$/kg for NaOH were considered. The energy consumed was estimated at a cost of 0.06$CAN/KWh, which corresponds to the cost fixed by the province of Quebec (Canada). The total cost was evaluated in terms of CAN dollars spent per cubic meter of treated solution ($CAN/m3).
3. Results and discussions
3.1. Effect of operating parameters on EG removal using FD methodology
The effect of different variables including pollutant concentration (X1), current intensity
(X2), treatment time (X3) and electrolyte type (X4) on EG removal was investigated using
FD methodology. Each factor was fixed to two different levels (minimum) and (maximum) normalized as (-1) and (+1). The experimental region and the coded values are represented in Table 1. The factorial matrix obtained was comprised of 16 assays in which two responses (COD and TOC removal) were investigated. The results are summarized in Table 2 using 7g/L of salt (Na2SO4 or NaCl). Based on these results; it was possible to determine the effect
(b) of each factor (X) as well as the effect of their interactions (Xi Xj) on the response (Y).
This was well illustrated in the following polynomial model (Eq.1):
(1)
10
Where Y is the experimental response (for COD or TOC removal); b0 represents the average
value of the responses of the 16 assays; Xi the coded variable (-1 or +1); bi represents the
principal effect of each factor «i» on the response and bij represents the interaction effect
between factor «i» and factor «j» on the response (Y). The coefficients of the model were calculated using the half-difference between the arithmetic average of the response values when the associated coded variable is at a level (+1) and the arithmetic average of the response values when the associated coded variable is at level (-1). Design-Expert Program Software (Design Expert 7, Stat-Ease Inc., Minneapolis) was used to calculate the coefficient of the polynomial model. Since two different responses (COD and TOC removal) were considered, two mathematical models could be deduced:
(2)
(3)
Where Xi vary between (+1) and (-1), Y1 is the COD removal percentage and Y2 is the TOC
removal percentage.
In order to evaluate the significance of these models, Analysis Of Variance (ANOVA) was performed by the design expert software. It was found that the correlation coefficient (R2) of the proposed models were 0.93 and 0.92 for COD removal and TOC removal, respectively. According to Joglekar and May (1987), a correlation coefficient that exceeds 0.8 indicates that the models are acceptable with a good correlation between predicted and experimental values. Consequently, the models presented in Eq.2 and Eq.3 are significant and predicted-experimental values are well correlated.
11
Based on the results summarized in Eq.2, the COD removal (Y1) was positively influenced
by the current intensity (X2) and the treatment time (X3) showing the highest effects (b2=
+12.44 and b3= +11.74). In other terms, an increase in one or both of these factors enhances
the COD removal efficiency, leading to a better performance of the ECO process. According to Daghrir et al. (2014), the simultaneous increase of the COD removal with the current intensity could be explained by the higher generation of hydroxyl radicals (OH°) on the BDD surface, the persulfate ions (S2O82-) in the bulk of the solution and the hydrogen
peroxide (H2O2) on the carbon felt surface. Likewise, the longer the treatment time is the
better the oxidant production will be, leading to a higher COD removal.
The increase in EG concentration (X1), on the other hand, reduces considerably the COD
removal efficiency (b1= - 4.81), as demonstrated in Eq.2. Such an effect could be due to the
fact that the calculation of COD removal is in percentage which explains that with the increase of EG concentration, the removal of COD decreases in term of percentage. However in term of mass balance, the quantity of COD removed from solution increased from 3225 mg to 4053 mg when the initial EG concentration passed from 2500 mg/L to 5000 mg/L, probably due the higher mass transfer of pollutant. On the other hand, the electrolyte type (X4) showed no significance at all and its effect was automatically eliminated by the design
expert software in order to improve the model.
The same observation could be deduced for the TOC removal (Y2), where current intensity
and treatment time show the same positive effects on the target response (b2= +15.65 and b3=
12
Further investigations were also conducted by plotting Pareto charts for all selected factors. Pareto charts allow the hierarchical arrangement of both influencing factors and interactions based on their effects, as shown in SM1. It is well known that the effects situated above the dotted line (t-value limit) are statistically significant and should be taken into account in the study (Han et al., 2006). Consequently, current intensity (X2) and treatment time (X3)
influenced significantly the COD removal with the predominance of the current intensity (X2) (SM2). For the TOC removal, the current intensity (X2) and the treatment time (X3) had
almost the same significant effect on the response whereas electrolyte type (X4) was the least
influent factor in both cases (SM1).
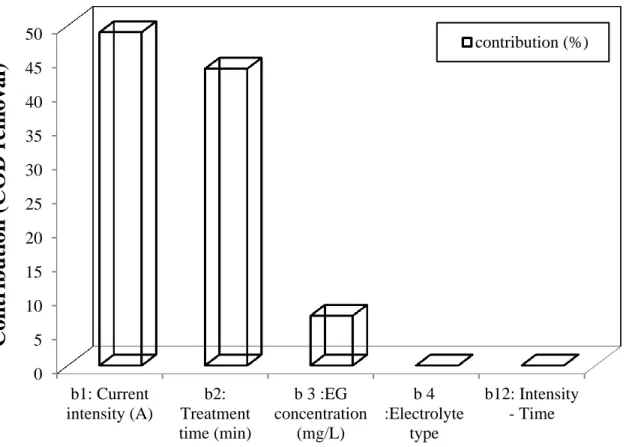
In order to seek more information, the contribution of each significant factor in COD and TOC removal was evaluated using the following equation (Eq.4):
( ) (4)
Where bi represents the estimation of the principal effects of the factor «i». The results are
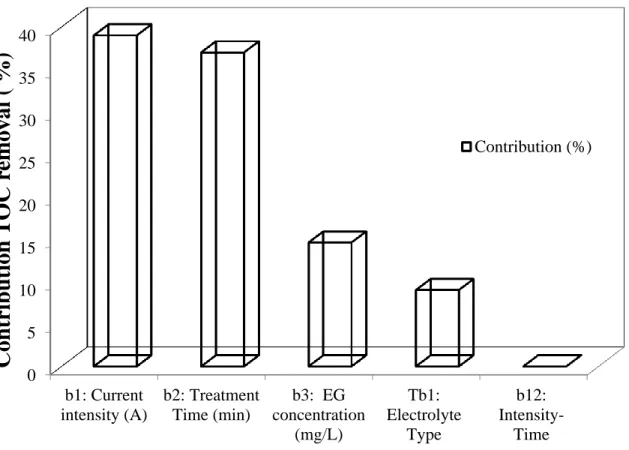
summarized in Fig 2 and Fig 3.
It was found that the current intensity (X2) and the treatment time (X3) were the major
contributors in the COD removal with 49 % and 43 %, respectively (Fig.2). The same trend was observed with TOC removal where X2 and X3 contributed with 39 % and 37 %,
respectively (Fig.3). EG concentration (X1), on the other hand, showed an extremely low
contribution in both cases (between 7.0 and 9.0%).
Overall, FD methodology has been used as an effective tool for determining the effects and interactions of the different factors on EG removal by ECO process. However, such a method is not sufficient to optimize the treatment process. Therefore, a more sophisticated
13
method known as central composite design (CCD) methodology has been carried out in the second part of this study.
3.2. Optimization of EG removal using central composite design methodology
As stated earlier, four different operating parameters (EG concentration (X1), Current
intensity (X2), treatment time (X3) and electrolyte type (X4)) were chosen as key factors in
the ECO of EG. In order to be optimized, a CCD methodology was carried out. The CCD matrix was comprised of 40 assays including the FD matrix (16 assays). Based on the categorical factor (Electrolyte type), the CCD matrix was divided into two. For each electrolyte (NaCl or Na2SO4), six assays were replicated in the center whereas the other six
were axial assays (α= ± 1.41). The results are summarized in Table 3 and Table 4.
In order to investigate these results, a second order model relating dependent variables and independent ones was expressed as follows (Eq.5) (Amalraj Appavoo et al., 2014):
(5)
where Y refers to the response, b0 is the constant, bi, bii and bij represent the linear, quadratic
and interactive effects, respectively, of the input factors Xi and Xj (i =1, 2, 3 and 4; j= 1, 2, 3
and 4), and “e” represents the residual term. All of the coded variables (X) were calculated using Eq.6:
(6)
Where is the value of at the center; ∆ ) is the value of variable change step and Uimax and Ui min are respectively the maximum and the minimum
14
In this case of study, two different responses (COD and TOC removal) were considered. Therefore, two quadratic models could be deduced (Eq.7 and Eq.8 respectively):
(7)
(8)
Where Xi varies between -1.41 and +1.41; Y1 is the COD removal and Y2 is the TOC
removal..
Based on these models, two different hypothesis (H0 and H1) were defined. The first
hypothesis (H0) considered the models to be insignificant whereas the second one (H1)
considered the models to be significant. In order to accept or to reject H0, an ANOVA test
was carried out, as presented in SM2.
In fact, the acceptance or the rejection of H0 strongly depends on the F value (F) that should
be compared to the critical F value (Fc) obtained from fisher Table (95 % of confidential level). According to the results summarized in SM2, F values (16.53 for COD and 16.66 for TOC) were highly superior to Fc (Fc (0.05,4,35) = 2.64 for COD and Fc (0.05,13,26) = 2.12 for
TOC). Consequently, H0 was rejected and both of the proposed models were significant. This
was also confirmed by comparing Pr > F with α value (α =0.05). According to Muhamad et
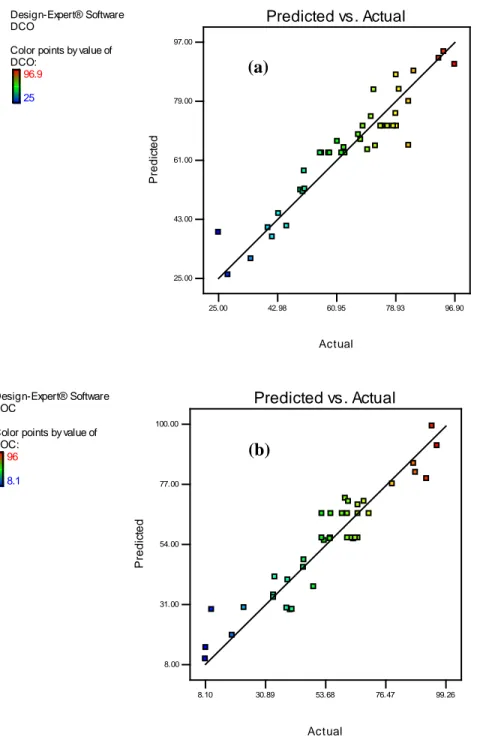
al. (2013), Pr> F should be inferior to α in order for the models to be accepted, which was well achieved in this test. Furthermore, the correlation coefficient R2 of both of the models
15
(R2 = 0.89) was higher than 0.8, thus indicating a good correlation between the predicted values and the experimental ones, as documented in Fig 4a and 4b.
Once the proposed models were accepted, the optimization of the operating parameters was possible by considering the following criteria: (1) The treatment cost should be minimized by minimizing the current intensity and the treatment time, and (2) The COD removal as well as the TOC removal should exceed 84 % in order to respect the legislation standards. Taking into account these criteria, a single solution was proposed by the Design-Expert, as shown in Table 4. Theoretically, applying 5.3 A of current intensity during 110 min of treatment time in the presence of 2 500 mg/L of EG and 7 g/L of Na2SO4 allows the removal
of 87.5 % and 89 % of COD and TOC, respectively. A triplicate assays were then carried out in order to confirm these results. It was found that experimental results for COD (91 ± 2.2 %) and TOC removal (80 ± 4 %) were close to the theoretical ones. Consequently, the operating conditions proposed in Table 4 ([EG] = 2 500 mg/L, I= 5.3 A, t= 110 min and [Na2SO4] = 7g/L) were finally defined as the optimal operating parameters allowing a
maximum EG degradation (91 ± 2.2 % of COD removal) and mineralization (80 ± 4 % of TOC removal) while maintaining a minimum cost. To seek more information, the kinetic of EG degradation under optimal operating conditions was carried out, as presented in Fig 5. According to these results, the electrochemical oxidation of EG followed a first order kinetic, thus indicating that the degradation rate of EG was subjected to pollutant concentration control (mass transfer control). The kinetic constant k was estimated to 0.02 min-1 while the half-life reaction time t1/2 was around 34.6 min.
16
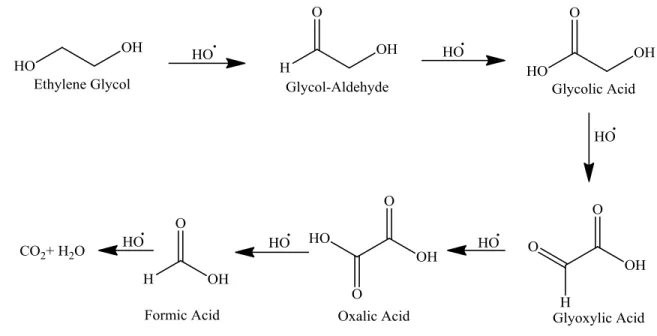
As stated earlier, the electrochemical oxidation of EG could be realized on the surface of the working anode (BDD) via OH° or in the bulk of the solution via other mediators (S2O82-,
H2O2, etc.). Consequently, different by-products such as Glycol aldehyde, Glycolic acid,
Glyoxylic acid, oxalic acid and formic acid could be generated during the degradation process. According to Dietrick McGinnis et al. (2001), the oxidation of EG by OH° radicals produced oxalic and formic acid as final by-products. Further oxidation of formic acid generated CO2 and H2O, as presented in Fig 6.
In order to confirm the generation of oxalic and formic acid during the ECO of EG under optimal conditions (I= 5.3 A, t=110 min, [EG] = 2 500 mg/L, [Na2SO4] = 7g/L), a liquid
chromatography analysis was carried out for 8 different treatment time (0, 10, 20, 40, 60, 90 and 110 min). The overall results are summarized in Table 5.
It was found that the appearance of oxalic and formic acid in the treated solution took more than 10 min. This could be explained by the insufficient of oxidants concentration (OH°, S2O82-, H2O2) capable of oxidizing EG in the beginning of the treatment. As long as the
treatment proceeded, the concentration of oxalic and formic acid reached its maximum with respectively 46 mg/L (t=90 min) and 189 mg/L (t=60 min). It is worth underlining that the amount of formic acid produced was much higher than the oxalic acid. According to Fig 5, one molecule of oxalic acid could be oxidized to two molecules of formic acid, thus doubling the concentration of this latter. In parallel, EG molecules could be also oxidized directly to formic acid rather than passing through different forms of by-products as illustrated by Wang et al. (2009). With the existing of both degradation scenarios, the concentration of formic acid will be much higher than the concentration of oxalic acid which was well confirmed in Table 5.
17
Starting from 60 min of treatment time, 37 % of formic acid was mineralized to CO2 and
H2O leading to a residual concentration of 119 mg/L at the end of the treatment. Based on
the literature, formic acid is a recalcitrant by-product that could resist to its oxidation by hydroxyl radicals (Tong et al., 2010).
4. Conclusion
This study investigated the treatment of EG solution in batch recirculation mode using electrochemical oxidation process. A boron doped diamond electrode was used as working anode while carbon felt was used as working cathode. An experimental design methodology based on factorial design (FD) and central composite design (CCD) was carried out in order to optimize the treatment process. Four different operating parameters including EG concentration, current intensity, treatment time and electrolyte type were chosen for the study. FD was applied to determine the effect of these operating parameters on EG removal. The results showed that both of the current intensity and the treatment time were the most influent parameters in the ECO of EG. In fact, current intensity and treatment time contributed respectively with 49 % and 43 % in the COD removal while they contributed respectively with 39 % and 37 % in the TOC removal. The second most important objective of the study was the optimization of the treatment process using central composite design (CCD) methodology. The best operating conditions obtained while considering the treatment cost and the legislation standards were: 5.3 A of current intensity, 110 min of treatment time, 2 500 mg/L of EG and 7 g/L of Na2SO4. Consequently, a maximum COD and TOC removal
of respectively 91 ± 2.2 % and 80 ± 4 % were obtained under these operating conditions. During the ECO treatment of EG solution, oxalic acid and formic acid were identified as by-products with a residual concentration of 40 and 119 mg/L, respectively. It was concluded
18
that only 37 % of formic acid was mineralized, indicating that the mineralization of EG was not complete. Therefore, a further increase in the current intensity or/and the treatment time is well recommended for better EG mineralization. In an economic point of view, the ECO of EG under optimal conditions costs 8.35 CAN$/m3 while its storage as hazardous substance is estimated to 300 CAN$/m3.
19
Acknowledgements
Sincere thanks are extended to the National Sciences and Engineering Research Council of Canada and Produits Chimiques Magnus Ltée for their financial support for this study (Grant number RDCPJ 445211-12).
20
References
Amalraj Appavoo, I., Hu, J., Huang, Y., Li, S.F.Y., Ong, S.L., 2014. Response surface modeling of Carbamazepine (CBZ) removal by Graphene-P25 nanocomposites/UVA process using central composite design. Water Res. 57, 270-279.
Anglada, A., Urtiaga, A., Ortiz, I., 2009. Contributions of electrochemical oxidation to waste‐water treatment: fundamentals and review of applications. J. Chem. Technol. Biotechnol. 84, 1747-1755. Araña, J., Ortega Méndez, J.A., Herrera Melián, J.A., Doña Rodríguez, J.M., González Díaz, O., Pérez Peña, J., 2012. Thermal effect of carboxylic acids in the degradation by photo-Fenton of high concentrations of ethylene glycol. Applied Catalysis B: Environmental 113-114, 107-115.
Daghrir, R., Drogui, P., Robert, D., 2012. Photoelectrocatalytic technologies for environmental applications. J. Photochem. Photobiol. A: Chem. 238, 41-52.
Daghrir, R., Drogui, P., Tshibangu, J., Delegan, N., El Khakani, M.A., 2014. Electrochemical treatment of domestic wastewater using boron-doped diamond and nanostructured amorphous carbon electrodes. Environmental Science and Pollution Research 21, 6578-6589.
Dietrick McGinnis, B., Dean Adams, V., Joe Middlebrooks, E., 2001. Degradation of ethylene glycol using Fenton's reagent and UV. Chemosphere 45, 101-108.
EC, 2001. Ethylene Glycol. Environment and Climate Change Canada.
Han, A., Pillon, G., Nichici, A., Vannes, B., Grevey, D., 2006. Study and evaluation of fretting critical slip conditions by applying the design of experiments method. Wear 261, 1080-1086.
Jardak, K., Dirany, A., Drogui, P., El Khakani, M.A., 2016. Electrochemical degradation of ethylene glycol in antifreeze liquids using boron doped diamond anode. Separation and Purification Technology 168, 215-222.
Joglekar, A., May, A., 1987. Product excellence through design of experiments. Cereal Foods World 32, 857-&.
Kim, K.N., Hoffmann, M.R., 2008. Heterogeneous photocatalytic degradation of ethylene glycol and propylene glycol. Korean J. Chem. Eng. 25, 89-94.
Louhichi, B., Bensalah, N., Gadri, A., 2008. ELECTROCHEMICAL OXIDATION OF GLYCOLS ON BORON-DOPED DIAMOND ANODES. Environ. Eng. Sci. 18, 231-237.
McGinnis, B.D., Adams, V.D., Middlebrooks, E.J., 1999. Evaluation of methylene blue and riboflavin for the photosensitized degradation of ethylene glycol. Environ. Int. 25, 953-959.
Muhamad, M.H., Sheikh Abdullah, S.R., Mohamad, A.B., Abdul Rahman, R., Hasan Kadhum, A.A., 2013. Application of response surface methodology (RSM) for optimisation of COD, NH< sub> 3</sub>–N and 2, 4-DCP removal from recycled paper wastewater in a pilot-scale granular activated carbon sequencing batch biofilm reactor (GAC-SBBR). J. Environ. Manage. 121, 179-190.
Orecki, A., Tomaszewska, M., Karakulski, K., Morawski, A.W., 2006. Separation of ethylene glycol from model wastewater by nanofiltration. Desalination 200, 358-360.
Rajeshwar, K., Ibanez, J.G., 1997. Environmental electrochemistry: Fundamentals and applications in pollution sensors and abatement. Academic Press.
21
Staples, C.A., Williams, J.B., Craig, G.R., Roberts, K.M., 2001. Fate, effects and potential environmental risks of ethylene glycol: a review. Chemosphere 43, 377-383.
Tong, S., Shi, R., Zhang, H., Ma, C., 2010. Catalytic performance of Fe 3 O 4-CoO/Al 2 O 3 catalyst in ozonation of 2-(2, 4-dichlorophenoxy) propionic acid, nitrobenzene and oxalic acid in water. Journal of Environmental Sciences 22, 1623-1628.
Wang, H., Jusys, Z., Behm, R.J., 2009. Adsorption and electrooxidation of ethylene glycol and its C2 oxidation products on a carbon-supported Pt catalyst: A quantitative DEMS study. Electrochimica Acta 54, 6484-6498.
22
Fig.1 Electrolytic reactor design; Plexiglas tank (1), peristaltic recycling pump (2), electrolytic
23
Fig. 2 Contribution of current intensity, treatment time, pollutant concentration, and
electrolyte type on COD removal using FD methodology. 0 5 10 15 20 25 30 35 40 45 50 b1: Current intensity (A) b2: Treatment time (min) b 3 :EG concentration (mg/L) b 4 :Electrolyte type b12: Intensity - Time
Con
tr
ibuti
on (COD r
em
oval)
contribution (%)24
Fig. 3. Contribution of current intensity, treatment time, pollutant concentration, and
electrolyte type on TOC removal using FD methodology. 0 5 10 15 20 25 30 35 40 b1: Current intensity (A) b2: Treatment Time (min) b3: EG concentration (mg/L) Tb1: Electrolyte Type b12: Intensity-Time
Con
tr
ibuti
on
T
OC
rem
oval (
%
)
Contribution (%)Fig. 4 Comparison between actual and predicted values for (a) COD removal and (b) TOC removal using CCD methodology.
Design-Expert® Software DCO
Color points by value of DCO: 96.9 25 Actual P redi c ted Predicted vs. Actual 25.00 43.00 61.00 79.00 97.00 25.00 42.98 60.95 78.93 96.90 Design-Expert® Software TOC
Color points by value of TOC: 96 8.1 Actual P redi c ted Predicted vs. Actual 8.00 31.00 54.00 77.00 100.00 8.10 30.89 53.68 76.47 99.26 (a) (b)
25
Fig. 5 Kinetic of EG degradation under optimal operating conditions of ECO process (I= 5.3 A, t=110 min, [EG] = 2 500 mg/L, [Na2SO4] = 7g/L).
y = 0,0209x R² = 0,9601
0
0,5
1
1,5
2
2,5
0
20
40
60
80
100
120
Ln
(COD
0/COD
t)
Time (min)
26
27
Tables
Table 1. Experimental range and levels of independent process variables using FD
methodology. Coded variables (Xi) Factor (Ui) Experimental Field Ui,0 ∆Ui
Min value Max value
(-1) (+1)
X1 U1 : Concentration (mg/L) 2 500 3500 3 000 500
X2 U2 : Intensity (A) 3 6 4.5 1.5
X3 U3 : Time (min) 60 120 90 30
28
Table 2. Experimental factorial matrix in the 24 design in FD methodology.
Assays Experiment Design Experiment Plan Results
X1 X2 X3 X4 U1 (mg/L) U2 (A) U3 (min) U4 COD removal (%) TOC removal (%) 1 -1 -1 -1 -1 2500 3 60 Na2SO4 43.3 49.2 2 -1 -1 1 -1 2500 3 120 Na2SO4 72.3 68.3 3 -1 1 -1 -1 2500 6 60 Na2SO4 67.6 55.4 4 -1 1 1 -1 2500 6 120 Na2SO4 93.6 94.1 5 -1 -1 -1 1 2500 3 60 NaCl 41.4 10.5 6 -1 -1 1 1 2500 3 120 NaCl 68.3 53.2 7 -1 1 -1 1 2500 6 60 NaCl 72.8 45.5 8 -1 1 1 1 2500 6 120 NaCl 80.0 87.1 9 1 -1 -1 -1 3500 3 60 Na2SO4 35.0 8.3 10 1 -1 1 -1 3500 3 120 Na2SO4 63.2 39.4 11 1 1 -1 -1 3500 6 60 Na2SO4 61.2 45.3 12 1 1 1 -1 3500 6 120 Na2SO4 84.4 87.8 13 1 -1 -1 1 3500 3 60 NaCl 28.0 8.1 14 1 -1 1 1 3500 3 120 NaCl 50.0 22.8 15 1 1 -1 1 3500 6 60 NaCl 57.6 34.5 16 1 1 1 1 3500 6 120 NaCl 83.0 61.2
29
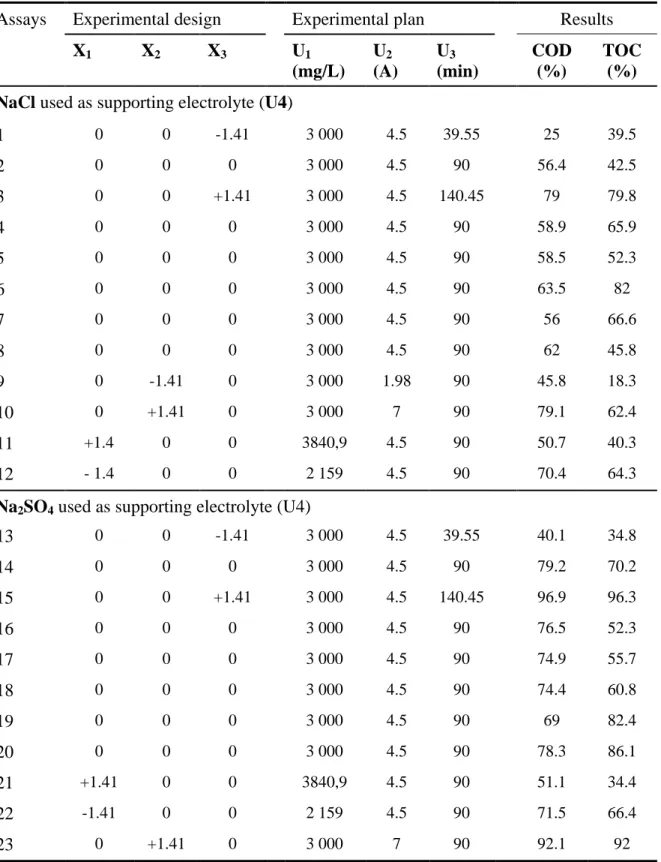
Table 3. Central composite matrix and experimental results
Assays Experimental design Experimental plan Results
X1 X2 X3 U1 (mg/L) U2 (A) U3 (min) COD (%) TOC (%) NaCl used as supporting electrolyte (U4)
1 0 0 -1.41 3 000 4.5 39.55 25 39.5 2 0 0 0 3 000 4.5 90 56.4 42.5 3 0 0 +1.41 3 000 4.5 140.45 79 79.8 4 0 0 0 3 000 4.5 90 58.9 65.9 5 0 0 0 3 000 4.5 90 58.5 52.3 6 0 0 0 3 000 4.5 90 63.5 82 7 0 0 0 3 000 4.5 90 56 66.6 8 0 0 0 3 000 4.5 90 62 45.8 9 0 -1.41 0 3 000 1.98 90 45.8 18.3 10 0 +1.41 0 3 000 7 90 79.1 62.4 11 +1.4 0 0 3840,9 4.5 90 50.7 40.3 12 - 1.4 0 0 2 159 4.5 90 70.4 64.3
Na2SO4 used as supporting electrolyte (U4)
13 0 0 -1.41 3 000 4.5 39.55 40.1 34.8 14 0 0 0 3 000 4.5 90 79.2 70.2 15 0 0 +1.41 3 000 4.5 140.45 96.9 96.3 16 0 0 0 3 000 4.5 90 76.5 52.3 17 0 0 0 3 000 4.5 90 74.9 55.7 18 0 0 0 3 000 4.5 90 74.4 60.8 19 0 0 0 3 000 4.5 90 69 82.4 20 0 0 0 3 000 4.5 90 78.3 86.1 21 +1.41 0 0 3840,9 4.5 90 51.1 34.4 22 -1.41 0 0 2 159 4.5 90 71.5 66.4 23 0 +1.41 0 3 000 7 90 92.1 92
30
31
Table 4. Comparison between theoretical and experimental results during the oxidation of EG by
ECO process under optimal conditions (I= 5.3 A, t=110 min, [EG] = 2 500 mg/L, [Na2SO4] = 7g/L).
Solution Factors Theoretical
Results Experimental Results U1 (mg/L) U2 (A) U3 (min) U4 COD removal (%) TOC removal (%) COD removal (%) TOC removal (%) 2500 5.3 110 Na2SO4 87.5 89 91 ± 2.2 80 ± 4
32
Table 5. Identification and quantification of EG by-products produced during ECO
treatment of EG under optimal conditions (I= 5.3 A, t=110 min, [EG] = 2 500 mg/L, [Na2SO4] = 7g/L). Treatment time (min) Oxalic acid (mg/ L) Formic acid (mg/ L) 0 < 10 < 10 10 < 10 < 10 20 11 86 30 20 131 40 26 157 60 38 189 90 46 171 110 40 119
![Fig. 5 Kinetic of EG degradation under optimal operating conditions of ECO process (I= 5.3 A, t=110 min, [EG] = 2 500 mg/L, [Na 2 SO 4 ] = 7g/L)](https://thumb-eu.123doks.com/thumbv2/123doknet/2941574.79219/27.918.152.781.151.613/fig-kinetic-degradation-optimal-operating-conditions-eco-process.webp)