Removal of Macro-pollutants in Oily Wastewater Obtained from
Soil Remediation Plant Using Electro-oxidation Process
Mehdi Zolfaghari a, Patrick Drogui a*, Jean François Blais a
a Institut National de la Recherche Scientifique, Eau, Terre et Environnement (INRS-ETE), Université du Québec, 490 rue de la Couronne, Québec, QC, Canada, G1K 9A9.
* Corresponding author
Author email: [email protected] [email protected] [email protected] September 2017 1 2 3 4 5 6 7 8 9 10 11 12 13 14 15 16 17 18 19 20 21 22 23 24 25 26 27 28 29 30 31 32 33 34 35 36 37 38 39 40 41 42 43 44 45 46 47 48 49 50 51 52 53 54 55 56 57 58 59 60 61
Abstract
Electro-oxidation process by Niobium boron-doped diamond (Nb/BDD) electrode was used to treat non-biodegradable oily wastewater provided from soil leachateed contaminated by hydrocarbons. Firstly, the diffusion current limit and mass transfer coefficient was experimentally measured (7.1 mA cm-2 and 14.7 µm s-1, respectively), in order to understand minimum applied current density. Later on, the oxidation kinetic model of each pollutant was investigated in different current densities ranged between 3.8 to 61.5 mA cm-2. It was observed that direct oxidation was the main removal mechanism of organic and inorganic carbon; while, the indirect oxidation in higher current density was responsible for nitrogen oxidation. Hydrocarbon in the form of colloidal particles could be removed by electro-flotation. On the other hand, electro-decomposition on the surface of cathode and precipitation by hydroxyl ions were the utmost removal pathway of metals. According to the initial experiments, operating condition was further optimized by central composite design model in different current density, treatment time, and electrolyte addition, based on the best responses on the specific energy consumption (SEC), chemical oxygen demand (COD) and total organic carbon (TOC) removal efficiency. Under optimum operating condition (current density = 23.1 mA cm-2, time = 120 min, Ti/Pt as a cathode and Nb/BDD as the anode), electro-oxidation showed the following removal efficiencies: COD (84.6%), TOC (68.2%), oil and grease (99%), Color (87.9%), total alkalinity (92%), Ntot (18%), NH4+ (31%), Ca (66.4%), Fe (71.1%), Mg (41.4%), Mn (78.1%), Ptot (75%), S (67.1%), and Si (19.1%).
Keywords:
Oily wastewater; Electro-oxidation process; Oxidation kinetics; Optimization. 4 5 6 7 8 9 10 11 12 13 14 15 16 17 18 19 20 21 22 23 24 25 26 27 28 29 30 31 32 33 34 35 36 37 38 39 40 41 42 43 44 45 46 47 48 49 50 51 52 53 54 55 56 57 58 59 60 61
Nomenclature
BDD Boron-doped diamond
BOD Biochemical Oxygen Demand CCD Central Composite Design
CD Current Density
COD Chemical Oxygen Demand Ilim Diffusion Current Limit EC Electrical Conductivity FD Factorial Design
ɳ Instant Current Efficiency
OWW Oily Wastewater
SEC Specific Energy Consumption TA Total Alkalinity
TCU True Color Unit TOC Total Organic Carbon 4 5 6 7 8 9 10 11 12 13 14 15 16 17 18 19 20 21 22 23 24 25 26 27 28 29 30 31 32 33 34 35 36 37 38 39 40 41 42 43 44 45 46 47 48 49 50 51 52 53 54 55 56 57 58 59 60 61
1 Introduction
Produced water from the petroleum refinery, oil storage and transportation, petrochemical industry, oil-drilling mud and oily contaminated soil leachate are categorized as the oily wastewater (OWW) (Yu et al. 2017). These wastewaters mostly contains high concentration of hydrocarbons, phenols, sulfides, heavy metals and ammonia (NH3) with very high toxicity (Skban Ibrahim et al. 2014). Although utilization of specific strains of microorganism could potentially remove prevalent hydrocarbon compounds (Tazari et al. 2017), lack of biodegradable organic carbon and phosphorous brings challenges for the biological treatment processes (Yu et al. 2017). Additionally, physical separation such as, API oil-water separator and dissolved air flotation has deficiency for proper removal of fine colloids hydrocarbon with diameter of 0.1-100 µm (Al-Shamrani et al. 2002, Santos et al. 2006).
Simplicity of process, ease of operation, minimal sludge production, brief retention time and high performance in the oxidation of macro and micro-pollutants makes electro-oxidation process one of the best treatment option for treatment of non-biodegradable industrial wastewater such as, oily wastewater, landfill leachate, textile dye, pulp and paper and aquaculture saline water (Bashir et al. 2013, da Silva et al. 2013, Díaz et al. 2011, Drogui et al. 2007, Zolfaghari et al. 2016). Electro-oxidation used not only used for low quantity wastewater with high electrical conductivity (EC), but also it used asfor treatment of light wastewater with COD below 800 mg L-1(da Silva et al. 2013) or as the post treatment of municipal wastewater treatment plant with low energy consumption (4.3 kWh m-3) (Cao et al. 2016). In this case, energy consumption could be cut off by the addition of salt such as NaCl and Na2SO4 (Chen 2004, Díaz et al. 2011, Panizza &Martinez-Huitle 2013). 4 5 6 7 8 9 10 11 12 13 14 15 16 17 18 19 20 21 22 23 24 25 26 27 28 29 30 31 32 33 34 35 36 37 38 39 40 41 42 43 44 45 46 47 48 49 50 51 52 53 54 55 56 57 58 59 60 61
Basically anode materials are made up special composites that produce hydroxyl radicals (OH˚) instead of oxygen (Yavuz et al. 2010). Anodic pollutants oxidation on the surface of electrode and in the interface by OH˚ was called direct oxidation (Anglada et al. 2011, Bashir et al. 2013, Cao et al. 2016). In higher current density (CD) ions and water molecule are electrochemically react with OH˚ or directly on the surface of anode to generate mediator radicals, such as hypochlorous acid (HClO), peroxydisulfuric acid (H2S2O8), hydrogen peroxide (H2O2), and ozone (O3) that oxidized the pollutants. The only removal pathway of NH4+ was through indirect oxidation by HClO (Díaz et al. 2011, Ighilahriz et al. 2013, Li &Liu 2009).
Compare to the other mixed metal oxide electrodes (da Silva et al. 2013), non-active BDD electrode hasshows the highest performance on hydroxyl radical generation (Zhou et al. 2016); as it showsdue to low adsorption enthalpy of OH˚(Martínez‐Huitle &Brillas 2008). For example, the reaction rate of phenol and COD oxidation rate using BDD was 12 times higher than Ru-MMO electrode, even though the current density was four times smaller (Yavuz et al. 2010). In this study, the oxidation mechanisms of all macro-contaminants were firstly investigated by focusing on their kinetic studies. Later on, the effect of operating conditions was investigated on the process performance. Finally, the operating condition was optimized according to the best oxidation performance and energy consumption.
4 5 6 7 8 9 10 11 12 13 14 15 16 17 18 19 20 21 22 23 24 25 26 27 28 29 30 31 32 33 34 35 36 37 38 39 40 41 42 43 44 45 46 47 48 49 50 51 52 53 54 55 56 57 58 59 60 61
2 Material and Methods
2.1 Oily wastewater
OWW was taken from the leachate of soil remediation plant, located in 5 km North of Quebec City, QC, Canada. The treatment plant received soil from the nearby site, which was heavily contaminated by crude petroleum. Prior to release into the environment, the soil leachate introduced to a primary settling tank for suspended solid (SS) removal, followed by peat filtration for the adsorption of humic substances and granular activated carbon for the removal of recalcitrant hydrocarbon. In 10th of May 2016, 60 liters of sample was taken directly from primary settling tank, instantly keeping in cold room with temperature of 4˚C, before the experiments. According to the characteristic of OWW presented in Table 1, the current treatment facility should be modified to remove effectively residual NH3, metals and total organic carbon (TOC). Deficiency of biological treatment was inevitable, due to the low ratio of BOD/COD and lack of phosphorous. Deposition of suspended solidSS on the surface of electrodes negatively influences the oxidation by increasing the electrical resistance; yet, its concentration was insignificant after the primary settling tank.
2.2 Experimental pilot
The electrochemical oxidation pilot was made up two Plexiglas containers in close loop: (1) reaction tank with dimension of (14 × 5 × 10 cm), (2) and a 500 mL storage tank. The rectangular anode/cathode electrode made up niobium coated with 4 µm of boron doped diamond (Nb/BDD) (provided by DiaChem®, Germany) and titanium coated with platinum (Ti/Pt) with the thickness of 0.1 cm, specific surface area of 130 cm2 and inter-electrode gap of 1 cm were used. Coating of BDD on the surface of Nb was performed by hot filament chemical 4 5 6 7 8 9 10 11 12 13 14 15 16 17 18 19 20 21 22 23 24 25 26 27 28 29 30 31 32 33 34 35 36 37 38 39 40 41 42 43 44 45 46 47 48 49 50 51 52 53 54 55 56 57 58 59 60 61
vapor deposition in presence of KFe(CN)6 under acidic condition. Niobium was also selected as
the base metal, due to its high corrosion resistance, working in high temperature and high adhesion capability (Yu et al. 2013). Furthermore, BDD coating showed Nb/BDD was selected, because of high corrosive resistance, low hydroxyl radical adsorption properties, stable chemical properties and high catalytic activity (Chen 2004, Panizza et al. 2001). Stability of BDD coating was proved in this study, as the concentration of Boron was changed insignificantly during all sets of experiment (Table 1). Likewise, Ti/Pt was selected as the cathode type, due to its resistance toward nitrate reduction into ammonia (Ding et al. 2015). The electric current was provided by a DC power supply (Sorensen DCS40-75E, Magna-Power Electronics Inc., Flemington, New Jersey, USA). In order to maximized the mass transfer rate, the recycling flow rate was kept around 190 mL min-1 by a peristaltic pump (Masterflex L/S, Cole-Parmer Co., Montreal, QC, Canada) (Skban Ibrahim et al. 2014). Due to the metal electrodeposition and/or precipitation on the surface of cathode, it the electrodes submerged in the solution of 5% hydrochloric acid for 30 min after each experiment.
2.3 Experimental design
Kinetic studies were performed in different current density from 3.8 to 61.5 mA cm-2, in order to calculate the diffusion current limit (Ilim), mechanism of macro-pollutant oxidation and proper range of operating condition. Two main operating regimes control the oxidation of organic matter: (1) electronic transfer control; and (2) mass transport control (Panizza &Martinez-Huitle 2013). In low current density, electronic transfer controlled the oxidation rate, resulted in zero-order kinetics of COD oxidation. If COD oxidation followed first-zero-order kinetic, oxidation was mainly controlled by mass transfer. By knowing the fact that instant current efficiency (ɳ) 4 5 6 7 8 9 10 11 12 13 14 15 16 17 18 19 20 21 22 23 24 25 26 27 28 29 30 31 32 33 34 35 36 37 38 39 40 41 42 43 44 45 46 47 48 49 50 51 52 53 54 55 56 57 58 59 60 61
decreases below 1 for current density larger than Ilim (equation 1), it gradually decreased to reach ɳ = 1. Kinetics of COD oxidation in Ilim was used for experimental estimation of Km, based on equation 2:
ɳ = 4𝐹𝑉𝑅(𝐶𝑂𝐷𝑡−𝐶𝑂𝐷0)
𝐼𝑡 (1)
𝐼𝑙𝑖𝑚 = 4𝐹𝐴𝐾𝑚𝐶𝑂𝐷(𝑡) = 4𝐹𝐴𝐾𝑚𝐶𝑂𝐷0exp (−𝑘𝑡) (2)
Where, F stands for Faraday’s constant (96,487 C mol-1), COD0 and CODt are initial and final concentration (mol. L-1), t is the time of reaction, A is the surface of anode (m2), and VR is the volume of wastewater (L) (Boye et al. 2004).
The kinetic study was performed by measuring the residual COD, TOC, Ntot, NO3- and NH4+ for each sample taken in specific period of time (5, 10, 20, 30, 45, 60, 90, 120 min). Na2SO4 with concentration of 1 g L-1 was inserted to increase the electrical conductivity from the average 2.75 to 4.89 ms cm-1. The addition of electrolyte decreased the applied electric potential, consequently decreased the energy consumption.
For understanding the statistical significance of variable parameters such as, current density (X1), treatment time (X2) and addition of electrolyte (X3), factorial design (FD) was used with specific energy consumption, COD and TOC removal efficiency as the responses. The condition of FD experiments was fixed in extreme limit with eight sets of experiments. Additional eighteen sets of experiments at the center of domain and axial assays for each categorical factor were performed for process optimization by central composite design (CCD). All the conditions and results of FD and CCD models were provided in Table 2.
4 5 6 7 8 9 10 11 12 13 14 15 16 17 18 19 20 21 22 23 24 25 26 27 28 29 30 31 32 33 34 35 36 37 38 39 40 41 42 43 44 45 46 47 48 49 50 51 52 53 54 55 56 57 58 59 60 61
In FD, the effect of each factor and their interaction was estimated according to the following model (Equation 3):
𝑌 = 𝑏0+ 𝑏1𝑋1+ 𝑏2𝑋2+ 𝑏3𝑋3+ 𝑏12𝑋12+ 𝑏13𝑋13+ 𝑏23𝑋23 (3)
In which Y is the experimental response, b0 is the average value of response, Xi is the variables, bi stands for effect of each factor and finally bij represents interaction effect of variable i and j on response. Experimental coefficient (b) was measured using half difference between arithmetic averages of the responses for extreme values of variable. For the process optimization, CCD model was performed by means of 26 experiments, and which later estimated the result by second order model (Equation 4).
𝑌 = 𝑏0+ 𝛴𝑏𝑖𝑋𝑖+ 𝛴𝑏𝑖𝑖𝑋𝑖2+ 𝛴𝑏
𝑖𝑗𝑋𝑖𝑋𝑗+ 𝑒𝑖 (4)
In whichequation 4, bi, bii and bij are the liner, quadratic and interactive effects of specified variable and ei represents the residual term. Design expert software (Design Expert 7, State-Ease Inc., Minneapolis, USA) was used to calculate the coefficients of polynomial model.
The specific energy consumption (kWh kg COD-1) was calculated according to the following equation: 𝑆𝐸𝐶 = 𝑉 𝐼𝛥𝑈𝑡 𝑅(𝐶𝑂𝐷𝑡−𝐶𝑂𝐷0) (5) 4 5 6 7 8 9 10 11 12 13 14 15 16 17 18 19 20 21 22 23 24 25 26 27 28 29 30 31 32 33 34 35 36 37 38 39 40 41 42 43 44 45 46 47 48 49 50 51 52 53 54 55 56 57 58 59 60 61
Where I stand for current intensity (A), ΔU is the average cell voltage (V), t is the treatment time (h), and COD unit is g L-1(Skban Ibrahim et al. 2014).
2.4 Sampling and analysis
Samples from electro-oxidation reactor were kept frozen at -18°C, prior to analysis. COD and color was measured by spectrophotometer (Cary 50, Varian Canada Inc., Mississauga, ON, Canada). TOC and Ntot were analyzed using a Shimadzu TOC 5000A/ TNM-L analyzer (Shimadzu Co., Laval, Qc, Canada). Lachat Instrument was used for analyzing ammonium (NH4+), nitrite (NO2-), nitrate (NO3-) and ortho-phosphate (PO43-) assimilated by QuikChem method 10-107-06-2-B, 10-107-4-2-A and 10-115-01-1-B, respectively. Total alkalinity (TA) was analyzed based on colorimetric titration with 0.02 N of sulfuric acid solution in the presence of methyl orange. Around 15 mL of each sample was digested by 3 mL of hydrogen peroxide in the presence of 2 mL of nitric acid before inserting into the ICP/MS for the metal analysis. The procedure of extraction and analysis of metal are fully describe in previous studies (Zolfaghari et al. 2016). 4 5 6 7 8 9 10 11 12 13 14 15 16 17 18 19 20 21 22 23 24 25 26 27 28 29 30 31 32 33 34 35 36 37 38 39 40 41 42 43 44 45 46 47 48 49 50 51 52 53 54 55 56 57 58 59 60 61
3 Results and Discussion
3.1 Estimation of limiting current density
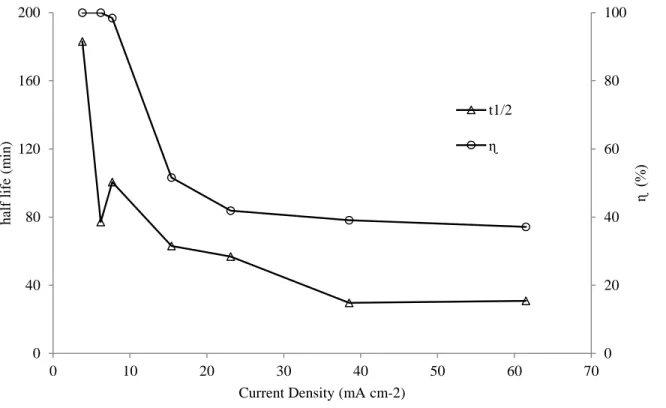
While working under galvanostatic conditions, it can be possible to identify two different operating regimes; i) electronic transfer control and ii) mass transport control. Ilim is the current intensity for which the rate of pollutant removal is maximal (Equation 2). When the electrolysis is under current control (I Ilim), the instantaneous current efficiency is equal to 100% and COD removal rate of COD removal is constant. However, when the electrolysis is under mass transport control (IIlim), the applied current density exceed the limiting current density and secondary reactions (such as oxygen evolution) takes place, resulting in a decrease of the instantaneous current efficiency (). Energy consumption is the most decisive factor in the selection of advanced oxidation processes. Increasing the efficiency of the process is the main objective that measured by gradual increase of current density. Experimental calculation of Ilim and Km requires calculation of ɳ in different range of current density. According to the results presented in Figure 1, the limited current density occurred at 6.2 mA cm-2, as the ɳ was becoming so close to 100%. By considering the homogenous first-order kinetic constant rate in Ilim (Equation 2), the calculated value of Km was around 14.7 µm s-1 which that was close to the value of 10 (Körbahti &Artut 2010), 17.5 (Anglada et al. 2011) and 30 µm s-1 (Panizza &Martinez-Huitle 2013) reported in literature. It is worth mentioning that in current intensity below Ilim no side reaction was happening, resulting in insignificant ammonia oxidation. Therefore, Ilim was considered as the minimum range for current intensity.
4 5 6 7 8 9 10 11 12 13 14 15 16 17 18 19 20 21 22 23 24 25 26 27 28 29 30 31 32 33 34 35 36 37 38 39 40 41 42 43 44 45 46 47 48 49 50 51 52 53 54 55 56 57 58 59 60 61
3.2 Organic and inorganic carbon removal
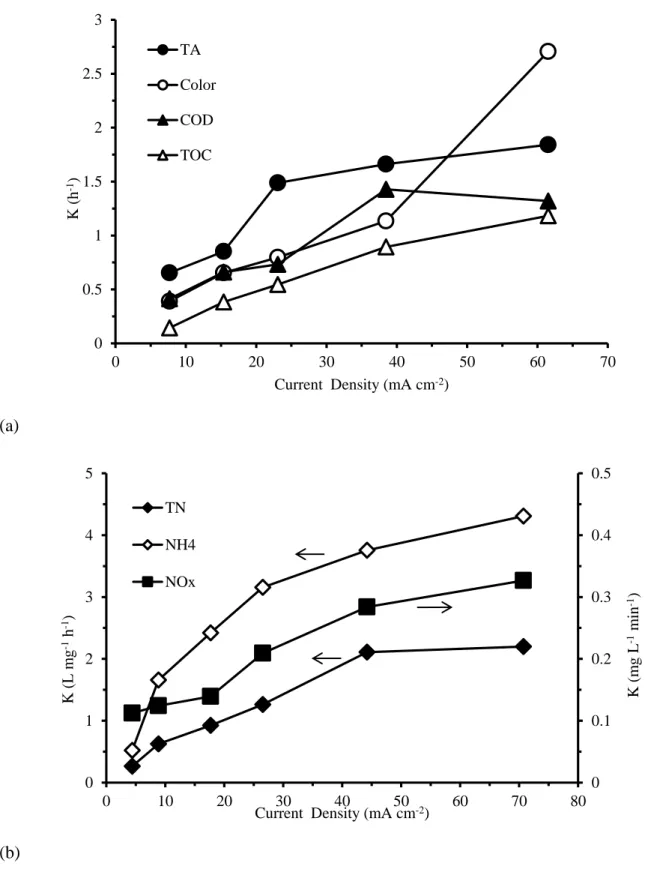
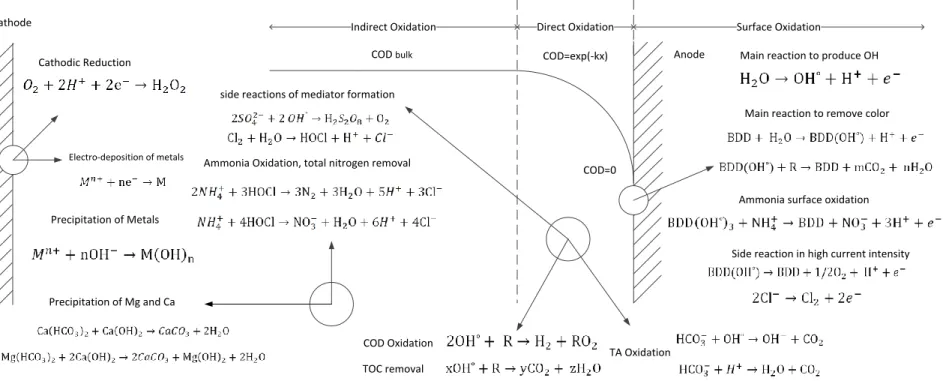
Mechanisms of electro-oxidation of each macro-pollutant could be interpreted by its kinetic model. For Iapp < Ilim, operating regime was under current intensity control in which the rate of pollutant oxidation was constant (Díaz et al. 2011). In the case of our experiment, oxidation rate was always controlled by mass transfer. According to the results (showed in supplement: Table 1-S), oxidation of carbon macro-pollutants include COD, TOC, color, and TA perfectly described by the pseudo first order kinetics with R2 of 90% for all current density (Anglada et al. 2011, Bashir et al. 2013, Urtiaga et al. 2009). As illustrated in Figure 2.a, by increasing CD from 7.7 to 38.5 mA cm-2, oxidation half-life decreased rapidly, followed by gradual increase till 61.5 mA cm-2. This trend was also detected in previous studies for the treatment of refinery wastewater (Ighilahriz et al. 2013, Skban Ibrahim et al. 2014). As it shown in Figure 3, oxidation occurs in three different sections: (1) direct electric oxidation on the surface of anode (Espinoza et al. 2016), (2) OH˚ oxidation in the interface with formation potential of 2.8 V (3) bulk or indirect oxidation by mediators, such as HClO with E˚= 1.48 V and H2S2O8 with E˚= 2.10 V (Espinoza et al. 2016, Panizza et al. 2001). Increase current density more than its critical value, caused side reaction of O2 and Cl2 production instead of hydroxyls radical on the surface of anode (Santos et al. 2006). Although it decreased dramatically the ɳ, yet, additional indirect oxidation increased the constant rate of carbon oxidation. The half-life oxidation of COD, for example was between 30 to 100 min for the current density of 38.5 and 7.7 mA cm-2, respectively. As shown in Figure 3, oxidation of water molecule on the surface of BDD resulted in simultaneous production OH˚, and H+. Alkalinity includes CO32- and HCO3- was acted as the buffer and neutralized the excess protons; therefore, for the first hour of the reaction pH remained unchanged (the result is presented in Figure 1-S). Furthermore, reaction of alkalinity 4 5 6 7 8 9 10 11 12 13 14 15 16 17 18 19 20 21 22 23 24 25 26 27 28 29 30 31 32 33 34 35 36 37 38 39 40 41 42 43 44 45 46 47 48 49 50 51 52 53 54 55 56 57 58 59 60 61
with OH˚, O3, and H2O2 at the beginning of operation led to the production of OH-, which even raised pH in the first thirty minutes of the experiment (Ighilahriz et al. 2013, Zhou et al. 2016). Previous studies showed that oxidation rate constant was enhanced in higher pH, since it induced generation of more OH˚ from mediator in the bulk (Alizadeh Kordkandi &Mohaghegh Motlagh 2017). Both reactions resulted in rapid oxidation rate with half-life of 25-64 min for the current density of 38.5 and 7.7 mA cm-2, respectively. TOC, on the other hand, had the lowest kinetic constant (between 0.14 to 0.89 h-1), as the total mineralization of organic carbon to CO2 was required. Finally, electro-floatation led to have complete removal hydrophobic oil and grease (O&G) in very short time. Oxygen as a side reaction in anode, and hydrogen in cathode, produced fine bubbles range from 15 to 60 µm in the anode and 8-15 µm in the cathode that attached to the pollutants, floated them on the surface (Drogui et al. 2007, Santos et al. 2006). It worth mentioning that rate of electro-flotation rapidly increased in higher current density; yet it had insignificant effect on TOC and COD kinetic rate in our case due to small share of O&G from total organic carbon (11%) (Santos et al. 2006). Complete removal of total petroleum hydrocarbon in just 24 min was also reported in previous studies by CD of 30 mA cm-2(Rocha et al. 2012, Skban Ibrahim et al. 2014).
3.3 Nitrogen removal
In electro-oxidation process, ammonia is only removed by reaction with HClO or ClO- to produce chloramines (Figure 3). As you can see in Table 1, decrease in concentration of chlorine by 90% was result of its reaction with ammonia. As the concentration of HClO should be considered in ammonia oxidation, Ntot and NH4+ oxidation were fitted with second-order reaction with R2 of 95% for the current density higher than 7.7 mA cm-2; yet, production of NO3- from oxidation of NH4+, followed zero order kinetic. As the reaction on the surface of electrode 4 5 6 7 8 9 10 11 12 13 14 15 16 17 18 19 20 21 22 23 24 25 26 27 28 29 30 31 32 33 34 35 36 37 38 39 40 41 42 43 44 45 46 47 48 49 50 51 52 53 54 55 56 57 58 59 60 61
followed the zero-order kinetics (Figure 2.b), it could be deduced that production of nitrate mainly happened by the oxidation of ammonia on the surface of electrode. On the other hand, indirect oxidation by HClO in the bulk frequently targeted NH4+ oxidation into nitrogen gases (N2) (Cao et al. 2016, Ighilahriz et al. 2013, Li &Liu 2009). Therefore, Ntot and NH4+ was followed the second-order reaction (Díaz et al. 2011). If the operating condition was not in favor indirect oxidation (in acidic pH, low current density and Cl- concentration), linear profile of nitrogen oxidation (zero order kinetic) was detected (Díaz et al. 2011).
Half-life of carbon pollutant oxidation was at least ten times faster than nitrogen pollutants half-life (3 to 24 h) in different current densities. Low oxidation rates of NH4+ and Ntot were also reported in previous studies (Urtiaga et al. 2009).
3.4 Metal removal
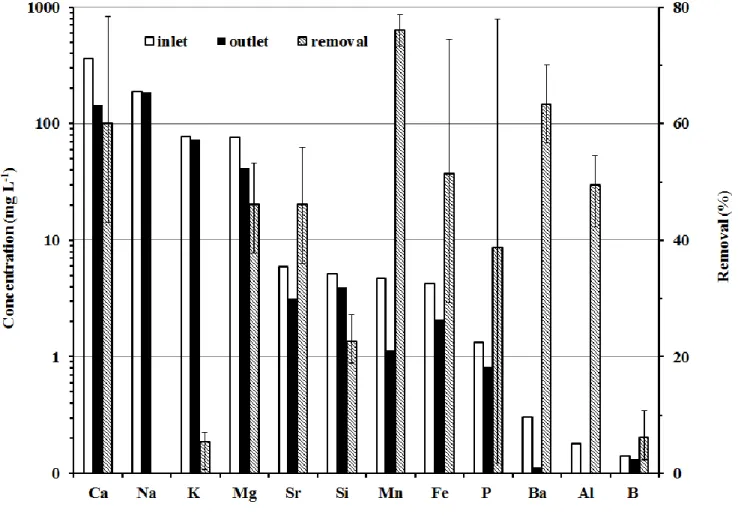
Unlike nitrogen, inorganic and organic nitrogen and carbon, metals should be reduced on the cathode by electro-deposition. Metal precipitation by hydroxide ions (OH-) was the second pathway of metal removal, especially in higher current density. According to Figure 3, Mg and Ca were precipitated in the presence of OH- produced by bicarbonate oxidation. Therefore, removal efficiency more than 50% was expected for both Mg and Ca. In lower current density, initial sulfur concentration rarely changed; yet in current density higher than 23.1 mA cm-2, sulfate ions was transformed to H2S2O8 by reaction with OH˚, dramatically reduced average S concentration from 372 to 121 mg L-1 (Table 1). It is possible that metal cations formed a solid complex with S2O82- ions(Dvorak et al. 1992). For the metal with no interaction with anions, electro-deposition was the basic removal pathway. As respect of their positive charge, they readily adsorbed on the surface of cathode and reduced to free metal. According to Figure 4, 4 5 6 7 8 9 10 11 12 13 14 15 16 17 18 19 20 21 22 23 24 25 26 27 28 29 30 31 32 33 34 35 36 37 38 39 40 41 42 43 44 45 46 47 48 49 50 51 52 53 54 55 56 57 58 59 60 61
except Na, K, B and Si, removal efficiencies of metal were larger than 50% using different current intensities. In comparison with Fe, Mg, Mn and Ca, no removal of highly reactive metal such as B, Na and K was reported in literatures (da Silva et al. 2013, Rocha et al. 2012).
Silicon was mostly found in colloids and suspended solid, due to leaching of silica from the soil. Although, organic matter aggregates were easily broken, decreasing the turbidity (Table 1) (Santos et al. 2006), inorganic particles was basically inactive toward reduction; so, removal efficiency of silicon was very low and fluctuated between 19 to 26% in different operating condition (Figure 4). As the concentration of metal, alkalinity, and sulfate was decreased, electrical conductivity was gradually decreased throughout the experiment (the result is presented in Figure 2-S).
3.5 Process
o
ptimizationType of electrodes, current density, electrolyte addition, recycling flow rate and pH are among the most important factors on the energy consumption and performance of electro-oxidation. To have the highest performance, type of electrode and circulation flow rate was fixed. Moreover, fixing pH was not recommended, due to its operational obstacle. Therefore, current density, treatment time and electrolyte addition wasere the only variables for the optimization.
In order to having COD below discharge regulation (160 mg L-1), the range of 23-38.5 mA cm-2 of current density, 1-2 hours of treatment time was selected. FD model was run for eight sets of experiments to figure out the following models for SEC, COD and TOC removal (Equation 6-8):
𝐶𝑂𝐷 𝑅𝐸(%) = 70.21 + 9.14 X1+ 9.92 X2− 5.65 X3− 1.58 X12+ 5.38 X13 4 5 6 7 8 9 10 11 12 13 14 15 16 17 18 19 20 21 22 23 24 25 26 27 28 29 30 31 32 33 34 35 36 37 38 39 40 41 42 43 44 45 46 47 48 49 50 51 52 53 54 55 56 57 58 59 60 61
R2= 0.996 (6)
𝑇𝑂𝐶 𝑅𝐸(%) = 53.70 + 9.33 X1+ 15.34 X2− 8.27 X3+ 3.17 X13 + 2.45 X23
R2= 0.990 (7)
𝑆𝐸𝐶 (𝑘𝑊ℎ/𝑘𝑔𝐶𝑂𝐷) = 100.37 + 20.86 X1+ 19.82 X2− 19.22 X3 + 7.33 X12 − 11.19 X13
R2= 0.993 (8)
The predicted correlation coefficients were 0.94, 0.84, 0.89, respectively, which exceeded 0.8, showed high predictability of models. Based on Pareto chart (Figure 2-S), influence of each factors and their interaction on the responses were fully described. As shown in Figure 5, and Table 2 treatment time had the largest effect on COD removal efficiency. Effect of this factor on TOC removal efficiency was more pronounced. As it expected, electrolyte addition had significant effect on the energy consumption. Strangely, this factor negatively affected COD and TOC removal efficiency (Equations 6 and 7), even though it claimed that addition of electrolyte was conductive for oxidation rate (Skban Ibrahim et al. 2014). As indirect oxidation rate decreased in acidic solution, decreasing pH during the electro-oxidation process negatively affect the reaction capacity of mediator, decreasing COD and TOC removal efficiencies. It seems that electrolyte addition was also negatively affected the indirect oxidation of ammonia, as it decreased NH4+ and Ntot removal efficiencies from the range of 29-39% and 12-23% to 14-29% and 9-21%, respectively. As shown in Figure 3, indirect oxidation by HClO was the main removal pathway of ammonia. This reaction was mostly determined by the concentration of 4 5 6 7 8 9 10 11 12 13 14 15 16 17 18 19 20 21 22 23 24 25 26 27 28 29 30 31 32 33 34 35 36 37 38 39 40 41 42 43 44 45 46 47 48 49 50 51 52 53 54 55 56 57 58 59 60 61
chloride and pH (Li &Liu 2009). By increasing the concentration of SO42-, the rate of HClO production was decreased, leading in lower ammonia oxidation. Furthermore, pH of the effluent was decreased more rapidly in presence of salt. Therefore, ammonia oxidation was inhibited (Li &Liu 2009).
For the process optimization, CCD model was used to model the responses according to the following equation (Equation 9 and 11).
𝐶𝑂𝐷 𝑅𝐸(%) = 70.57 + 8.42 X1+ 10.52 X2+ 6.34 X3− 1.58 X12−3.06 X13 R2= 0.957 (9) 𝑇𝑂𝐶 𝑅𝐸(%) = 55.51 + 9.51 X1+ 15.20 X2+ 8.34 X3+ 1.99 X12−2.60 X13 R2= 0.954 (10) 𝑆𝐸𝐶 (𝑘𝑊ℎ/𝑘𝑔𝐶𝑂𝐷) = 102.94 + 22.51 X1+ 19.60 X2+ 21.17 X3 + 7.33 X12+ 9.34 X13 R2= 0.971 (11)
Significance of the following models was assessed by the ANOVA test, based on 95% of the confidential level. Calculated F values for equation 9 to 11 were 88, 82, and 132, respectively that were superior to Fc value (predictably of model are shown in supplement: Figure 3-S). For the optimization of operating condition, maximizing TOC and COD removal efficiencies, and minimizing energy consumption was considered. Based on the models (result presented in 4 5 6 7 8 9 10 11 12 13 14 15 16 17 18 19 20 21 22 23 24 25 26 27 28 29 30 31 32 33 34 35 36 37 38 39 40 41 42 43 44 45 46 47 48 49 50 51 52 53 54 55 56 57 58 59 60 61
Figure 4-S) the following operating condition was required: Anode type: Nb/BDD, Cathode type: Ti/Pt, current density of 23.1 mA cm-2, treatment time: 120 min without addition of electrolyte. For the final validation of models, three experiments run in this condition with the results presented in Table 1. Even though COD and TOC showed high removal rate, BOD was rarely decreased, as the organic carbon in the effluent had very low molecular weight with high bioavailability. Low production of NO3- by anodic oxidation of NH3 was also detected, as the most ammonia in the form of NH4+ had lower affinity toward anode. ɳ and current efficiency were measured around 47.4 and 48.7%. The energy consumption required for the oxidation of oily wastewater was estimated around 102 kWh kg COD-1 or 86.4 kWh m-3 that was comparable with the results in the literature.
4 5 6 7 8 9 10 11 12 13 14 15 16 17 18 19 20 21 22 23 24 25 26 27 28 29 30 31 32 33 34 35 36 37 38 39 40 41 42 43 44 45 46 47 48 49 50 51 52 53 54 55 56 57 58 59 60 61
4 Conclusion
Proper treatment of pollutants from oily wastewater was reached by utilization of electro-chemical oxidation process; while, physical and biological processes faced serious treatment challenges. In the anode surface, organic nitrogen and carbon could oxidized and produced CO2 and NO3- with zero order kinetic rate. The remaining organic and inorganic carbon was mostly targeted by hydroxyl radical with first-order kinetic rate. Indirect oxidation in bulk, especially with HClO, was responsible for Ntot removal with second-order reaction. Electro-floatation and electro-deposition were simultaneously occurred. Rapid removal of oil and grease was resulted from flotation by the fine hydrogen and oxygen bubbles produced in the cathode and anode, respectively. Reduction on the cathode and precipitation by sulfur and OH- were the main removal pathways of metals.
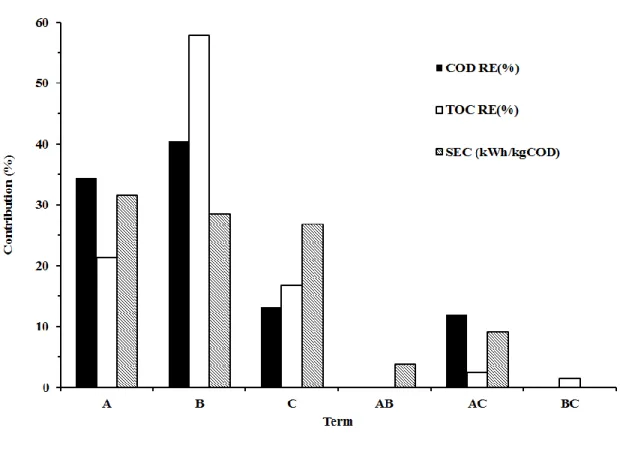
Testing different current density, treatment time and electrolyte addition showed that the effect of the first factor was equal on COD removal efficiency and energy consumption (34.4 and 31.6%, respectively); while, the effect of last was more pronounced in energy consumption than removal efficiencies (26.8, 16.8, 13.2%, respectively). Treatment time was the most important factor on the performance of the process.
By optimizing the process, the following result was observed for current density of 23.1 mA cm-2 during 120 min: Removal efficiencies higher than 75% were measured for oil and grease, color, total alkalinity, COD, S, PO43-, Al, Fe, Mn and Ca. TOC, BOD, Ptot, Mg, S had medium removal rates. Finally, removal efficiencies lower than 25% were detected for Ntot, NH4+, K, and Na. 4 5 6 7 8 9 10 11 12 13 14 15 16 17 18 19 20 21 22 23 24 25 26 27 28 29 30 31 32 33 34 35 36 37 38 39 40 41 42 43 44 45 46 47 48 49 50 51 52 53 54 55 56 57 58 59 60 61
5 References
Al-Shamrani AA, James A, Xiao H (2002): Destabilisation of oil–water emulsions and separation by dissolved air flotation. Water Research 36, 1503-1512
Alizadeh Kordkandi S, Mohaghegh Motlagh A (2017): Optimization of peroxone reaction rate using metaheuristic approach in the dearomatization and discoloration process. Environmental Progress & Sustainable Energy, 1-8
Anglada A, Urtiaga A, Ortiz I, Mantzavinos D, Diamadopoulos E (2011): Boron-doped diamond anodic treatment of landfill leachate: evaluation of operating variables and formation of oxidation by-products. Water Res 45, 828-38
Bashir MJK, Aziz HA, Aziz SQ, Abu Amr SS (2013): An overview of electro-oxidation processes performance in stabilized landfill leachate treatment. Desalination and Water Treatment 51, 2170-2184
Boye B, Brillas E, Marselli B, Michaud P-A, Comninellis C, Dieng MM (2004): Electrochemical decontamination of waters by advanced oxidation processes (AOPS): Case of the mineralization of 2, 4, 5-T on BDD electrode. Bulletin of the Chemical Society of Ethiopia 18
Cao Z, Wen D, Chen H, Wang J (2016): Simultaneous Removal of COD and Ammonia Nitrogen Using a Novel Electro-Oxidation Reactor: A Technical and Economic Feasibility Study. International Journal of Electrochemical Science, 4018-4026
Chen G (2004): Electrochemical technologies in wastewater treatment. Separation and Purification Technology 38, 11-41
da Silva AJC, dos Santos EV, de Oliveira Morais CC, Martínez-Huitle CA, Castro SSL (2013): Electrochemical treatment of fresh, brine and saline produced water generated by petrochemical industry using Ti/IrO2–Ta2O5 and BDD in flow reactor. Chemical Engineering Journal 233, 47-55
Díaz V, Ibáñez R, Gómez P, Urtiaga AM, Ortiz I (2011): Kinetics of electro-oxidation of ammonia-N, nitrites and COD from a recirculating aquaculture saline water system using BDD anodes. Water Research 45, 125-134
Ding J, Li W, Zhao Q-L, Wang K, Zheng Z, Gao Y-Z (2015): Electroreduction of nitrate in water: Role of cathode and cell configuration. Chemical Engineering Journal 271, 252-259
Drogui P, Blais J-F, Mercier G (2007): Review of electrochemical technologies for environmental applications. Recent patents on engineering 1, 257-272
Dvorak DH, Hedin RS, Edenborn HM, McIntire PE (1992): Treatment of metal‐contaminated water using bacterial sulfate reduction: Results from pilot‐scale reactors. Biotechnology and bioengineering 40, 609-616
Espinoza JDG, Drogui P, Zolfaghari M, Dirany A, Ledesma MTO, Gortáres-Moroyoqui P, Buelna G (2016): Performance of electrochemical oxidation process for removal of di (2-ethylhexyl) phthalate. Environmental Science and Pollution Research 23, 12164–12173
Ighilahriz K, Ahmed MT, Djelal H, Maachi R (2013): Electrocoagulation and electro-oxidation treatment for the leachate of oil-drilling mud. Desalination and Water Treatment 52, 5833-5839
Körbahti BK, Artut K (2010): Electrochemical oil/water demulsification and purification of bilge water using Pt/Ir electrodes. Desalination 258, 219-228
4 5 6 7 8 9 10 11 12 13 14 15 16 17 18 19 20 21 22 23 24 25 26 27 28 29 30 31 32 33 34 35 36 37 38 39 40 41 42 43 44 45 46 47 48 49 50 51 52 53 54 55 56 57 58 59 60 61
Li L, Liu Y (2009): Ammonia removal in electrochemical oxidation: Mechanism and pseudo-kinetics. Journal of hazardous materials 161, 1010-1016
Martínez‐Huitle CA, Brillas E (2008): Electrochemical alternatives for drinking water disinfection. Angewandte Chemie International Edition 47, 1998-2005
Panizza M, Michaud P, Cerisola G, Comninellis C (2001): Anodic oxidation of 2-naphthol at boron-doped diamond electrodes. Journal of Electroanalytical Chemistry 507, 206-214
Panizza M, Martinez-Huitle CA (2013): Role of electrode materials for the anodic oxidation of a real landfill leachate--comparison between Ti-Ru-Sn ternary oxide, PbO(2) and boron-doped diamond anode. Chemosphere 90, 1455-60
Rocha JHB, Gomes MMS, Fernandes NS, da Silva DR, Martínez-Huitle CA (2012): Application of electrochemical oxidation as alternative treatment of produced water generated by Brazilian petrochemical industry. Fuel processing technology 96, 80-87
Santos MR, Goulart MO, Tonholo J, Zanta CL (2006): The application of electrochemical technology to the remediation of oily wastewater. Chemosphere 64, 393-399
Skban Ibrahim D, Seethala Devi P, Veerababhu C, Balasubramanian N (2014): Treatment of Petroleum Effluent Using a Tubular Electrochemical Reactor. Petroleum Science and Technology 32, 1932-1939
Tazari F, Rahaie M, Zarmi AH, Jalili H, Yazdian F, Kordkandi SA (2017): A Systematic Comparison of Biosurfactant Effects on Physicochemical Properties and Growth Rates of P. aeruginosa MM1011 and TMU56: A Bioremediation Perspective. Bioprocess Engineering 1, 14-20
Urtiaga A, Rueda A, Anglada A, Ortiz I (2009): Integrated treatment of landfill leachates including electrooxidation at pilot plant scale. Journal of hazardous materials 166, 1530-4
Yavuz Y, Koparal AS, Öğütveren ÜB (2010): Treatment of petroleum refinery wastewater by electrochemical methods. Desalination 258, 201-205
Yu L, Han M, He F (2017): A review of treating oily wastewater. Arabian Journal of Chemistry 10, 1913-1922
Yu Z-m, Jian W, WEI Q-p, Meng L-c, Hao S-m, Fen L (2013): Preparation, characterization and electrochemical properties of boron-doped diamond films on Nb substrates. Transactions of Nonferrous Metals Society of China 23, 1334-1341
Zhou B, Yu Z, Wei Q, Long H, Xie Y, Wang Y (2016): Electrochemical oxidation of biological pretreated and membrane separated landfill leachate concentrates on boron doped diamond anode. Applied Surface Science 377, 406–415
Zolfaghari M, Jardak K, Drogui P, Brar SK, Buelna G, Dubé R (2016): Landfill leachate treatment by sequential membrane bioreactor and electro-oxidation processes. Journal of environmental management 184, 318-326 4 5 6 7 8 9 10 11 12 13 14 15 16 17 18 19 20 21 22 23 24 25 26 27 28 29 30 31 32 33 34 35 36 37 38 39 40 41 42 43 44 45 46 47 48 49 50 51 52 53 54 55 56 57 58 59 60 61
Figure 1. The apparent COD oxidation half-life and instantons current efficiency in different current densities. 0 20 40 60 80 100 0 40 80 120 160 200 0 10 20 30 40 50 60 70 ɳ ( %) h alf lif e (m in )
Current Density (mA cm-2)
t1/2 ɳ
(a)
(b)
Figure 2. The apparent reaction rate constant of (a) pseudo-first order kinetic for COD, TOC, TA, and
color (b) pseudo-second and zero order kinetic for Ntot, NH4+, NO3- in different current densities.
0 0.5 1 1.5 2 2.5 3 0 10 20 30 40 50 60 70 K ( h -1)
Current Density (mA cm-2)
TA Color COD TOC 0 0.1 0.2 0.3 0.4 0.5 0 1 2 3 4 5 0 10 20 30 40 50 60 70 80 K ( m g L -1 m in -1) K ( L m g -1 h -1)
Current Density (mA cm-2)
TN NH4 NOx
Direct Oxidation Indirect Oxidation
COD bulk COD=exp(-kx)
COD=0
Main reaction to produce OH
Side reaction in high current intensity Main reaction to remove color
COD Oxidation side reactions of mediator formation
Ammonia Oxidation, total nitrogen removal
Ammonia surface oxidation
TA Oxidation Surface Oxidation Anode TOC removal Cathodic Reduction Precipitation of Mg and Ca Electro-deposition of metals Precipitation of Metals Cathode
Figure 4. Average removal efficiency, influent and effluent concentration of metal cations in different treatment time (1-3 h) and current density
Figure 5. Contribution of all factor (A: Current density, B: Treatment time, C: Electrolyte addition) on the responses.
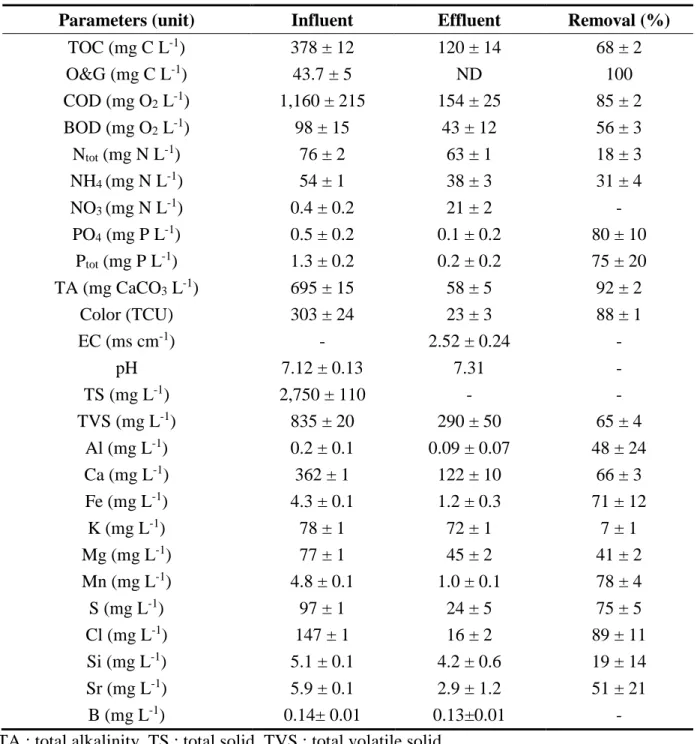
Table 1. Characterization of oily wastewater and the performance of electro-oxidation in the optimum operating condition (CD = 23.1 mA cm-2, t = 120 min, T = 25˚C).
Parameters (unit) Influent Effluent Removal (%)
TOC (mg C L-1) 378 ± 12 120 ± 14 68 ± 2 O&G (mg C L-1) 43.7 ± 5 ND 100 COD (mg O2 L-1) 1,160 ± 215 154 ± 25 85 ± 2 BOD (mg O2 L-1) 98 ± 15 43 ± 12 56 ± 3 Ntot (mg N L-1) 76 ± 2 63 ± 1 18 ± 3 NH4 (mg N L-1) 54 ± 1 38 ± 3 31 ± 4 NO3 (mg N L-1) 0.4 ± 0.2 21 ± 2 - PO4 (mg P L-1) 0.5 ± 0.2 0.1 ± 0.2 80 ± 10 Ptot (mg P L-1) 1.3 ± 0.2 0.2 ± 0.2 75 ± 20 TA (mg CaCO3 L-1) 695 ± 15 58 ± 5 92 ± 2 Color (TCU) 303 ± 24 23 ± 3 88 ± 1 EC (ms cm-1) - 2.52 ± 0.24 - pH 7.12 ± 0.13 7.31 - TS (mg L-1) 2,750 ± 110 - - TVS (mg L-1) 835 ± 20 290 ± 50 65 ± 4 Al (mg L-1) 0.2 ± 0.1 0.09 ± 0.07 48 ± 24 Ca (mg L-1) 362 ± 1 122 ± 10 66 ± 3 Fe (mg L-1) 4.3 ± 0.1 1.2 ± 0.3 71 ± 12 K (mg L-1) 78 ± 1 72 ± 1 7 ± 1 Mg (mg L-1) 77 ± 1 45 ± 2 41 ± 2 Mn (mg L-1) 4.8 ± 0.1 1.0 ± 0.1 78 ± 4 S (mg L-1) 97 ± 1 24 ± 5 75 ± 5 Cl (mg L-1) 147 ± 1 16 ± 2 89 ± 11 Si (mg L-1) 5.1 ± 0.1 4.2 ± 0.6 19 ± 14 Sr (mg L-1) 5.9 ± 0.1 2.9 ± 1.2 51 ± 21 B (mg L-1) 0.14± 0.01 0.13±0.01 -
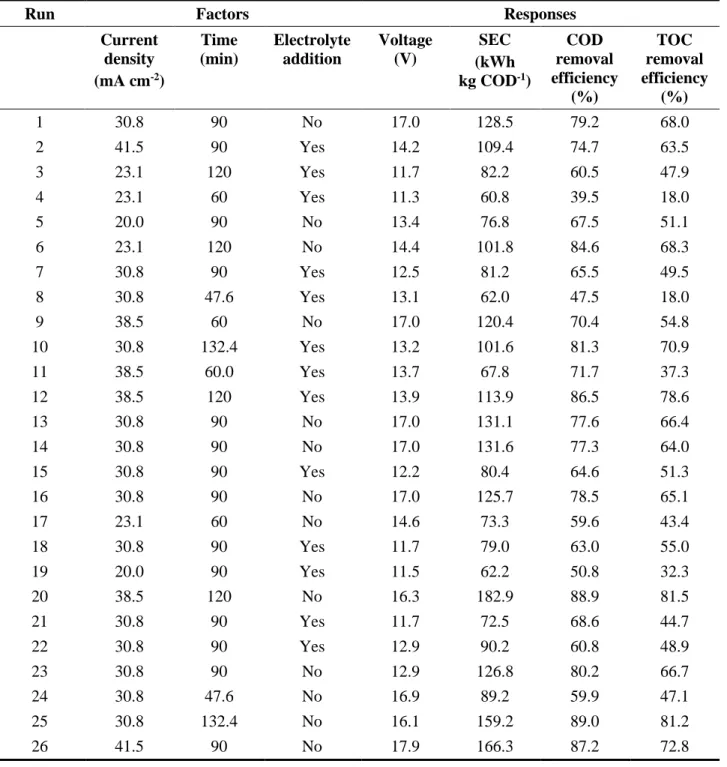
Table 2. Initial conditions and responses of the electro-oxidation processes for all sets of experiments, including factorial and central composite design.
Run Factors Responses
Current density (mA cm-2) Time (min) Electrolyte addition Voltage (V) SEC (kWh kg COD-1) COD removal efficiency (%) TOC removal efficiency (%) 1 30.8 90 No 17.0 128.5 79.2 68.0 2 41.5 90 Yes 14.2 109.4 74.7 63.5 3 23.1 120 Yes 11.7 82.2 60.5 47.9 4 23.1 60 Yes 11.3 60.8 39.5 18.0 5 20.0 90 No 13.4 76.8 67.5 51.1 6 23.1 120 No 14.4 101.8 84.6 68.3 7 30.8 90 Yes 12.5 81.2 65.5 49.5 8 30.8 47.6 Yes 13.1 62.0 47.5 18.0 9 38.5 60 No 17.0 120.4 70.4 54.8 10 30.8 132.4 Yes 13.2 101.6 81.3 70.9 11 38.5 60.0 Yes 13.7 67.8 71.7 37.3 12 38.5 120 Yes 13.9 113.9 86.5 78.6 13 30.8 90 No 17.0 131.1 77.6 66.4 14 30.8 90 No 17.0 131.6 77.3 64.0 15 30.8 90 Yes 12.2 80.4 64.6 51.3 16 30.8 90 No 17.0 125.7 78.5 65.1 17 23.1 60 No 14.6 73.3 59.6 43.4 18 30.8 90 Yes 11.7 79.0 63.0 55.0 19 20.0 90 Yes 11.5 62.2 50.8 32.3 20 38.5 120 No 16.3 182.9 88.9 81.5 21 30.8 90 Yes 11.7 72.5 68.6 44.7 22 30.8 90 Yes 12.9 90.2 60.8 48.9 23 30.8 90 No 12.9 126.8 80.2 66.7 24 30.8 47.6 No 16.9 89.2 59.9 47.1 25 30.8 132.4 No 16.1 159.2 89.0 81.2 26 41.5 90 No 17.9 166.3 87.2 72.8