This is an Accepted Manuscript, which has been through the Royal Society of Chemistry peer review process and has been accepted for publication.
Accepted Manuscripts are published online shortly after
acceptance, before technical editing, formatting and proof reading. Using this free service, authors can make their results available to the community, in citable form, before we publish the edited article. We will replace this Accepted Manuscript with the edited and formatted Advance Article as soon as it is available.
You can find more information about Accepted Manuscripts in the Information for Authors.
Please note that technical editing may introduce minor changes to the text and/or graphics, which may alter content. The journal’s standard Terms & Conditions and the Ethical guidelines still apply. In no event shall the Royal Society of Chemistry be held responsible for any errors or omissions in this Accepted Manuscript or any consequences arising from the use of any information it contains.
Accepted Manuscript
Analytical
Methods
1
Determination of optimal extraction conditions for phenolic compounds from Pistacia
atlantica leaves using response surface methodology
Ziyad Ben Ahmeda,b, Mohamed Yousfia, Johan Viaeneb, Bieke Dejaegherb,c, Kristiaan Demeyerd, Debby Mangelingsb, Yvan Vander Heydenb*
a
Laboratory of Fundamental Sciences, University Amar Telidji, BP37G Laghouat, Algeria b
Department of Analytical Chemistry and Pharmaceutical Technology, Vrije Universiteit Brussel (VUB), Laarbeeklaan 103, B-1090 Brussels, Belgium.
cLaboratory of Instrumental Analysis and Bioelectrochemistry, Université Libre de Bruxelles
(ULB), Campus Plaine CP205/6, Boulevard du Triomphe B-1050 Bruxelles, Belgium. d
Department of Toxicology, Dermato-Cosmetology and Pharmacognosy, Vrije Universiteit Brussel (VUB), Laarbeeklaan 103, B-1030 Brussels, Belgium.
Corresponding author : Yvan Vander Heyden E-mail address: yvanvdh@vub.ac.be
Tel.: +32 2 477 47 34 Fax.: +32 2 477 47 35 2 3 4 5 6 7 8 9 10 11 12 13 14 15 16 17 18 19 20 21 22 23 24 25 26 27 28 29 30 31 32 33 34 35 36 37 38 39 40 41 42 43 44 45 46 47 48 49 50 51 52 53 54 55 56 57 58 59 60
Analytical
Methods
Accepted
Manuscript
2 Abstract
Response surface methodology in combination with a Box-Behnken experimental design was performed to optimize the extraction conditions, resulting in a maximum yield for the total phenolic content (TPC) from leaves of Pistacia atlantica. The ranges of the examined independent variables (factors), i.e. the extraction time (24-72 hours), liquid-to-solid ratio (30:1-50:1 ml solvent per g dry leaf) and extraction temperature (35-55°C) were identified by preliminary experiments. Quadratic polynomial regression models were fitted through the experimental results. They showed acceptable coefficients of multiple determination. From the models, the liquid-to-solid ratio was found to have the most influence on the extraction of TPC. The optimum extraction conditions were found at 72 h extraction time and 50:1 ml/g liquid-to-solid ratio. For the extraction temperature, rather high values (about 50°C) were found best. Using the optimized conditions, the TPC varied from 256 to 306 mg gallic acid equivalents g dry leaf in different sample types.
Keywords: Pistacia atlantica leaves, extraction optimization, phenolic compounds, Box–
Behnken design, response surface methodology 2 3 4 5 6 7 8 9 10 11 12 13 14 15 16 17 18 19 20 21 22 23 24 25 26 27 28 29 30 31 32 33 34 35 36 37 38 39 40 41 42 43 44 45 46 47 48 49 50 51 52 53 54 55 56 57 58 59 60
Analytical
Methods
Accepted
Manuscript
3 Introduction
Pistacia, belonging to the Anacardiaceae family grows in many regions in Algeria. Three species, Pistacia lentiscus, Pistacia terebinthus, and Pistacia atlantica, can be distinguished. Pistacia atlantica is a tree which can reach over 15m heigth and its vernacular name is “Butom”. It widely grows in arid regions, which are characterized by nutrient and water scarcity, and long term exposures to extensive solar radiation and high temperatures1.The ethnopharmacological history of P. atlantica indicate that some extracts of aerial and underground parts have been used in folk medicine for various treatments, such as relieving upper abdominal discomfort and pain, dyspepsia and peptic ulcer2. The widespread use of P. atlantica in traditional medicine can be partly attributed to phenolic compounds, which display antioxidant capacity3 as well as hepatoprotective, anti-inflammatory, and anticancer effects4. These phenolic compounds include hydrolysable tannins (galloylquinic acids and ellagitannins), phenolic acids, and flavonoids3,5. The extraction parameters may affect the antioxidant activity in P. atlantica leave extracts, but they never been optimized. Many factors influence the extraction efficacy, such as the solvent composition, matrix composition, extraction time, extraction temperature, solvent-to solid-ratio, extraction pressure, and sample particle size, to name a few6. Often extraction optimization is based on the traditional one-factor-at-a-time approach 7. The main drawbacks of this methodalogy include the inability to determine interactions between variables, while it is time-consuming, costly and less effective8. In order to overcome these problems, the optimization of analytical procedures has been carried out using multivariate techniques, among which response surface methodology (RSM)9.
RSM is a modeling strategy that allows the optimization of a given response, such as obtaining an extract with the highest yield in of phenols, based on the information of several different experimens varying more than one factor simultaneously10. A model is build 2 3 4 5 6 7 8 9 10 11 12 13 14 15 16 17 18 19 20 21 22 23 24 25 26 27 28 29 30 31 32 33 34 35 36 37 38 39 40 41 42 43 44 45 46 47 48 49 50 51 52 53 54 55 56 57 58 59 60
Analytical
Methods
Accepted
Manuscript
4
between the response and the factors that have been varied in the different experiments. This model represents a response surface in the examined experimental domain. To visualize the output from the RSM, the modeled response can be represented graphically by a three-dimensional response surface or a two-three-dimensional contour plot. RSM has been successfully used to optimize biochemical processes, including the extraction of phenolic compounds11. To the best of our knowledge, optimization of the extraction of phenolic antioxidants from P. atlantica leaves has not been reported yet. Thus, this study aimed investigating the effects of the liquid-to-solid ratio (range 30:1-50:1 ml/mg), extraction time (range 24-96 h), and extraction temperature (range 35-55°C) on the extraction recovery of phenolic compounds from male and female leaves of P. atlantica, using RSM.
Materials and methods Chemicals
The Folin–Ciocalteu reagent and gallic acid were purchased from Sigma (Steinheim, Germany), and sodium carbonate was obtained from Fluka (Buchi, Switzerland), whereas acetone (Laboratory Reagent, ≥99.5%) was purchased from Sigma-Aldrich (Munich, Germany). Whatman filter paper (Grade 1: 11 µm), was obtained from Sigma-Aldrich (Lyon, France). Ultrapure water was prepared by an Arium pro UV system (Sartorius Stedim Biotec, Goettingen, Germany).
Plant material
At least twenty gram of fresh leaves per tree, from male (n = 5) and female (n = 5) P. atlantica trees, were randomly collected in 2010. Trees were sampled from two growing regions chosen along a transect of increasing aridity: Ain oussera (medium arid) and Laghouat (arid), located at 200 and 400 km south of Algiers, Algeria, respectively. The location of Ain oussera (latitude 35◦33_(N); longitude 02°31_(E); altitude 649 m) is characterized by an annual precipitation of 25 mm and an average summer temperature of 37.8 °C, and that of 2 3 4 5 6 7 8 9 10 11 12 13 14 15 16 17 18 19 20 21 22 23 24 25 26 27 28 29 30 31 32 33 34 35 36 37 38 39 40 41 42 43 44 45 46 47 48 49 50 51 52 53 54 55 56 57 58 59 60
Analytical
Methods
Accepted
Manuscript
5
Laghouat (latitude 33◦47_(N); longitude 02◦52_(E); altitude 750m) by an annual precipitation of 18 mm and an average summer temperature of 41.4 °C. These two locations are characterized by a clay soil type, locally known as “Daya”. The identity of the leaf samples was confirmed by Prof. Dr. Safia Belhadj (Department of Agropastoralism, Faculty of Science, Achour Zian University, Djelfa, Algeria), and a voucher specimen (LM: male leaves of Laghouat region, LF: female leaves of Laghouat region, OM: male leaves of Ain oussera region, and OF: female leaves of Ain oussera region) is deposited at the Department of Biology, University of Laghouat (Algeria).
Preliminary experiments to select the experimental ranges of relevant factors Extraction time
The dried leaves of P. atlantica were milled using a grinder. Before extraction, the milled leaves were sieved with sieves of mesh sizes ranging from 0.60–0.90 mm. Polar solvents are frequently used for recovering phenolic compounds from plant matrices. Aqueous acetone has been found more efficient in extracting higher molecular weight polyphenols12. Two gram of leaves powder was macerated in 100 ml acetone/water (V/V, 7/3) with extraction times varying between 15 min and 96 h at 25°C extraction temperature. Liquid-to-solid-ratio was 50:1 ml/g. The extract was filtered and acetone removed using a rotary evaporator (Büchi Rotavapor R-200, Flawil, Switzerland) at 50°C.
Liquid-to-solid ratio
The extraction process was carried out using differents ratios of aqueous acetone to raw material in the range of 20:1 to 60:1 ml/g, while the extraction time was fixed at 72 h and the extraction temperature at 25°C. The extract was filtered and the acetone removed by using a rotary evaporator at 50 °C. 2 3 4 5 6 7 8 9 10 11 12 13 14 15 16 17 18 19 20 21 22 23 24 25 26 27 28 29 30 31 32 33 34 35 36 37 38 39 40 41 42 43 44 45 46 47 48 49 50 51 52 53 54 55 56 57 58 59 60
Analytical
Methods
Accepted
Manuscript
6 Extraction temperature
Using 72 h extraction time and 40:1 ml/g as liquid-to-solid ratio, samples were extracted at various extraction temperatures ranging from 25 to 55oC. The extract was filtered and the acetone removed using a rotary evaporator at 50 °C.
In each experiment, the aqueous phase was used to determine the total phenolic content. Based on the results of the preliminary experiments, the ranges of the three factors to vary in the experimental design were determined (Table 1).
Total phenolic content (TPC) -Folin–Ciocalteu method (FCM)
The TPC was determined with the Folin–Ciocalteu reagent using the method described in13. A calibration curve was obtained using gallic acid as standard. Different concentrations of gallic acid (0.05-0.35 mg/ml) were prepared in methanol/water (60:40, v/v) as standards. 100 µl of a 5 fold-diluted sample in methanol was added to a test tube. Both standard and samples were mixed with 500 µl 10-fold-diluted Folin-Ciocalteu reagent in water and 2 ml aqueous sodium carbonate solution (4%, w/v). The final mixture was shaken and then incubated for 30 min in the dark at room temperature. The absorbances of all standards and samples were measured at 760 nm using a Shimadzu UV 160A, (Shimadzu, Kyoto, Japan) spectrophotometer, and the results expressed as mg gallic acid equivalents (GAE) per g dry leaf weight. Each sample was prepared in triplicate and the mean value calculated.
Experimental design
The Box–Behnken design (BBD) is an experimental design where the factors are examined at three levels and of which the results allow building a response surface for the examined responses14. In the present study, by employing the BBD, the influences of three independent factors, i.e. extraction time (X1), liquid-to-solid ratio (X2), and extraction temperature (X3), on
the response (Y), i.e. the percent yield of phenolic compounds from P. atlantica leaves, were investigated to determine the optimal conditions resulting in the highest yield. Fifteen, 2 3 4 5 6 7 8 9 10 11 12 13 14 15 16 17 18 19 20 21 22 23 24 25 26 27 28 29 30 31 32 33 34 35 36 37 38 39 40 41 42 43 44 45 46 47 48 49 50 51 52 53 54 55 56 57 58 59 60
Analytical
Methods
Accepted
Manuscript
7
experiments were performed of which 3 replicates of the center point. A second-order polynomial model was build according to the following equation (Eq. (1)) and then used to predict the optimal conditions of the extraction process.
∑
∑
∑
+ + + = = = k j i j i ij k i i ii k i i iX b X b X X b b Y f 1 2 1 0where Y represents the response (in our case the TPC yield);b0the intercept; bi, biiand bij the coefficients of the linear, quadratic and two-factor interaction terms, respectively, and Xiand
j
X the coded factors levels. The factors and their levels, with both coded (-1,0,1) and real values, are given in Table 1, while the experimentals design with the replicated experiments is show in Table 2. In order to visualize the influences of the factors on the response 3-D response surface plots were drawn.
[Table 1] [Table 2] Statistical analysis
The experimental results in the single factor ( preliminary) experiments were analyzed using the SPSS software (version 16, Prentice Hall, Chicago IL, USA, 2007). All data were expressed as means ± standard deviations of triplicate measurements. One-way analysis of variance (ANOVA) and the Student-Newman Keuls (SNK) posthoc test were used to determine significant differences (p<0.05) between the means.
JMP software (Version 11, SAS, Cary, NC, USA) was used for the data analysis of the RSM experiments. ANOVA (95% confidence level) was carried out for each response variable in order to test the significance of the model terms. The F-values in the ANOVA table are the ratios of the mean squared factor errors to the pure error, the latter obtained from the replicates at the center point. The p-values are used as a parameter to express the significance of each of the model coefficients. Statistical significance was considered when p < 0.05 (α =
(Eq. (1)) 2 3 4 5 6 7 8 9 10 11 12 13 14 15 16 17 18 19 20 21 22 23 24 25 26 27 28 29 30 31 32 33 34 35 36 37 38 39 40 41 42 43 44 45 46 47 48 49 50 51 52 53 54 55 56 57 58 59 60
Analytical
Methods
Accepted
Manuscript
8
0.05). A lack-of-fit test was carried out by comparing the variability of the residues of the proposed model with the variability between the observations for repeated experiments. The proposed model was considered appropriate to explain the phenolic yield (p > 0.05). The coefficient of multiple determination (r2) and the adjusted coefficient (r2adj) represent the percent of the phenolic concentration variability explained by the applied model.
The coefficients of Eq. (1) were calculated and tested for significance (p-values from F-tests). An m-file, written in Matlab version 7.1 (The MathWorks, Natick, MA), was employed to predict the TPC value at several grid points in the optimal zone.
Results and discussion
Determination of the experimental ranges for the relevant factors
Before starting the RSM, preliminary tests were performed to select the experimental ranges for the selected factors, extraction temperature, liquid-to-solid ratio and extraction time, which affect the phenolic extraction yield (response or dependent variable). The size of the particles is another potentiel factor to consider. However, we chose to work with the minimum particle size (0.60–0.90 mm), which would not hinder the experimental work at the filtration step. The TPC results measured by the Folin–Ciocalteu procedure and presented as GAE equivalents are not exclusively determined (neither qualitatively nor quantitatively) by the phenolic constituents in the plant extracts. It is well-known that the Folin-Ciocalteu reagent reacts with simple phenols but also detects reducing sugars and other potential ingredients. However, this method, though not specific only for polyphenols, has been traditionally used to determine phenolic compounds.
Extraction time
The kinetics of the phenolic compounds extraction were evaluated in order to know the extraction rate and to allow an appropriate choice of the experimental range for the factor extraction time to be included in the RSM. The effect of the extraction times on the extraction 2 3 4 5 6 7 8 9 10 11 12 13 14 15 16 17 18 19 20 21 22 23 24 25 26 27 28 29 30 31 32 33 34 35 36 37 38 39 40 41 42 43 44 45 46 47 48 49 50 51 52 53 54 55 56 57 58 59 60
Analytical
Methods
Accepted
Manuscript
9
yield of phenolic compounds is shown in Fig.1. Extraction was varied from 15 min to 96 h, while the other extraction conditions were as follows: extraction temperature 25 C° and ratio of liquid-to-solid 50:1 ml/g.
[ Figure 1]
The kinetics could be divided into two phases i.e. a first, till about 6-12 h, with lower yields and a second 24 h and more with higher yields (Fig.1). A rather constant region was reached after 48 h of extraction. The SNK post-hoc test indicated six groups, (a)-(g). The subgroups (a) and (b) show overlap. From 60 to 96 h, TPC values do not increase anymore, which means that a thus long extraction time does not extract more phenolic compounds. This phenomenon is explained by Fick’s second law of diffusion, where it is postulated that a final equilibrium will be attained between the solution concentrations in the solid matrix and the solvent after a particular duration15. Based on the results, the best choice for the extraction time is expected to be in the range of 24-72 h.
Liquid-to-solid ratio
The impact of the liquid-to-solid ratio on the extraction of phenolics from P. atlantica was evaluated with five ratios (20:1, 30:1, 40:1, 50:1, 60:1 ml/g) over a 72 h extraction period, at 25 ◦C. The amount of TPC extracted per g of dry weight (DW) is presented in Fig. 2, for the five levels tested. A one-way analysis of variance indicated a significant difference among the ratios studied. When the solvent to sample ratio increased from 20:1 to 40:1 ml/g, the extraction yields increased significantly from about 220 to 290 mg GAE /g DW, which was probably due to the increased solubility of phenolic compounds.
[Figure 2]
However, a decrease in extraction yield was observed when the ratio exceeds 40:1. An SNK post-hoc test indicated three TPC groups (Fig. 2). Taking the extraction yield, the solvent and 2 3 4 5 6 7 8 9 10 11 12 13 14 15 16 17 18 19 20 21 22 23 24 25 26 27 28 29 30 31 32 33 34 35 36 37 38 39 40 41 42 43 44 45 46 47 48 49 50 51 52 53 54 55 56 57 58 59 60
Analytical
Methods
Accepted
Manuscript
10
processing costs into consideration, the best choice for the ratio liquid-to-solid should be found in the range 30:1-50:1 ml/g.
Extraction temperature
In Fig. 3, the effect of temperatures 25, 35, 45 and 55 ◦C on the extraction yield of TPC is shown. The other factors were at extraction time 72 h and liquid-to-solid ratio 40:1 ml/g. A one-way analysis of variance showed a significant difference among the yields at the extraction temperatures studied. The TPC extraction yield increased when the extraction temperature increased from 25 to 45 oC and was followed by a slight decrease at 55°C. Elevated temperatures are reported to improve the efficiency of extraction because of enhanced diffusion rates and solubilities of analytes in solvents16. Nevertheless, elevated extraction temperatures beyond 45°C may promote a possible concurrent decomposition of the phenolic compounds. Based on these results, the best choice for the extraction temperature is expected to be in the range 25-45°C
[Figure 3] RSM experiments
Based on the observations from the single-factor experiments, the ranges of the factors extraction time, liquid-to-solid ratio and extraction temperature were selected. To optimize the extraction process of the phenolic compounds from male and female leaves of P. atlantica, collected in Laghouat and Ain oussera regions, an extraction temperature of 45 ±10°C, an extraction time of 48±24 h and a ratio of liquid-to-solid of 40:1±10:1 formed the experimental domain in which the BBD was created.
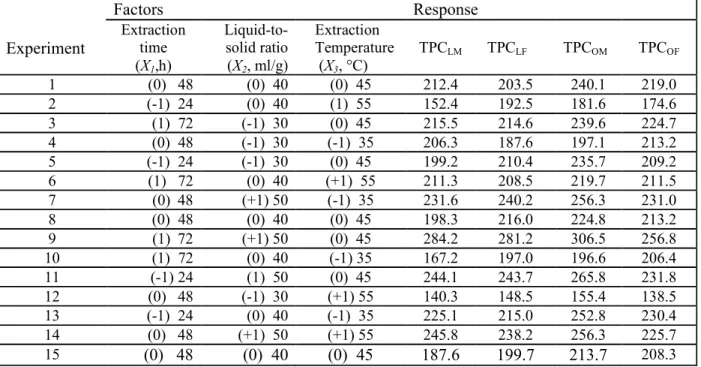
Table 2 shows the experimental conditions for the BBD and the results of the extractions. The TPC in the Laghouat region ranged from 140.3 to 284.2 mg GAE/g DW for the male leaves, and from 148.5 to 281.2 mg GAE/g DW for the female leaves. In the Ain oussera region, these values were 155.4 to 306.5 mg GAE/g DW for the male leaves and 138.5 to 256.8 mg 2 3 4 5 6 7 8 9 10 11 12 13 14 15 16 17 18 19 20 21 22 23 24 25 26 27 28 29 30 31 32 33 34 35 36 37 38 39 40 41 42 43 44 45 46 47 48 49 50 51 52 53 54 55 56 57 58 59 60
Analytical
Methods
Accepted
Manuscript
11
GAE/g DW for the female leaves. In both regions, the maximum TPC content was recorded for a liquid-to-solid ratio of 50:1, an extraction temperature of 45°C and an extraction time of 72 h.
By applying multiple regression analysis (Eq. (1)) on the experimental data of Table 2 the following models for the response variables were obtained:
TPCLM = 199.4 + 7.1 X1 + 30.5 X2 – 10.0 X3 + 5.9 X1 X2 + 29.1 X1 X3 + 20.0 X2 X3 + 9.6 X12 + 26.6 X22 – 20.1 X32 (Eq. (2)) TPCLF = 206.4 + 4.9 X1 + 30.2 X2 – 6.5 X3 + 8.3 X1X2 + 8.4 X1X3 + 9.2 X2 X3 + 15.3 X12 + 15.7 X22 – 18.5 X32 (Eq. (3)) TPCOM = 226.2 + 3.3 X1 + 32.1 X2 –11.2 X3 + 9.1 X1X2 + 23.5 X1 X3 + 10.4 X2 X3 + 16.1 X12 +19.6 X22 – 29.0 X32 (Eq. (4)) TPCOF = 213.5 + 6.6 X1 + 19.9 X2 – 16.3 X3 + 2.3 X1X2 + 15.2 X1 X3 + 17.34 X2 X3 + 10.3 X12 + 6.7 X22 – 18.0.X32 (Eq. (5)) The fit of the mathematical model to the data is sometimes statistically evaluated. However, in RSM the quadratic model applied is usually assumed to fit the data sufficiently well to indicate properly the suitable and best region. Statistically the quality of the model fitted is evaluated by the application of ANOVA. First, the variation due to the treatment (i.e. change in the combination of variables) is compared to the variation due to random errors, inherent to the measurement of the produced responses. Consequently, one can evaluate the significance of the regression8. Secondly a lack-of-fit evaluation may also result from the analysis. The estimated coefficients of multiple determination (r2) of the quadratic polynomial models are given in Table 3. In addition, the adjusted coefficients of multiple determination, r2 adj were also calculated. The coefficient of multiple determination reflects the fraction of the total variability in the respose that is explained by the model.
[Table 3] 2 3 4 5 6 7 8 9 10 11 12 13 14 15 16 17 18 19 20 21 22 23 24 25 26 27 28 29 30 31 32 33 34 35 36 37 38 39 40 41 42 43 44 45 46 47 48 49 50 51 52 53 54 55 56 57 58 59 60
Analytical
Methods
Accepted
Manuscript
12
For a good fit of the model, r2 should be at least 80% 17. They were 0.96, 0.94, 0.93 and 0.94 for LM, LF, OM and OF, respectively (Table 3). This suggested that the second-order polynomial model describes well the behaviour of the response. The term r2adj represents the coefficient of determination that is adjusted for the number of coefficients included in the model; it allows comparison between models with different numbers of independent variables18. The models for LM, LF, and OM and OF gave r2adj values of 0.88, 0.84, 0.80, and 0.84, respectively. Thus, between 80 and 88% of the variability of the responses was explained, indicating applicability of the applied models19.
The p-value of all models (significance of regression) is less than 0.05, which indicates that these models are significant. In practice this value is always significant, else one has an absolute useless model. Furthermore, the lack-of-fit test is used as a more sensitive test of model fit, using the mean square of the pure error as the error term. A model will fit the experimental data when a significant regression and a non-significant lack-of-fit are found14; p-values of the lack-of-fit test were 0.52, 0.28, 0.36 and 0.18 for LM, LF, and OM and OF, respectively, which implies that the fitting of these models is adequate to describe the experimental data.
[Table 4]
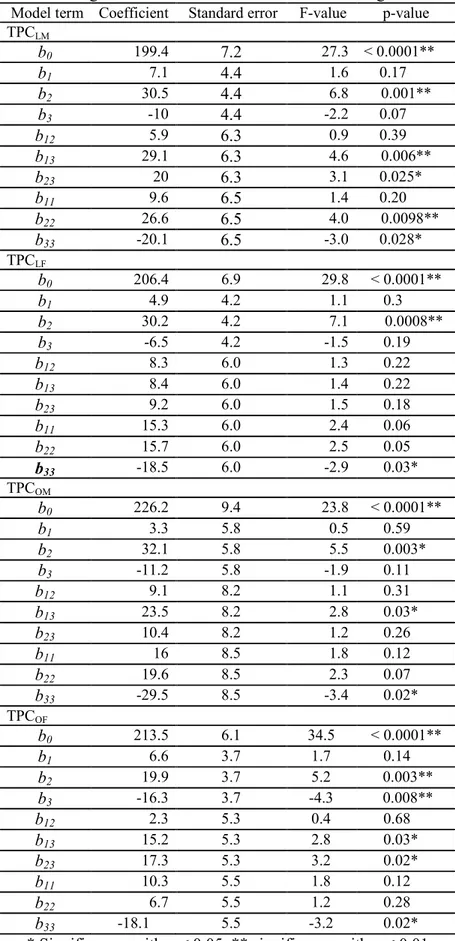
Overall, the results obtained indicate that the linear coefficient of the liquid-to-solid ratio (b2)
and the quadratic term of the extraction temperature (b33) significantly influenced the
responses (Table 4). The interaction between extraction time and temperature (b13) and the
quadratic term of the liquid-to-solid-ratio (b22) tended also to be significant for most
responses. The negative or positive signs of the regression coefficients indicate whether an increase in a factor level either causes a decrease or an increase in the considered response. Both genders of P. atlantica leaves had a similar result in the extraction of TPC which may 2 3 4 5 6 7 8 9 10 11 12 13 14 15 16 17 18 19 20 21 22 23 24 25 26 27 28 29 30 31 32 33 34 35 36 37 38 39 40 41 42 43 44 45 46 47 48 49 50 51 52 53 54 55 56 57 58 59 60
Analytical
Methods
Accepted
Manuscript
13
indicate that the tissues are basically the same or that phenolic compounds are synthesized by the same pathways.
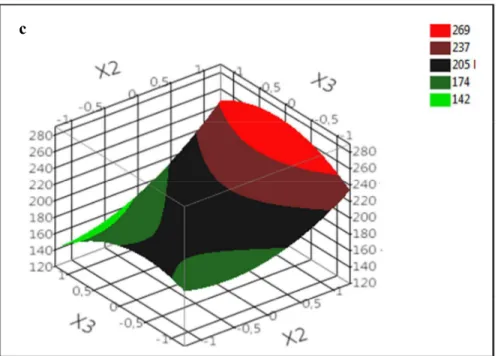
The relationship between the response and the factors as described in the built model can be visualised by plotting three-dimensional response surface plots (Fig. 4). Each plot shows the response as a function of a pair of factors, while keeping the third factor constant at its central level.
The influences of the ratio liquid-to-solid (X2) and extraction time (X1) on the TPC yield are
seen in Fig.4(a). The liquid-to-solid ratio has a positive relationship with TPC, which confirms Table 4. This behavior is in agreement with Prasad et al 20 who explained that when the liquid-to-solid ratio increased more solvent could enter the cells which allowes more phenolic compounds to permeate into the extract. The influence of the extraction time is limited, which also confirms the results of the Table 4.
[Figure 4]
The influences of the extraction time (X1) and extraction temperature (X3) on the TPC yield
are presented in Fig.4(b). The shape of the observed response surface is mainly due to the interaction term b13 and to the quadratic effect of the extraction temperature b33 (see Table 4),
since the linear effects (b1, b3) are not significant. Highest yields were observed at high
extraction times and intermediate temperatures. This was also observed by Tao et al 21, who found that a slight increase of temperature can improve the extracted phenolic content through an increase in phenolic solubility and diffusion rate, and a reduced solvent viscosity and surface tension. However, a further increase in temperature decreased the phenolics content, possibly caused by thermal degradation22. The behavior of the yield as a function of the temperature may indicate that the extract contained heat sensitive phenolic compounds. The predicted response surface showing the influence of the liquid-to-solid ratio (X2) and the
extraction temperature (X3) on TPC at constant time (48 h) is shown in Fig.4c. The shape of
2 3 4 5 6 7 8 9 10 11 12 13 14 15 16 17 18 19 20 21 22 23 24 25 26 27 28 29 30 31 32 33 34 35 36 37 38 39 40 41 42 43 44 45 46 47 48 49 50 51 52 53 54 55 56 57 58 59 60
Analytical
Methods
Accepted
Manuscript
14
the response surface is mainly due to the linear and quadratic terms (b2, b22) for the
liquid-to-solid ratio and to the quadratic for the extraction temperature (b33). Highest TPC yields were
observed at high liquid-to-solid ratios and intermedaite temperatures.
From the above, the following conclusions can be drawn. The models from both genders of P. atlantica leaves and from both regions were similar. The liquid-to-solid ratio had the most critical role in the extraction of phenolic compounds followed by the extraction temperature and the extraction time. Basically, the yield of phenolic compounds increased with an increase of the solvent-to-solid ratio. Cacace and Mazza23, discussed that the driving force during mass transfer is the concentration gradient between solid and liquid, which is higher when a higher solvent-to-solid ratio is used. On the other hand, time and temperature of the extraction are important variables to be optimized in order to minimize the energy cost of the process. The results revealed that extraction carried out at moderate temperatures of 45-50oC for extraction times of 48-72 h were enough to maximise the extraction of phenolic compounds. The intermediate temperature limits also the possible degradation of plant phenolics, which might be heat sensitive.
In order to select suitable extraction conditions for the phenolic compounds from P. atlantica leaves, the regression models (Eq. (2-5)) were used to predict the TPC for grid points situated in the region with best responses. Figure 5 show the 50 highest TPC predictions from this grid for extracts from LM, LF, OM and OF.
Optimal conditions predicted for LM, LF, and OM and OF were found at 72 h extraction time and 50:1ml/g liquid-to-solid ratio. The optimal extraction temperature predicted for LM (55°C) was slightly different from what was predicted for OM, LF and OF (48°C, 49 and 48°C, respectively). This was also seen on the response surfaces for X1 and X2 ( not shown). However, for most samples the intermediate temperature seems to be suitable.
[Figure 5] 2 3 4 5 6 7 8 9 10 11 12 13 14 15 16 17 18 19 20 21 22 23 24 25 26 27 28 29 30 31 32 33 34 35 36 37 38 39 40 41 42 43 44 45 46 47 48 49 50 51 52 53 54 55 56 57 58 59 60
Analytical
Methods
Accepted
Manuscript
15
Furthermore, the contents of phenolic compounds at these conditions were determined experimentally, and corresponded to 298, 282, 310 and 263 mg GAE/gDW for LM, LF, OM and OF, respectively.
Conclusion
Response surface methodology was successfully applied to optimize the maceration extraction of phenolic compounds from male and female leaves of P. atlantica, collected from two growing regions in Algeria. A second-order model was constructed to model the yield of phenolic compounds as a function of the liquid-to-solid ratio, extraction time and extraction temperature. The liquid-to-solid ratio was the most important factor affecting extraction efficiency. Male and female leaves of P. atlantica regardless of the origin, showed a similar behaviour in the extraction of phenolic compounds. Based on the models, the most efficient conditions for maceration extraction of P. atlantica leaves were found to be 72 hours extraction time with a liquid-to-solid ratio of 50:1 and a extraction temperature of about 50°C. Further study may be carried out at the optimum extraction conditions to elucidate the identity of the phenolic compounds responsible for the antioxidant properties of the P. atlantica leaves. 2 3 4 5 6 7 8 9 10 11 12 13 14 15 16 17 18 19 20 21 22 23 24 25 26 27 28 29 30 31 32 33 34 35 36 37 38 39 40 41 42 43 44 45 46 47 48 49 50 51 52 53 54 55 56 57 58 59 60
Analytical
Methods
Accepted
Manuscript
16 References
1. V. Samavati, M. Adeli, Carbohydrate Polymers, 2011,101, 890-896.
2. M. Bozorgi, Z. Memariani, M. Mobli, M.H. Salehi Surmaghi, M.R. Shams-Ardekani, R. Rahimi, Scientific World Journal, 2013, 2013, 1-3.
3. Z. Ben Ahmed, M. Yousfi, J. Viaene, B. Dejaegher, K. Demeyer, D. Mangelings, Y. Vander Heyden, Microchemical Journal, 2016,128, 208-217.
4. S. Remila, D. Atmani-Kilani, S. Delemasure, J.L. Connat, L. Azib, T. Richard, D. Atmani, European Journal of Integrative Medicine, 2015, 7(3), 274-286.
5. M. Yousfi, A. Djeridane, I. Bombarda, H.Chahrazed, B. Duhem, E.M. Gaydou, Phytotherapy Research, 2009, 23, 1237-1242.
6. A. Khoddami, M.A. Wilkes, T.H. Roberts, Molecules, 2013, 18, 2328-2375.
7. B. Dejaegher, Y. Vander Heyden, Journal of Pharmaceutical and Biomedical Analysis, 2011, 56(2), 141-158.
8. M.A. Bezerra, R.E. Santelli, E.P. Oliveira, L.S. Villar, L.A. Escaleira, Talanta, 2008,76(5), 965-977
9. A. Khoddami, M.A. Wilkes, T.H. Roberts, Molecules, 2013, 18, 2328-2375. 10. H. Teng, Y.H. Choi, Food chemistry, 2014, 142, 299-305.
11. M. Chen, Y. Zhao, S. Yu, Food chemistry, 2015, 172, 543-550.
12. Q.D. Do, A.E. Angkawijaya, P.L. Tran-Nguyen, L.H. Huynh, F.E. Soetaredjo, S. Ismadji, Y. H. Ju, Journal of Food and Drug Analysis, 2014, 22(3), 296-302.
13. S.N. Lou, Y.S. Lin, Y.S. Hsu, E.M. Chiu, C.T. Ho, Food Chemistry, 2014, 161, 246-253.
14. J. Wu, D. Yu, H. Sun, Y. Zhang, W. Zhang, F. Meng, X. Du, Industrial Crops and Products, 2015, 69, 68-75. 2 3 4 5 6 7 8 9 10 11 12 13 14 15 16 17 18 19 20 21 22 23 24 25 26 27 28 29 30 31 32 33 34 35 36 37 38 39 40 41 42 43 44 45 46 47 48 49 50 51 52 53 54 55 56 57 58 59 60
Analytical
Methods
Accepted
Manuscript
17
15. M.H. Majd, A. Rajaei, D.S. Bashi, S.A. Mortazavi, S. Bolourian, Industrial Crops and Products, 2014, 57, 195-202.
16. E. Viacava, S.I. Roura, M.V. Agüero, Chemometrics and Intelligent Laboratory Systems, 2015, 146, 47-54.
17. H.A. Emeko, A.O. Olugbogi, BioResources, 2015, 10, 2067-2082. 18. A. Emeko, A.O. Olugbogi, BioResources, 2015, 10, 2067-2082.
19. D. Pingret, A.S. Fabiano-Tixier, C. Le Bourvellec, C.M. Renard, F. Chemat, Journal of Food Engineering, 2012, 111, 73-81.
20. L. Qian, Y. Ping, L. Yunbai, Materials & Design, 2013, 50, 191-197.
21.K.N. Prasad, E. Yang, C. Yi, M. Zhao, Y. Jiang, Innovative Food Science & Emerging Technologies, 2009, 10(2), 155-159.
22. Y. Tao, Z. Zhang, D.W. Sun, Ultrasonics sonochemistry, 2014, 21(5), 1839-1848. 23. E. Kiassos, S. Mylonaki, D.P. Makris, P. Kefalas, Innovative Food Science &
Emerging Technologies, 2009, 10, 246-252.
24. J. E. Cacace, G. Mazza, Journal of Food Science, 2003, 68, 240-248. 2 3 4 5 6 7 8 9 10 11 12 13 14 15 16 17 18 19 20 21 22 23 24 25 26 27 28 29 30 31 32 33 34 35 36 37 38 39 40 41 42 43 44 45 46 47 48 49 50 51 52 53 54 55 56 57 58 59 60
Analytical
Methods
Accepted
Manuscript
18 Tables Table 1. Factors and their levels varied in the BBD.
Factor Level -1 0 1
Extraction time (X1,h) 24 48 72
Liquid-to-solid ratio (X2, ml/g) 30 :1 40 :1 50 :1
Extraction temperature (X3,°C) 35 45 55
Table 2. BBD for three factors both with coded and real level values. The average response
results (n=3) for TPC yield (mg GAE/g DW) are also shown.
Experiment Factors Response Extraction time (X1,h) Liquid-to-solid ratio (X2, ml/g) Extraction Temperature (X3, °C) TPCLM TPCLF TPCOM TPCOF 1 (0) 48 (0) 40 (0) 45 212.4 203.5 240.1 219.0 2 (-1) 24 (0) 40 (1) 55 152.4 192.5 181.6 174.6 3 (1) 72 (-1) 30 (0) 45 215.5 214.6 239.6 224.7 4 (0) 48 (-1) 30 (-1) 35 206.3 187.6 197.1 213.2 5 (-1) 24 (-1) 30 (0) 45 199.2 210.4 235.7 209.2 6 (1) 72 (0) 40 (+1) 55 211.3 208.5 219.7 211.5 7 (0) 48 (+1) 50 (-1) 35 231.6 240.2 256.3 231.0 8 (0) 48 (0) 40 (0) 45 198.3 216.0 224.8 213.2 9 (1) 72 (+1) 50 (0) 45 284.2 281.2 306.5 256.8 10 (1) 72 (0) 40 (-1) 35 167.2 197.0 196.6 206.4 11 (-1) 24 (1) 50 (0) 45 244.1 243.7 265.8 231.8 12 (0) 48 (-1) 30 (+1) 55 140.3 148.5 155.4 138.5 13 (-1) 24 (0) 40 (-1) 35 225.1 215.0 252.8 230.4 14 (0) 48 (+1) 50 (+1) 55 245.8 238.2 256.3 225.7 15 (0) 48 (0) 40 (0) 45 187.6 199.7 213.7 208.3
LM: male leaves of Laghouat region, LF: female leaves of Laghouat region, OM: male leaves of Ain oussera region, and OF: female leaves of Ain oussera region. (-1): low level, (0): middle level and (+1) high level.
Table 3. Analysis of the response surface quadratic model
Response r2 r2(adj) F-value
of model p-value of model F-value of Lack of fit p-value of Lack of fit TPCLM 0.96 0.88 12.95 0.006 1.04 0.52 TPCLF 0.94 0.84 9.28 0.012 2.65 0.28 TPCOM TPCOF 0.93 0.94 0.80 0.84 7.59 9.44 0.019 0.018 1.89 6.00 0.36 0.17 2 3 4 5 6 7 8 9 10 11 12 13 14 15 16 17 18 19 20 21 22 23 24 25 26 27 28 29 30 31 32 33 34 35 36 37 38 39 40 41 42 43 44 45 46 47 48 49 50 51 52 53 54 55 56 57 58 59 60
Analytical
Methods
Accepted
Manuscript
19
Table 4. Regression coefficients and their statistical significance
Model term Coefficient Standard error F-value p-value
TPCLM b0 199.4 7.2 27.3 < 0.0001** b1 7.1 4.4 1.6 0.17 b2 30.5 4.4 6.8 0.001** b3 -10 4.4 -2.2 0.07 b12 5.9 6.3 0.9 0.39 b13 29.1 6.3 4.6 0.006** b23 20 6.3 3.1 0.025* b11 9.6 6.5 1.4 0.20 b22 26.6 6.5 4.0 0.0098** b33 -20.1 6.5 -3.0 0.028* TPCLF b0 206.4 6.9 29.8 < 0.0001** b1 4.9 4.2 1.1 0.3 b2 30.2 4.2 7.1 0.0008** b3 -6.5 4.2 -1.5 0.19 b12 8.3 6.0 1.3 0.22 b13 8.4 6.0 1.4 0.22 b23 9.2 6.0 1.5 0.18 b11 15.3 6.0 2.4 0.06 b22 15.7 6.0 2.5 0.05 b33 -18.5 6.0 -2.9 0.03* TPCOM b0 226.2 9.4 23.8 < 0.0001** b1 3.3 5.8 0.5 0.59 b2 32.1 5.8 5.5 0.003* b3 -11.2 5.8 -1.9 0.11 b12 9.1 8.2 1.1 0.31 b13 23.5 8.2 2.8 0.03* b23 10.4 8.2 1.2 0.26 b11 16 8.5 1.8 0.12 b22 19.6 8.5 2.3 0.07 b33 -29.5 8.5 -3.4 0.02* TPCOF b0 213.5 6.1 34.5 < 0.0001** b1 6.6 3.7 1.7 0.14 b2 19.9 3.7 5.2 0.003** b3 -16.3 3.7 -4.3 0.008** b12 2.3 5.3 0.4 0.68 b13 15.2 5.3 2.8 0.03* b23 17.3 5.3 3.2 0.02* b11 10.3 5.5 1.8 0.12 b22 6.7 5.5 1.2 0.28 b33 -18.1 5.5 -3.2 0.02*
* Significance with p < 0.05, ** significance with p < 0.01 2 3 4 5 6 7 8 9 10 11 12 13 14 15 16 17 18 19 20 21 22 23 24 25 26 27 28 29 30 31 32 33 34 35 36 37 38 39 40 41 42 43 44 45 46 47 48 49 50 51 52 53 54 55 56 57 58 59 60
Analytical
Methods
Accepted
Manuscript
20 Figures 15 min 1h 3h 6h 12h 24h 36h 48h 60h 72h 84h 96h 0 50 100 150 200 250 T P C ( m g G A E /g D W ) Extraction time g f e d c bc ab ab a a ab ab
Fig.1. Effect of the extraction time on the total phenolic content. Values marked by the same
letter are not significantly different (p > 0.05) according to an SNK post hoc test.
20:1 30:1 40:1 50:1 60:1 0 50 100 150 200 250 300 T P C ( m g G A E /g D W ) Liquid-to-soild ratio (ml/mg) c b a c c
Fig.2. Effect of the liquid-to-solid ratio on the total phenolic content. Values marked by the
same letter are not significantly different (p > 0.05) according to an SNK post hoc test. 2 3 4 5 6 7 8 9 10 11 12 13 14 15 16 17 18 19 20 21 22 23 24 25 26 27 28 29 30 31 32 33 34 35 36 37 38 39 40 41 42 43 44 45 46 47 48 49 50 51 52 53 54 55 56 57 58 59 60
Analytical
Methods
Accepted
Manuscript
21 20 25 30 35 40 45 50 55 60 0 50 100 150 200 250 300 T P C ( m g G A E /g D W ) Extraction temperature (°C) bc ab a c
Fig.3. Effect of the extraction temperature on the total phenolic content. Values marked by
the same letter are not significantly different (p > 0.05) according to an SNK post hoc test. 2 3 4 5 6 7 8 9 10 11 12 13 14 15 16 17 18 19 20 21 22 23 24 25 26 27 28 29 30 31 32 33 34 35 36 37 38 39 40 41 42 43 44 45 46 47 48 49 50 51 52 53 54 55 56 57 58 59 60
Analytical
Methods
Accepted
Manuscript
22 a b 2 3 4 5 6 7 8 9 10 11 12 13 14 15 16 17 18 19 20 21 22 23 24 25 26 27 28 29 30 31 32 33 34 35 36 37 38 39 40 41 42 43 44 45 46 47 48 49 50 51 52 53 54 55 56 57 58 59 60
Analytical
Methods
Accepted
Manuscript
23
Fig. 4. Response surface plot showing the effect of (a) extraction time (X1) and liquid-to-solid
ratio (X2), (b) Extraction time (X1) and extraction temperature (X3), (c) liquid-to-solid ratio
(X2) and extraction temperature (X3) on TPCLF.
c 2 3 4 5 6 7 8 9 10 11 12 13 14 15 16 17 18 19 20 21 22 23 24 25 26 27 28 29 30 31 32 33 34 35 36 37 38 39 40 41 42 43 44 45 46 47 48 49 50 51 52 53 54 55 56 57 58 59 60
Analytical
Methods
Accepted
Manuscript
24 ‘d
.
Fig.7. Predicted TPC values (50 highest) of (a.
-1 -0.5 0 0.5 1 -1 -0.5 0 0.5 1 -1 -0.5 0 0.5 1 time ratio te m p e ra tu re * 295.97 ≤ TPC ≤ 298.57 * 290.61 ≤ TPC ≤ 295.57 a -1 -0.5 0 0.5 1 -1 -0.5 0 0.5 1 -1 -0.5 0 0.5 1 time ratio te m p e ra tu re * 281.1 ≤ TPC ≤ 282.8 * 277.60 ≤TPC ≤ 281 b -1 -0.5 0 0.5 1 -1 -0.5 0 0.5 1 -1 -0.5 0 0.5 1 time ratio te m p e ra tu re * 308.72 ≤ TPC ≤ 310.92 * 304.71 ≤ TPC ≤ 308.59 c -1 -0.5 0 0.5 1 -1 -0.5 0 0.5 1 -1 -0.5 0 0.5 1 time ratio te m p e ra tu re * 262.07 ≤ TPC ≤ 263.25 * 254.20 ≤ TPC ≤ 261.78 d
Fig.5. Predicted TPC values (50 highest), for different grid points, as a function of extraction time,
liquid-to-solid ratio and extraction temperature (for results from (a) LM, (b) LF, (c) OM, and (d) OF) 2 3 4 5 6 7 8 9 10 11 12 13 14 15 16 17 18 19 20 21 22 23 24 25 26 27 28 29 30 31 32 33 34 35 36 37 38 39 40 41 42 43 44 45 46 47 48 49 50 51 52 53 54 55 56 57 58 59 60