EVALUATION OF BIOCONVERSION CONDITIONS ON REUTERIN PRODUCTION USING RESPONSE SURFACE
METHODOLOGY AND LISTERIA MONOCYTOGENES AS TARGET BACTERIA
Khanh Dang Vu
1, Stéphane Salmieri
1, Aguilar-Uscanga Blanca Rosa
2, Monique Lacroix
1*Address(es): 1
Research Laboratories in Sciences Applied to Food, Canadian Irradiation Center, INRS-Institut Armand-Frappier, Institute of Nutraceutical and Functional Foods, 531, Boulevard des Prairies, Laval, Québec, Canada, H7V 1B7.
2Centro Universitario de Ciencias Exactas e Ingeniería. Universidad de Guadalajara, Jalisco, México. Boulevard Marcelino García Barragán #1421, Col. Olímpica. Guadalajara, Jalisco C.P. 44430 México.
*Corresponding author: Monique.Lacroix@iaf.inrs.ca
ABSTRACT
Keywords: Antibacterial activity, Reuterin, Lactobacillus reuteri, Listeria monocytogenes, response surface methodology
INTRODUCTION
Lactobacillus reuteri is a member of gastrointestinal bacteria of healthy human and animals. It has been demonstrated as a potential probiotic bacterium in biodetoxification and health stimulation, (van Niel et al., 2012) and in immunomodulation (Mechoud et al., 2012). Further, L. reuteri is well-known as a producer of 3-hydroxypropionaldehyde (3-HPA) or reuterin during anaerobic metabolism of glycerol (Axelsson et al., 1989; Chung et al., 1989). Glycerol is converted to reuterin by a coenzyme B12-dependent dehydratase (Talarico and
Dobrogosz, 1990). Reuterin can be further reduced by NADH to form
1,3-propanediol which is catalyzed by 1,3-1,3-propanediol: NAD oxidoreductase (Talarico et al., 1990). Reuterin can inhibit the growth of yeast, protozoa, and many bacteria, both Gram-negative and Gram-positive (Axelsson et al., 1989;
Chung et al., 1989).
Reuterin is water soluble compound, and it is active in a wide range of pH. It is also resistance to proteolytic and lipolytic enzymes (El-Ziney et al., 2000;
Vollenweider and Lacroix 2004). Therefore, potential of using reuterin for
preservation of food products are of great interest (El-Ziney and Debevere
1998; Arqués et al., 2004; Montiel et al.,, 2014). Reuterin could inhibit the
growth of pathogenic bacteria such as Listeria monocytogenes, and Escherichia coli O157: H7 in milk and cottage cheese (El-Ziney and Debevere 1998), L. monocytogenes in cold-smoked salmon (Montiel et al., 2014). A synergistic effect of reuterin plus nisin against L. monocytogenes and Staphylococcus aureus was obtained in refrigerated milk at the end of storage of 12 days (Arqués et al.,
2004).
It has been found that L. monocytogenes was more resistant to reuterin than some other bacteria. For example, reuterin at the same activity (8 U/ml) was more effective in eliminating Staphylococcus aureus than L. monocytogenes at 37 °C in milk (Arqués et al., 2004). Similarly, it has been observed that E. coli strains were sensitive to reuterin than Listeria strains including L. monocytogenes
(El-Ziney et al., 2000). Thus, it is important to find suitable conditions so that L.
reuteri can produce high reuterin concentration to eliminate L. monocytogenes in food products.
It has been demonstrated that several factors such as the glycerol and biomass concentrations, incubation time, temperature and pH can influence on reuterin production produced by L. reuteri (Lüthi-Peng et al., 2002a,b; Tobajas et al.,
2007). However, most of studies focused on evaluation of varying effect of a
single factor while other factors were fixed on reuterin activity and therefore, the possible interactive effects among different factors on reuterin production by L. reuteri could not be established.
Response surface methodology (RSM) is known as a combination of mathematical and statistical techniques for optimization of a process where dependent factors are affected by several independent factors. This method can be used to determine the possible interactive effects among different independent factors on the dependent factors in an experimental design (Adjalle et al., 2011;
Khan et al., 2014).
Thus, the aim of this study was to evaluate the interactive effects of bioconversion condition on reuterin activity against L. monocytogenes using RSM. A central composite consisting of three independent factors (glycerol concentration, L. reuteri concentration and incubation time) at 5 levels was designed. The design formed 18 experimental bioconversion conditions. Reuterin production or relative reuterin concentration expressed through its activity (Units per ml, U/ml) against L. monocytogenes was determined using microbroth dilution method.
MATERIALS AND METHODS Bacterial and growth conditions
Lactobacillus reuteri ATTCC 53608 was used in this study. The stock culture of L. reuteri in MRS broth containing 10 % glycerol was preserved as aliquot of 1 ml in cryovial tubes at -80 oC. Before each experiment, one ml of stock culture was inoculated into test tube containing 9 ml of MRS broth, incubated at 37oC for The objective of this study was to evaluate the effect of bioconversion conditions on reuterin production by Lactobacillus reuteri using response surface methodology (RSM). A central composite design consisted of three independent factors at 5 levels: concentration of Lactococcus reuteri (log CFU/ml), glycerol concentration (mM), and incubation time (h) was set up and consisted of 18 experimental runs. The dependant factor was the relative reuterin concentration expressed through its antibacterial activity (Units reuterin per ml, U/ml) against L. monocytogenes using microbroth dilution assay. A polynomial equation for prediction of reuterin production (U/ml) produced by L. reuteri was created based on obtained data. Results showed that incubation time, bacterial and glycerol concentrations had linear positive effects on reuterin production. The quadratic effect of incubation time had negative effect on reuterin production in which at a fixed bacterial concentration of L. reuteri, a longer incubation time with low concentration of glycerol will cause the reduction in relative reuterin concentration. It was found that approximately 450 U/ml can be produced by L. reuteri with glycerol concentration ranging from 320 to 340 mM mM, L. reuteri concentration of 9.4 log CFU/ml and 2 h of incubation. Results demonstrated that applying suitable conditions for glycerol bioconversion into reuterin by L. reuteri, a high relative reuterin concentration could be obtained and used for food preservation against L. monocytogenes.
ARTICLE INFO Received 18. 1. 2017 Revised 15. 11. 2017 Accepted 5. 12. 2016 Published 1. 2. 2017 Regular article doi: 10.15414/jmbfs.2017.6.4.1007-1011
24 h to obtain pre-inoculum. Then, the pre-inoculum (1.5 ml) was inoculated in Erlenmeyer containing 30 ml of MRS broth and incubated at 37 oC for 24 h to obtain inoculum.
L. monocytogenes 2812 stock cultures were stored at -80 °C in Tryptic Soya Broth broth medium containing glycerol (10% v/v). Before each experiment, stock cultures were grown through two consecutive 24 h growth cycles in Tryptic Soya Broth at 37 °C. The cultivated cultures were centrifuged at 5000 g for 15 minutes and the obtained pellets were washed twice in sterile saline water (0.85% w/v) to obtain working cultures containing approximately 109 CFU/mL. The working cultures were diluted in sterile saline water (0.85 %, w/v) to have final concentration of 106 CFU/ml. This bacterial solution was then used for microbroth dilution assay to evaluate relative reuterin activity (U/ml).
Biomass production of L. reuteri
Preliminary experiment on the effect of fermentation time on reuterin production and on its antibacterial activity showed that biomass of L. reuteri collected at the end of exponential phase (24 h of fermentation) gave better antimicrobial activity against L. monocytogenes. Therefore, biomass of L. reuteri was collected at 24 h of fermentation.
The inoculum of L. reuteri was inoculated (5%, v/v) into Erlenmeyers containing 200 ml of MRS broth. The Erlenmeyers were incubated in an incubator at 37 oC under static conditions for 24 h. The fermented broth was collected in centrifugal tubes and centrifuged at 5,000 x g for 10 min at 4oC. The supernatant was discarded and biomass was washed twice with 50 mM sodium phosphate buffer (pH 7.5) to eliminate residual components of culture medium (MRS broth). The washing step was conducted by suspended biomass in 50 mM sodium phosphate buffer, then centrifuged at 5000 x g for 10 minutes at 4oC and the supernatant was discarded after each washing step. Finally, biomass was suspended in 50 mM sodium phosphate buffer (pH 7.5). The cell concentration of L. reuteri (CFU/ml) in suspended biomass was enumerated by 10-fold serial dilution and plating on petri dishes containing MRS agar. Further, the suspended biomass was diluted by 1, 1.2, 1.4, 1.6, 1.8 and 2 folds and the optical density (OD) values of diluted
solutions were recorded at 595 nm. Based on cell concentration determined by plating counting method and the OD of different diluted solutions of suspended biomass, the linear correlation between CFU/ml and OD values was established. This correlation helped to determine the approximately bacterial concentration of L. reuteri in subsequent experiments based on OD value of the cultures.
Experimental design for reuterin production
A central composite consisting of 3 independent factors (glycerol concentration, bacterial concentration and incubation time) at 5 levels (Table 1) was designed to find the suitable conditions for reuterin production against L. monocytogenes. This included 18 experimental bioconversion conditions (Table 2).
Table 1 Level of independent factors in the central composite design
Independent factors Level
-2 -1 0 1 2 Glycerol concentration (X1, mM) 166 200 250 300 334 Bacterial concentration (X2, log
CFU/ml) 8.0 8.3 8.7 9.1 9.40
Incubation time (X3, h) 0.3 1 2 3 3.7 Bacterial suspension of L. reuteri at different concentrations was added into falcon tubes, and glycerol was added to obtain final concentration of bacteria and glycerol as required depending on each experimental condition (Table 2). The final volume of each falcon tube was 10 ml. The mixture in falcon tubes was mixed well and falcon tubes were anaerobically incubated at 37 oC for different periods (h) as required in the experimental design. Then, tubes were centrifuged at 5 000 x g for 10 minutes and supernatant was collected. The supernatant was filtered through a 0.45 µm filter. The supernatant was kept at 4 o
C and used for evaluation of its activity against L. monocytogenes using microbroth dilution assay.
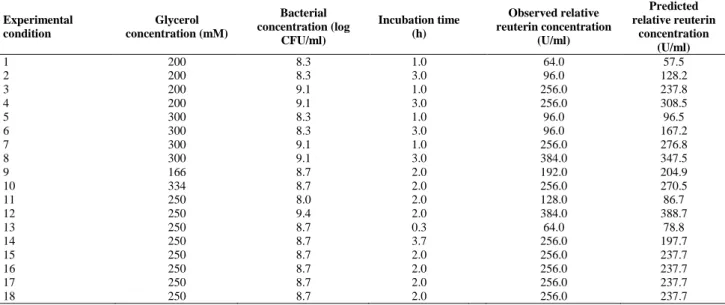
Table 2 Experimental runs and relative reuterin concentration Experimental condition Glycerol concentration (mM) Bacterial concentration (log CFU/ml) Incubation time (h) Observed relative reuterin concentration (U/ml) Predicted relative reuterin concentration (U/ml) 1 200 8.3 1.0 64.0 57.5 2 200 8.3 3.0 96.0 128.2 3 200 9.1 1.0 256.0 237.8 4 200 9.1 3.0 256.0 308.5 5 300 8.3 1.0 96.0 96.5 6 300 8.3 3.0 96.0 167.2 7 300 9.1 1.0 256.0 276.8 8 300 9.1 3.0 384.0 347.5 9 166 8.7 2.0 192.0 204.9 10 334 8.7 2.0 256.0 270.5 11 250 8.0 2.0 128.0 86.7 12 250 9.4 2.0 384.0 388.7 13 250 8.7 0.3 64.0 78.8 14 250 8.7 3.7 256.0 197.7 15 250 8.7 2.0 256.0 237.7 16 250 8.7 2.0 256.0 237.7 17 250 8.7 2.0 256.0 237.7 18 250 8.7 2.0 256.0 237.7
Evaluation of reuterin production (U/ml) using microbroth dilution assay
Reuterin production was evaluated by relative reuterin concentration which is expressed through its antibacterial activity (U/ml) using dilution assay (Chung et al., 1989). In this study, L. monocytogenes was used as target bacterial strain and the microbroth dilution assay with some modification was applied for evaluation of reuterin production (Turgis et al., 2012). The supernatants obtained from experimental conditions were diluted by 8, 12, 16, 24, 48, 96, 128 and 192 times using sterile sodium phosphate buffer (50 mM, pH 7.5). First, 125 µl of sterile Mueller-Hinton Broth (MHB) were filled into wells of a microplate. Then, 50 µl of reuterin solution at different concentrations were added into wells of eight columns of the microplate. Finally, 25 µl of working culture of L. monocytogenes (106 CFU/ml) were inoculated into the wells of six rows of the microplate. The last two rows containing MHB, different concentrations of reuterin and without L. monocytogenes served as blank. The columns containing MHB with L. monocytogenes and without reuterin served as positive control. The final volume of the wells in the microplate was 200 microliters. Thus, the final reuterin concentration in the tested wells was diluted by 4 fold. This factor plus the dilution level mentioned above (8, 12, 16, 24, 48, 96, 128 and 192) were considered in calculation the reuterin activity against L. monocytogenes. The microplate was incubated for 24 h at 37 oC, then, the optical absorbance (OD) of the microplate was measured at 595 nm using an Ultra Microplate Reader (Biotek
instruments, Winooski, VT, USA). Relative reuterin concentration (Unit reuterin per ml or U/ml) was calculated as the reciprocal of the highest dilution of the sample that can inhibit the growth of L. monocytogenes (Chung et al., 1989).
Statistical analysis
Data obtained from experimental design were used for analysis of variance (ANOVA), and regression analysis using STATISTICA 12 (STATSOFT Inc., Tulsa, US). A general second-order polynomial equation was built to predict reuterin production (equation 1).
𝑌 = 𝐵0+ ∑3𝑖=1𝐵𝑖𝑋𝑖 +∑𝑖=13 𝐵𝑖𝑖𝑋𝑖2+ ∑𝑖=12 ∑3𝑗=𝑖+1𝐵𝑖𝑗𝑋𝑖𝑋𝑗 (equation 1)
where Y is the predicted response; B0, intercept; Xi and X j are values of various levels of the independent variables; Bi is the values of linear coefficients; and Bii is the values of quadratic coefficients and Bij is the values of the interaction between 2 independent factors (Adjallé et al., 2011). Response surface plots were created to show the effects between the independent variables (glycerol concentration (X1), bacterial concentration (X2) and incubation time (X3)) on the reuterin production (U/ml).
RESULTS
Analysis of variance for reuterin production and regression coefficients of factors for the model
The relative reuterin concentrations (U/ml) of 18 experimental bioconversion conditions are presented in Table 2. It can be observed that depending on conditions of three independent factors (glycerol, bacterial concentrations and incubation time), the observed relative reuterin concentration could vary from minimum of 64 to maximum of 384 U/ml. The higher relative reuterin concentration (U/ml) of a sample means that even at higher factor of dilution of this sample, it can still have the capacity to eliminate L. monocytogenes in tested system.
Analysis of variance (ANOVA) was conducted and the model had a regression coefficient factor (R2) of 0.89, indicating that 89% of the variation in the responses could be explained by the combination of the responses. Further, there was no lack of fit of the model. Thus, the model can be used for prediction of reuterin production based on incubation time, glycerol, and bacterial concentration.
The reduced ANOVA table (after eliminating the factors which are not important in the model) is presented in Table 3. It can be observed that the linear effect of bacterial concentration was a very important factor on reuterin production (P = 0.000001). The linear and quadratic effects of incubation time were also important to affect reuterin production (P = 0.004). The linear effects of glycerol (P = 0.07) was important on reuterin production but less than those of incubation time and bacterial concentration (Table 3).
Table 3 Analysis of variance for reuterin production
Source Sum of square df P value
Glycerol concentration (L)* 5244.9 1 0.07 Bacterial concentration (L) 110631.7 1 0.000001 Incubation time (L) 17075.4 1 0.004 Incubation time (Q) 16846.3 1 0.004 Total sum of square 167876.5
* L and Q represent for linear and quadratic effect. There is no lack of fit of the model.
Table 4 Regression coefficients of the predictive model
Factors Regression Coefficient P value Constant -2032.00 0.000001 Glycerol concentration (L)* 0.39 0.07 Bacterial concentration (L) 225.39 0.000001 Incubation time (L) 175.94 0.0009 Incubation time (Q) -35.15 0.004
* L means Linear effect, Q means Quadratic effect.
The final regression coefficients of the factors for the model are presented in Table 4 and were used to create a predictive model (equation 2):
Y = -2032.00 + 0.39X1 + 225.39X2 +175.94X3 -35.15X32 (equation 2)
where Y = reuterin activity (U/ml); X1 is glycerol concentration (mM); X2 is L.
reuteri concentration (log CFU/ml); and X3 is incubation time (h).
It can be observed that all linear effect of glycerol, biomass and incubation time have positive effects on the reuterin production while the quadratic effect of incubation time have a negative impact on the activity (Table 3). Based on the model, the predicted values of relative reuterin concentration (U/ml) of experimental runs are also presented in the Table 2.
Response surface plots of the interactive effects between different independent factors on reuterin activity
Response surface plots of the relation between different independent factors on the reuterin production was created and expressed in Figure 1 to Figure 3.
Figure 1 Effect of glycerol concentration and incubation time on reuterin
production (bacterial concentration was fixed at 8.7 log CFU/ml)
Figure 1 presents the relation between glycerol concentration (X1, mM) and incubation time (X3, h) on reuterin production when the concentration of L.
reuteri (X2) was kept constant at 8.7 log CFU/ml. It can be observed that increase
in both incubation time (from 0.5 to about 2.5 h) and glycerol concentration (140-340 mM) can cause an increase in relative reuterin concentration; however, further increase in incubation time and at low glycerol concentration, a decrease in relative reuterin concentration can be occurred. For example, when the incubation time is around 1 h, and glycerol concentration is from 140 to approximately 200 mM, a relative reuterin concentration of equal or less than 140 U/ml can be produced by 8.7 log CFU/ml of L. reuteri (Figure 1). When glycerol concentration is from 280 to 340 mM and the incubation time is from 2 to 3 h, almost 300 U/ml can be produced by the same concentration of L. reuteri (8.7 log CFU/ml). However, when the incubation time is more than 3 h and glycerol concentration is less than 240 mM, relative reuterin concentration of less than 200 U/ml can be obtained (Figure 1). Thus with a fixed bacterial concentration of L. reuteri, a longer incubation time with low concentration of glycerol will cause the reduction in reuterin production.
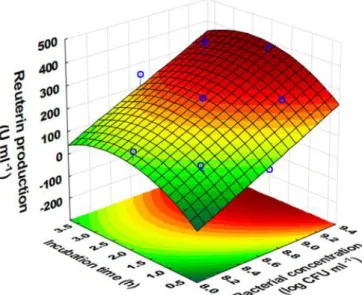
Figure 2 Effect of bacterial concentration and incubation time on reuterin
production (glycerol concentration was fixed at 250mM)
Figure 2 presents the relation between bacterial concentration (X2, log CFU/ml) and incubation time (X3, h) on reuterin production when glycerol concentration was kept constant at 250 mM. In general, it can be observed that the increase in bacterial concentration (from 8 to 9.4 log CFU/ml) and the increase in incubation time (from 0.5 to 2.5 h) cause a significant increase in relative reuterin concentration; however, further increase in incubation time (more than 2.5 h) of solution containing 250 mM glycerol with irrespective of bacterial concentrations
cause a decrease in reuterin production (Figure 2). It can be seen that high relative reuterin concentration (approximately 400 U/ml) can be obtained using 9.4 log CFU/ml of L. reuteri, 250 mM glycerol and 2.5 h of incubation. With the same conditions but with the incubation time of 3.5 h, only 350 U/ml against L. monocytogenes can be obtained.
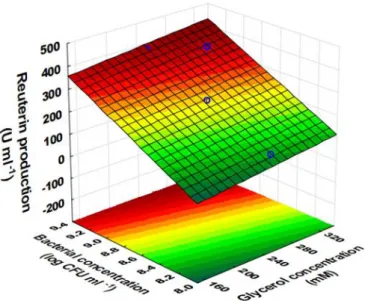
Figure 3 presents the interactive effects between glycerol concentration (X1, mM) and bacterial concentration (X2, log CFU/ml) on reuterin production when the incubation time was kept constant at 2h. It can be observed that increasing both L. reuteri and glycerol concentrations cause an increase in reuterin production. It is of interest to observe that since the incubation time is fixed, a lower concentration of glycerol require a higher concentration of bacteria or a higher concentration of glycerol require a lower concentration of bacteria to produce similar reuterin concentration (similar antilisterial activity). For example, when glycerol concentration is around 200 mM, and bacterial concentration is around 8.8 log CFU/ml, a relative reuterin concentration of approximately 200 U/ml can be obtained. Similarly, when glycerol concentration is around 280 mM, and bacterial concentration is around 8.6 log CFU/ml, a relative reuterin concentration of approximately 200 U/ml can also be obtained. With incubation time of 2 h, a higher relative reuterin concentration of approximately 450 U/ml can be obtained by using the bacterial concentration of approx. 9.4 log and a glycerol concentration of 320 to 340 mM (Figure 3). Figure 3 also showed that further increasing glycerol and bacterial concentration at fixed incubation time of 2 h may obtain higher relative reuterin concentration.
Figure 3 Effect of glycerol concentration and L. reuteri concentration on reuterin
production (incubation time was fixed at 2 h)
DISCUSSION
Reuterin (3-hydroxypropionaldehyde, 3HPA) is a low-molecule-weight, nonproteinaceous antimicrobial substance containing aldehyde group. Reuterin is not a bacteriocin (Vollenweider and Lacroix 2004) which is different with other proteinaceous bacteriocins which are produced by many other strains of lactic acid bacteria (LAB) Turgis et al., 2013). In addition to L. reuteri, some other bacterial genera such as Klebsiela, Enterobacter, Citrobacter, Clostridium, and Bacillus can also produce reuterin (Vollenweider and Lacroix 2004).
It has been observed that E. coli strains were sensitive to reuterin than Listeria strains including L. monocytogenes (El-Ziney et al., 2000). El-Ziney and
Debevere (1998) found that adding reuterin at 100 and 150 Units g-1 cheese caused a reduction of E. coli by 3 and 6 log CFU, respectively, while a reduction of 2 and 5 log was observed for L. monocytogenes at day 7 of storage. The results showed that L. monocytogenes was more resistant to reuterin than that of E. coli. Thus, to apply reuterin as an antimicrobial agent against foodborne pathogens such as L. monocytogenes, a high reuterin concentration is required. Therefore, current study focused on effects of different combined conditions (Table 2) on bioconversion glycerol into reuterin by L. reuteri and the relative reuterin concentration was evaluated through its activity against L. monocytogenes. It was found that incubation time, bacterial and glycerol concentration had positive effect on reuterin production. It showed that utilization of 320-340 mM glycerol, 9.4 log CFU/ml of L. reuteri and incubation time of 2 h, a high relative reuterin concentration of approximately 450 U/ml can be obtained (Figure 3). However, at a fixed concentration of bacterial and glycerol concentrations, longer incubation time caused a decrease in reuterin production. The decrease in relative reuterin concentration or its activity after long incubation time was also observed by other studies (Lüthi-Peng et al., 2002b). The decrease in its activity could be
due to reuterin was reduced to form 1,3-propanediol (Slininger et al., 1983;
Talarico et al., 1990; Vollenweider and Lacroix, 2004). Further, it is also
known that reuterin at high concentration can also be toxic for L. reuteri, the producer (Lüthi-Peng et al., 2002b; Vollenweider and Lacroix, 2004). Concerning the mechanism of action of reuterin, it was proposed that the aldehyde group of reuterin is mainly responsible for antimicrobial activity (Schaefer et al., 2010; Vollenweider et al., 2010). Schaefer et al., (2010) demonstrated that reuterin induce oxidative stress in target organisms. The authors confirmed that the aldehyde form interacting with thiol groups of small molecules and proteins of target organisms and cause growth inhibition. When cysteine was added into growth media of E. coli or Clostridium difficile before exposing to reuterin, the antibacterial effects of reuterin against these bacteria was suppressed (Schaefer et al., 2010). In other study, Vollenweider et al.,
(2010) demonstrated that reuterin induces a depletion of reduced glutathione
(GSH) in E. coli and then attack on protein- linked SH- groups, changing protein functions which finally result in cell death. Further, adding exogenous GSH caused an increase in intracellular GSH concentrations up to 9-fold and prevented the alteration of protein thiols, and resulted in rescuing the bacteria (Vollenweider et al., 2010). These properties explain for the reason why reuterin can act against a broad spectrum of bacteria, yeast, protozoa and it is a candidate for food preservation.
CONCLUSIONS
This study evaluated the bioconversion conditions including incubation time, glycerol and concentration of L. reuteri on reuterin production using response surface methodology and the relative reuterin concentration was expressed through its activity against L. monocytogenes. A polynomial predictive equation for relative reuterin concentration produced by L. reuteri was established. Incubation time, glycerol and L. reuteri concentrations had positive effects on reuterin production. At a fixed concentration of bacteria, longer incubation time and low concentration of glycerol caused a decrease in reuterin production. It was found that with glycerol concentration of 320-340 mM, 9.4 log CFU/ml of L. reuteri and 2 h of incubation, a high relative reuterin concentration of approximately 450 U/ml against L. monocytogenes can be obtained. Future study on application of reuterin alone or in combination with other antibacterial agents such as essential oils, organic acid salts to control L. monocytogenes or other foodborne pathogens in food products is necessary.
Acknowledgements: The authors sincerely thank Ministère de l’Économie, de
l’innovation et des Exportation (MDEIE), Canada for financial support. Emna Lahimer and Anne-Chloé Sanchette are sincerely thanked for their technical support during this study.
REFERENCES
Adjalle, K. D., Vu, K. D., Tyagi, R. D., Brar, S. K., Valero, J. R., & Surampalli, R. Y. (2011). Optimization of spray drying process for Bacillus thuringiensis fermented wastewater and wastewater sludge. Bioprocess Biosyst Eng, 34, 237-246. http://dx.doi.org/10.1007/s00449-010-0466-y
Arqués, J. L., Fernández, J., Gaya, P., Nuñez, M, Rodrı́guez, E., & Medina M. (2004) Antimicrobial activity of reuterin in combination with nisin against food-borne pathogens. Int. J. Food Microbiol, 95, 225-229.
http://dx.doi.org/10.1016/j.ijfoodmicro.2004.03.009
Arqués, J. L., Rodríguez, E., Nuñez, M., & Medina, M. (2011). Combined effect of reuterin and lactic acid bacteria bacteriocins on the inactivation of foodborne pathogens in milk. Food Control, 22, 457-461.
http://dx.doi.org/10.1016/j.foodcont.2010.09.027
Axelsson, L., Chung, T. C., Debrogosz, W. J., & Lindgren, S. (1989). Production of a broad spectrum antimicrobial substance by Lactobacillus reuteri. Microb
Ecol Health Dis, 2, 131-136. http://dx.doi.org/10.3402/mehd.v2i2.7449
Chung, T. C., Axelsson, L., Lindgren, S. E., & Dobrogosz, W. J. (1989). In vitro studies on reuterin synthesis by Lactobacillus reuteri. Microb. Ecol. Health Dis,
2, 137-144. http://dx.doi.org/10.3402/mehd.v2i2.7450
El-Ziney, M. G., & Debevere, J. M. (1998). The effect reuterin on Listeria monocytogenes and Escherichia coli O157:H7 in milk and cottage cheese. J. Food Prot, 61, 1275-1280.
El-Ziney, M. G., Bebevere, J. M., & Jackobsen, M. (2000). Reuterin. In: Naidu, A. S. [Ed.] Natural Food Antimicrobial Systems. CRC Press, LLC, Boca Raton, Florida, USA., pp. 567-588.
Khan, A., Vu, K. D., Chauve, G., Bouchard, J., Riedl, B., & Lacroix, M. (2014). Optimization of microfluidization for the homogeneous distribution of cellulose nanocrystals (CNCs) in biopolymeric matrix. Cellulose, 21, 3457-3468.
http://dx.doi.org/10.1007/s10570-014-0361-9
Lüthi-Peng, Q., Dileme, F. B., & Puhan, Z. (2002a). Effect of glucose on glycerol bioconversion by Lactobacillus reuteri. Appl Microbiol Biotechnol 59, 289-296.
http://dx.doi.org/10.1007/s00253-002-1002-z
Lüthi-Peng, Q, Schärer, S, & Puhan, Z. (2002b). Production and stability of 3-hydroxypropionaldehyde in Lactobacillus reuteri. Appl Microbiol Biotechnol, 60, 73-80. http://dx.doi.org/10.1007/s00253-002-1099-0
Mechoud, M. A., Mateos, M. V., de Valdez, G. F., Villena, J., Salvador, G. A., & Rodriguez, A.V. (2012). Lactobacillus reuteri CRL1098 soluble factors modulate tumor necrosis factor alpha production in peripheral blood mononuclear cells: Involvement of lipid rafts. Int Immunopharmacol, 14, 446-463.
http://dx.doi.org/10.1016/j.intimp.2012.08.020
Montiel, R., Martín-Cabrejas, I., Langa, S., El Aouad, N., Arqués, J. L., Reyes, F., & Medina M. (2014). Antimicrobial activity of reuterin produced by Lactobacillus reuteri on Listeria monocytogenes in cold-smoked salmon. Food
Microbiol 44, 1-5. http://dx.doi.org/10.1016/j.fm.2014.05.006
Schaefer, L., Auchtung. T. A., Hermans, K. E., Whitehead, D., Borhan, B., & Britton, R. A. (2010). The antimicrobial compound reuterin (3-hydroxypropionaldehyde) induces oxidative stressvia interaction with thiol groups. Microbiol, 156, 1589-1599. http://dx.doi.org/10.1099/mic.0.035642-0
Slininger, P. J., Bothast, R. J., & Smiley, K. L. (1983). Production of 3-hydroxypropionaldehyde from glycerol. Appl Environ Microbiol, 46, 62-67. Talarico, T. L., Axelsson, L. T., Novotny, J., Fiuzat, M., & Dobrogosz, W. J. (1990). Utilization of glycerol as a hydrogen acceptor by Lactobacillus reuteri: Purification of 1,3-propanediol:NAD+ oxidoreductase. Appl Environ Microbiol, 56, 943-948.
Talarico, T. L., & Dobrogosz, W. J. (1990). Purification and characterization of glycerol dehydratase from Lactobacillus reuteri. Appl Environ Microbiol, 56, 1195-1197.
Tobajas, M., Mohedano, A. F., Casas, J. A., & Rodríguez, J. J. (2007). A kinetic study of reuterin production by Lactobacillus reuteri PRO 137 in resting cells.
Biochem Eng J, 35, 218-225. http://dx.doi.org/10.1016/j.bej.2007.01.017
Turgis M., Vu, K. D., Dupont, C., & Lacroix, M. (2012). Combined antimicrobial effects of essential oils and bacteriocins against foodborne pathogens and food spoilage bacteria. Food Res Int, 48, 696-702.
http://dx.doi.org/10.1016/j.foodres.2012.06.016
Turgis, M., Vu K. D., & Lacroix M. (2013). Partial characterization of bacteriocin-producing Enterococcus faecium isolated from human intestine.
Probiotics Antimcirob Proteins, 5, 110-120.
http://dx.doi.org/10.1007/s12602-013-9129-z
van Niel, E. W. J., Larsson, C. E., Lohmeier-Vogel, E. M., & Rådström, P. (2012). The potential of biodetoxification activity as a probiotic property of
Lactobacillus reuteri. Int J Food Microbiol, 152, 206-210.
http://dx.doi.org/10.1016/j.ijfoodmicro.2011.10.007
Vancauwenberge, J. E., Slininger, P. J., & Bothast, R. J. (1990). Bacterial conversion of glycerol to ß-hydroxypropionaldehyde. Appl Environ Microbiol, 56, 329-332.
Vollenweider, S., & Lacroix C. (2004). 3-Hydropropionaldehyde: applications and perspectives of biotechnological production. Appl Microbiol Biotechnol, 64, 16-27. http://dx.doi.org/10.1007/s00253-003-1497-y
Vollenweider, S., Evers, S., Zurbriggen, K., & Lacroix, C. (2010). Unraveling the hydroxypropionaldehyde (HPA) system: an active antimicrobial agent against human pathogens. J Agric Food Chem, 58, 10315-10322.