HAL Id: pastel-00000632
https://pastel.archives-ouvertes.fr/pastel-00000632
Submitted on 31 Mar 2004HAL is a multi-disciplinary open access archive for the deposit and dissemination of sci-entific research documents, whether they are pub-lished or not. The documents may come from teaching and research institutions in France or abroad, or from public or private research centers.
L’archive ouverte pluridisciplinaire HAL, est destinée au dépôt et à la diffusion de documents scientifiques de niveau recherche, publiés ou non, émanant des établissements d’enseignement et de recherche français ou étrangers, des laboratoires publics ou privés.
control systems
Peter Riederer
To cite this version:
Peter Riederer. Thermal room modelling adapted to the test of hvac control systems. Engineering Sciences [physics]. École Nationale Supérieure des Mines de Paris, 2002. English. �pastel-00000632�
N° attribué par la bibliothèque Dokumentnummer |__|__|__|__|__|__|__|__|__|__| |__|__|__|__|__|__|__|__|__|__|
Thesis submitted in November 2001 for the combined degree of
"Docteur" and "Doktor-Ingenieur"
of the "Ecole des Mines de Paris" of the "TU Dresden"
Supervisor: Dominique MARCHIO Supervisor: Gottfried KNABE
Defended publicly at the "Ecole des Mines de Paris" by
Peter RIEDERER
28 of January 2002
THERMAL ROOM MODELLING ADAPTED TO THE
TEST OF HVAC CONTROL SYSTEMS
Award committee
Jérôme ADNOT ENSMP Paris, France Committee president
Arthur DEXTER University of Oxford, United Kingdom Reviewer
Peter GRUBER Siemens, Zug, Switzerland Committee member
Christian INARD University La Rochelle, France Reviewer
This PhD is submitted in accordance to the conditions for attaining both the French and the German degree of a PhD, on a co-national basis, in the frame of a statement of the French
government from January 18th, 1994.
The research has been carried out in the Automation and Energy Management Group (AGE), Department of Sustainable Development (DDD), at the “Centre Scientifique et Technique du Bâtiment” (CSTB) in Marne la Vallée, France, in collaboration with the “Centre Energétique” (CENERG) at the "Ecole Nationale Supérieure des Mines de Paris" (ENSMP), Paris, France. The Technical University of Dresden (TUD), Germany has been the partner for the co-national supervision of the work.
This work could not have been completed without the support and help of many people and institutions, for which I am very grateful.
The supervisors have been Dominique MARCHIO from ENSMP and Jean Christophe VISIER from CSTB and I would like to express my gratitude for their guidance, advice and motivation during these three years.
I would like to thank Gottfried KNABE, supervisor from the TUD, for his guidance and effort in order to extend this PhD to a co-national diploma and for having accepted to review this work. I am especially grateful to Arthur DEXTER for his hospitality, his support and many technical discussions during my visiting period at the University of Oxford, United Kingdom, and who also accepted both to be reviewer of this thesis and member of the award committee.
To Christian INARD from the University of La Rochelle, France, who reviewed this thesis and participated at the award committee, I would also like to express my gratitude.
Many thanks to Peter GRUBER from Siemens, Switzerland, for the fruitful collaboration in the SIMTEST project, for reviewing this thesis and for being member of the award committee.
Thanks also to Jérôme ADNOT, director of the Doctoral program at CENERG who has also accepted to be member and president of the award committee,
I would also like to thank Rofaïda Lahrech and Ahmad Husaunndee for many help and discussions concerning this work; furthermore thanks to Stéphane COUTURIER for the CFD analysis of the EREDIS test room.
I also would like to thank in no particular order:
- Fabien BRUYAT, CSTB, for his various collaborations and his help,
- Jean Pierre QUENISSET, CSTB, for all his help to prepare the EREDIS test room, - Hossein VAEZI-NEJAD and Mireille JANDON, CSTB, for technical discussion, - Pierre RICHARD and Bruno BERTHINEAU, CSTB, for their help and advice, - Jacques RIBERON and Bernard COLLIGNAN, CSTB, for technical discussions, - Chantal PITZALIS and Marlène STRITTER, CSTB, for all administrational support,
- Philippe DUCHENE-MARRULAZ, CSTB, for the hospitality at the department of
Sustainable Development,
- Anne Marie POUGIN,CENERG for all administrational help at the ENSMP, - Renaud GICQUEL and Denis CLODIC, CENERG, for the hospitality at CENERG,
Finally, I want to thank my parents, my family, my friends and Chay for accepting neglection of social contacts on my part and for supporting me in so many ways.
room model is developed, assuming non-homogeneous room conditions and distinguishing between different sensor positions. From measurement in real test rooms and detailed CFD simulations, a list of convective phenomena is obtained that has to be considered in the development of a model for a room equipped with different HVAC systems.
The zonal modelling approach that divides the room air into several sub-volumes is chosen, since it is able to represent the important convective phenomena imposed on the HVAC system. The convective room model is divided into two parts: a zonal model, representing the air at the occupant zone and a second model, providing the conditions at typical sensor positions. Using this approach, the comfort conditions at the occupant zone can be evaluated as well as the impact of different sensor positions. The model is validated for a test room equipped with different HVAC systems. Sensitivity analysis is carried out on the main parameters of the model.
Performance assessment and energy consumption are then compared for different sensor positions in a room equipped with different HVAC systems. The results are also compared with those obtained when a well-mixed model is used.
A main conclusion of these tests is, that the differences obtained, when changing the position of the controller's sensor, is a function of the HVAC system and controller type. The differences are generally small in terms of thermal comfort but significant in terms of overall energy consumption.
For different HVAC systems the cases are listed, in which the use of a simplified model is not recommended.
KEYWORDS: HVAC control, emulation, simulation, room model, zonal model, sensor position, convective room phenomena,
performance assessment of room controllers, energy consumption, graphical programming
RÉSUMÉ:
L'étude des régulateurs utilise à ce jour des modèles de zone à un seul nœud d'air. Un nouveau modèle de zone, distinguant les différentes positions possibles du capteur est développé dans cette thèse.A partir d'une étude expérimentale en chambre climatique et de simulations sur code CFD, on établit la liste des phénomènes thermiques et aérauliques, à prendre en compte lors du développement du modèle pour différents systèmes de chauffage et de climatisation.
L'approche zonale, divisant l'air d'une pièce en plusieurs sous-volumes, est choisie car elle est bien adaptée pour tenir compte des phénomènes convectifs caractérisant les différents systèmes de chauffage et de climatisation. Le modèle de zone est divisé en deux parties : un modèle zonal représentant l'ambiance occupée et un modèle supplémentaire relatif aux emplacements du capteur. Ainsi on peut évaluer les conditions de confort dans la zone d'occupation et l'impact des différentes positions du capteur. Le modèle est validé pour une cellule test équipée de différents systèmes de chauffage et de climatisation. Une analyse de sensibilité est ensuite menée afin de tester la sensibilité aux paramètres principaux du modèle.
La qualité de la régulation et la consommation d'énergie sont ensuite comparées pour différentes positions du capteur dans une pièce équipée de différents émetteurs et systèmes de climatisation. Les résultats sont comparés à ceux obtenus par un modèle à un nœud d'air.
La principale conclusion de cette thèse est que l'influence de la position du capteur est fortement fonction du système de chauffage et de climatisation et du type de régulateur. Les différences, en général négligeables en terme de confort de l'occupant, peuvent devenir importantes au niveau de la consommation d'énergie.
De ce fait, on peut définir pour quels systèmes de climatisation le modèle à un nœud d'air doit être remplacé par le modèle développé.
MOTS CLEFS: Régulation de température, simulation, modèle de zone, modèle zonal, position du capteur, phénomènes
convectifs, performance d'un régulateur, consommation d'énergie, environnement graphique
KURZFASSUNG:
In derzeitig für Reglerstudien verwendeten Raummodelle werden die Bedingungen im Raum als homogenes Gemisch betrachtet. Ein neues Modell wird entwickelt, welches unhomogene Raumbedingungen annimmt und zwischen verschieden Positionen des Sensors eines Raumtemperaturreglers unterscheidet.Unter Verwendung von Messergebnissen und detaillierten Simulationen in Räumen mit unterschiedlichen Heizungs-und Lüftungssystemen wird eine Liste konvektiver Phänomene erstellt, welche bei der Entwicklung eines geeigneten Raummodells beachtet werden müssen.
Die Methode des Zonenmodells, welche die Raumluft in kleinere Volumina unterteilt, wird angewandt, um die charakteristischen konvektiven Phänomene verschiedener Heizungs-und Lüftungssysteme zu berücksichtigen. Das Raummodell beinhaltet zwei Teile: ein Zonenmodel, welches die Bedingungen im Aufenthaltsbereich des Raumes wiedergibt und ein Modell, welches die Bedingungen an verschiedenen Sensorpositionen reproduziert. Auf diese Weise können gleichzeitig der Komfort im Aufenthaltsbereich des Raumes sowie der Einfluss unterschiedlicher Sensorpositionen beurteilt werden.
Das Raummodell wird für einen Testraum mit verschiedenen Heiz-und Lüftungssystemen validiert. Eine Sensibilitätsanalyse der wichtigsten Parameter des Modells wird durchgeführt.
Regelungsqualität sowie Energieverbrauch werden schließlich für unterschiedliche Sensorpositionen in einem Raum mit verschiedenen Heiz-und Lüftungssystemen verglichen. Die Ergebnisse werden außerdem denen von einem vereinfachten Raummodell gegenübergestellt.
Zusammenfassend kann gesagt werden, dass die Differenzen für wechselnde Sensorposition stark vom jeweiligen Heiz- oder Lüftungssystem und aber auch vom Reglertyp abhängig sind. Die Differenz ist zwar oft unbedeutend bezüglich des thermischen Komforts, kann aber signifikant bei Betrachtung des Energieverbrauchs werden.
This thesis presents the development of a room model that is adapted to the study of the influence of sensor position on the control of HVAC systems in buildings.
Models, currently used for control studies, are very simplified. They consider the room air as perfectly mixed even when the prevailing conditions are not at all homogeneous. Other models, actually used for comfort studies, are not adapted to control studies since they do not allow the study of dynamic behaviour at small time steps.
The temperature measured by the sensor of a room temperature controller, generally placed outside the occupancy zone of the room, depends on the convective coupling of the room and its HVAC system.
The important phenomena, to be represented in the model, are analysed experimentally and by detailed simulation in this thesis. This analysis brings forward a list of convective phenomena that has to be considered in the development of criteria for the new room model. A phenomenon of negatively buoyant air flow, for example, is observed to be significant for the measurement of a controller's sensor.
Another important issue when testing controllers is the method used to assess the control performance. Since it makes no sense to use very detailed room models, if the method of performance assessment is insensitive to the way in which the room is modelled, both issues must be treated simultaneously.
In order to take into account both important thermal phenomena in a room and constraints of performance assessment of controllers, the zonal model approach, dividing the air of the room into several sub-volumes, is selected and is then adapted to the requirements of controller tests.
A new room model is developed that distinguishes between three typical sensor positions. It is validated for different HVAC systems and operating modes. Sensitivity analysis is carried out for the main parameters of the model.
Controller performance and energy consumption are compared for cases of different sensor positions for a single room equipped with different HVAC systems as well as for a whole building complete with its VAV system and other building services (e.g. sun-blinds, lighting etc.). The results are compared with those obtained using a well-mixed model.
A main conclusion of these tests is that the differences obtained, when changing the position of the controller's sensor, is a function of the HVAC system and controller type. The differences are generally small in terms of thermal comfort but significant in terms of overall energy consumption. For different HVAC systems the cases are listed, in which a simplified model should not be used.
Un modèle de zone est développé dans cette thèse. Ce modèle est adapté à l'analyse de l'impact de la position du capteur d'un régulateur de systèmes de chauffage, ventilation, climatisation dans un environnement de simulation graphique modulaire.
Les modèles, couramment utilisés pour l'étude de la régulation, sont très simplifiés. Ils considèrent que l'air dans une pièce est parfaitement mélangé, ce qui ne correspond pas, dans la plupart des cas, à la réalité. Les modèles, utilisés pour l'étude du confort ne sont pas non plus adaptés à l'étude de la régulation qui s'intéresse au comportement dynamique à des pas de temps de simulation faibles. La température mesurée par le capteur est généralement différente de celle de la zone d'occupation et dépend fortement du couplage convectif entre l'air de la pièce et le système CVC installé.
Les phénomènes importants qui doivent être représentés sont déduits de l'expérimentation et de simulations détaillées. Un phénomène d'écoulement à poussée d'Archimède défavorable doit en particulier être représenté.
Une autre question importante pour le test de régulateurs est la méthode retenue pour l'évaluation de la performance d'un régulateur. Il n'est pas cohérent d'utiliser des modèles de zone très détaillés, si l'évaluation du confort n'est pas influencée par le choix du modèle.
L'approche zonale, divisant l'air d'une pièce en plusieurs sous-volumes, est choisie afin de tenir compte des phénomènes convectifs importants. Le modèle développé distingue trois positions typiques du capteur. Ce modèle est validé pour différents émetteurs et systèmes de climatisation et une analyse de sensibilité est menée sur ses paramètres principaux.
La qualité de la régulation et la consommation d'énergie sont comparées pour différentes positions du capteur dans une pièce, équipée de différents émetteurs et systèmes de climatisation, elle même incluse dans un bâtiment équipé d'un système à débit d'air variable. Les résultats sont finalement comparés à ceux obtenus avec le modèle à un nœud d'air.
La principale conclusion de cette thèse est que l'influence de la position du capteur est fortement fonction du système et du type de régulateur. Les différences, en général négligeables en termes de confort de l'occupant, peuvent devenir importantes au niveau de la consommation d'énergie. De ce fait, on peut définir pour quels systèmes de climatisation le modèle à un nœud d'air doit être remplacé par le modèle développé.
KURZFASSUNG
Es wird ein Raummodell entwickelt, welches die Studie des Einflusses verschiedener Positionen eines Raumtemperatursensors auf die Regelung von Heizungs-, Lüftungs- und Kühlsystemen ermöglicht.
Modelle, derzeitig für Reglertests verwendet, sind größtenteils sehr vereinfacht indem die Raumluft als perfekt vermischt angenommen wird, obgleich dies unter realen Bedingungen keineswegs der Fall ist. Andere Modelle, für Komfortstudien entwickelt, sind für den Einsatz in Reglertests kaum geeignet, da diese ungenügend die dynamischen Zustände im Raum berücksichtigen und außerdem nicht den kleinen Zeitschritten in regelungstechnischen Simulationen angepasst sind.
Der Sensor eines Reglers befindet sich nur in sehr seltenen Fällen im Aufenthaltsbereich des Raumes. Die vom Sensor gemessene Temperatur ist daher ungleich derer im Aufenthaltsbereich und stark von der konvektiven Kopplung zwischen Raum und Heizungs- oder Lüftungssystem abhängig. Die im Raummodell zu berücksichtigenden thermischen Phänomene werden experimentell und mit Hilfe detaillierter Simulationen analysiert. Eine Liste aller wichtigen Phänomene wird erstellt. Es wird zum Beispiel in vielen Heizfällen eine Warmluftströmung im Bereich des Sensors beobachtet, welche die Messung des Sensors beeinflusst.
Ein weiterer wichtiger Punkt bei der Erstellung eines Raummodells ist die Methode, mit welcher die Qualität der Raumregelung letztendlich beurteilt wird. Da es keinen Sinn macht, ein detailliertes Raummodell zu verwenden, wenn die Reglerklassifizierung nicht oder nur kaum von der Wahl des Raummodells beeinflusst wird, müssen Aspekte der Klassifizierungsmethode und der Sensorproblematik gleichzeitig mitberücksichtigt werden.
Daher wird das Prinzip des Zonenmodells, welches die Raumluft in verschiedene Zonen unterteilt, zur weiteren Entwicklung ausgewählt.
Das neue Modell unterscheidet zwischen drei typischen Sensorpositionen. Es wird für verschiedene Heizungs-und Lüftungssysteme validiert und die Sensibilität bezüglich der wichtigsten Parameter des Modells wird überprüft. Regelungsqualität und Energieverbrauch werden für unterschiedliche Sensorpositionen, für den Fall eines einzelnen Raums mit verschiedenen Heizungs-und Lüftungssystemen, sowie für ein komplettes Gebäude mit einer variablen Volumenstromanlage und anderer Gebäudetechnik (z.B. Jalousien, Beleuchtung, etc.) verglichen. Die Ergebnisse werden außerdem denen von einem sehr vereinfachten Raummodell gegenübergestellt.
Zusammenfassend kann gesagt werden, dass die Differenzen für wechselnde Sensorposition stark vom jeweiligen Heiz- oder Lüftungssystem und aber auch vom Reglertyp abhängig sind. Die Differenz ist zwar oft unbedeutend bezüglich des thermischen Komforts, kann aber signifikant bei Inbezugnahme des Energieverbrauchs werden.
Für die untersuchten Heiz-und Lüftungssysteme werden die Fälle aufgelistet, in denen von einer Verwendung eines vereinfachten Modells abgeraten wird.
T
ABLE OF
C
ONTENTS
TABLE OF CONTENTS ...15
LIST OF SYMBOLS ...1
INTRODUCTION ...5
CHAPTER I - CONTEXT AND OBJECTIVES ...7
1. INTRODUCTION TO HVAC BUILDING CONTROL...8
2. TEST OF HVAC CONTROLLERS...10
2.1 Test of HVAC terminal controllers ... 10
2.2 Test of HVAC building controllers ... 11
2.3 Real test environment for controller tests... 12
2.4 Use of virtual laboratories for the test of controllers... 12
2.4.1 Principle of a virtual laboratory ...12
2.4.2 Criteria of manufacturers for virtual laboratories ...13
2.4.3 Application of a virtual laboratory to controller tests ...14
2.4.4 Rules for the development of a virtual laboratory ...16
3. MAIN OBJECTIVE AND WORK PLAN OF THE PHD THESIS ...17
4. CONCLUSION CHAPTER 1 ...18
CHAPTER II - ANALYSIS OF PHENOMENA IN A HEATED, COOLED OR AIR-CONDITIONED ROOM...19
1. GENERAL AIRFLOW PATTERNS IN ROOMS...20
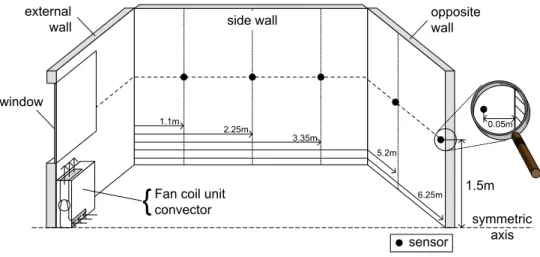
2. DESCRIPTION OF TEST CELL AND MEASUREMENT DEVICES ...23
2.1 The test room... 23
2.2 Emitters and gains in the test room ... 24
2.3 Measurement of surface temperatures... 25
2.4 Tools for the evaluation of convective phenomena in the test room... 25
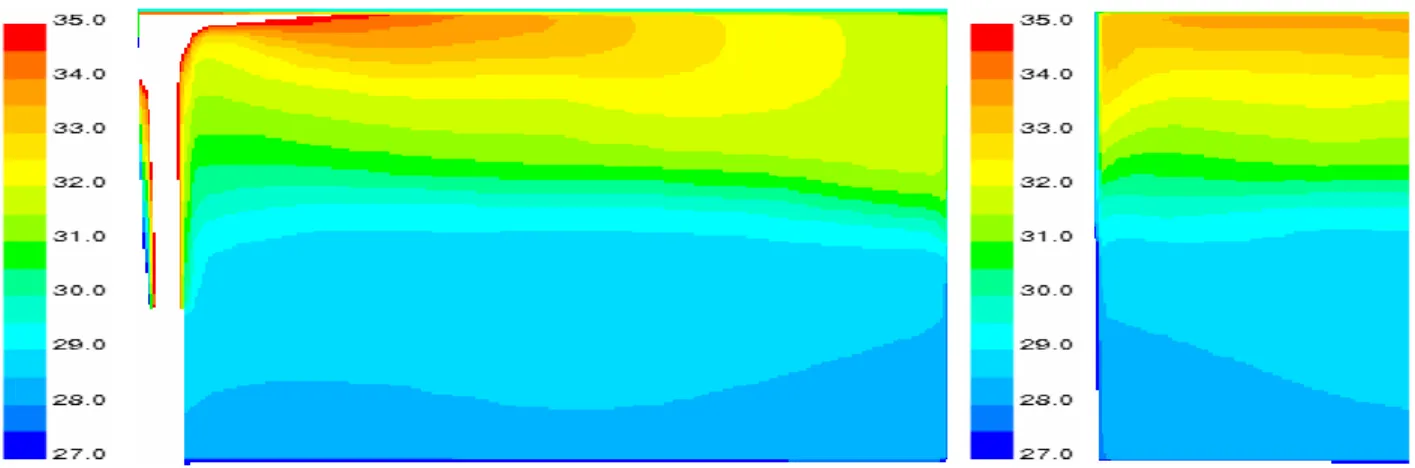
2.4.1 Measurement of air temperatures (quantitative tool) ...25
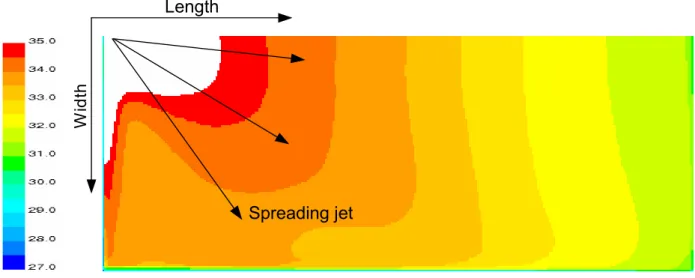
2.4.2 CFD simulation of air temperatures (qualitative tool) ...26
3. ANALYSIS OF ZONE CONDITIONS – STEADY STATE PHENOMENA ...27
3.1 Observed airflow patterns ... 27
3.2 Conditions at the occupants zone ... 29
3.2.1 Horizontal temperature profile...29
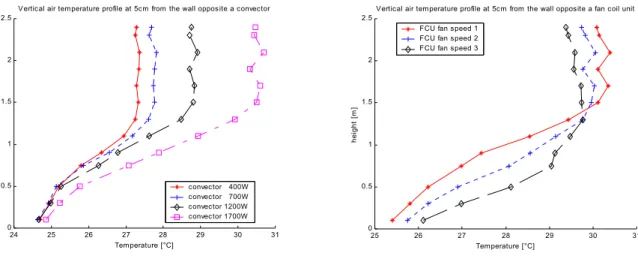
3.2.2 Vertical temperature profile...31
3.3 Conditions at sensor zones ... 33
3.3.1 Positioning of temperature sensors ...33
3.3.2 Room without convective heat sources...35
3.3.3 Air distribution at ceiling – heating systems...36
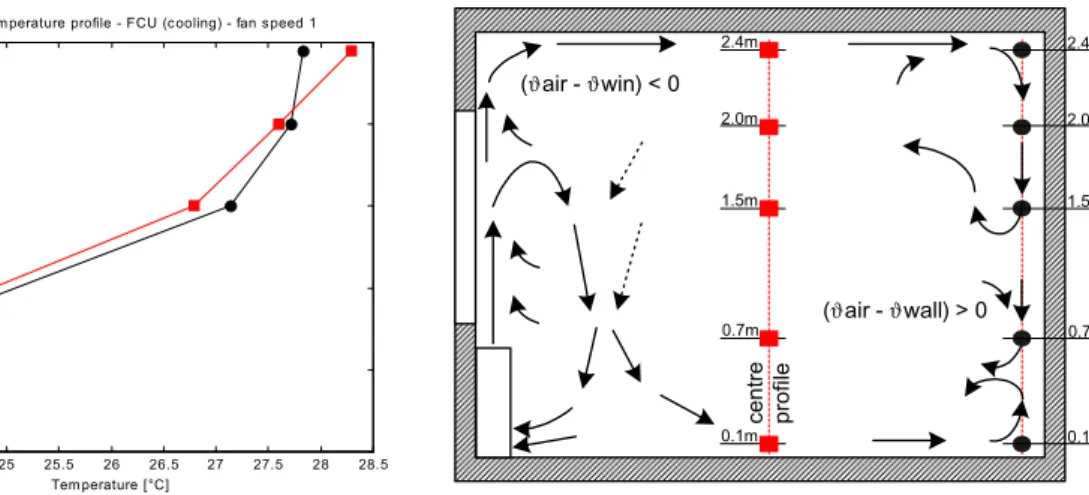
3.3.4 Air distribution at floor – cooling systems...36
3.4 Study of flow around a controller sensor ... 38
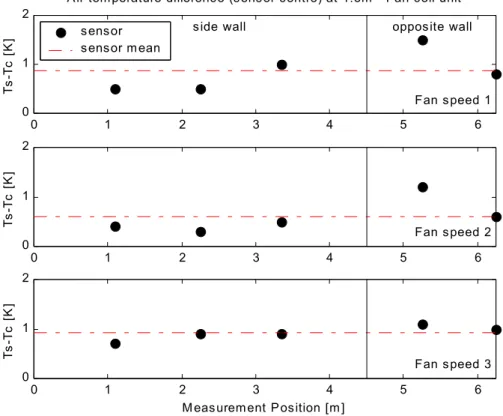
3.4.1 Study on 3-d effects of the flow in sensor zones ...38
3.4.2 Study of the flow in the negatively buoyant wall jet for the example of heating systems ...42
3.5 Conclusion on steady state phenomena... 44
4. ANALYSIS IN TRANSIENT CONDITIONS ...45
4.1 General transient phenomena ... 45
4.2 Measurement of transient phenomena... 45
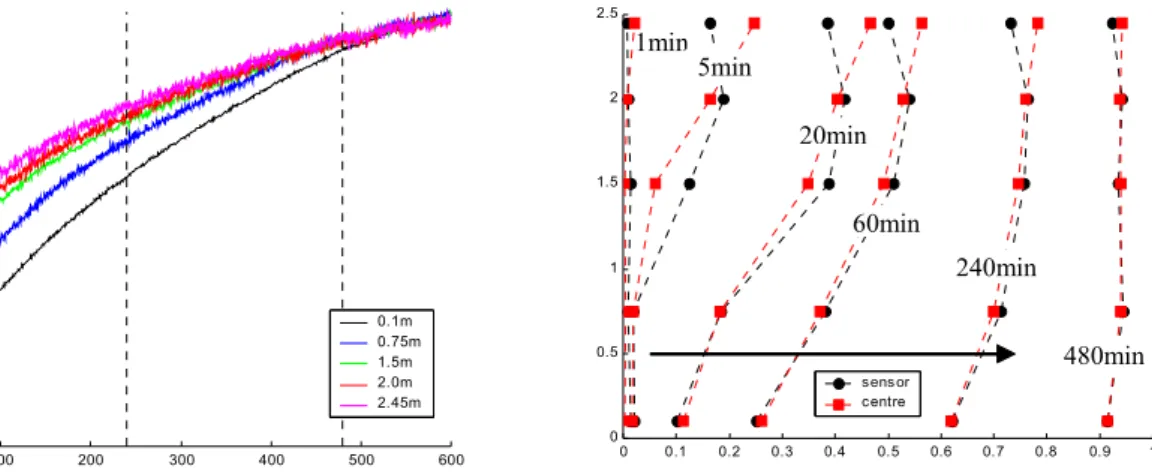
4.2.1 Switching on ...45
CHAPTER III - ANALYSIS OF EXISTING ROOM MODELS AND DEFINITION OF
CRITERIA FOR A NEW MODEL ...51
1. CRITERIA OF A NEW ZONE MODEL ...52
1.1 General criteria for the model... 52
1.1.1 Optimised detail of room model ...52
1.1.2 Use of available and simple model parameters...53
1.1.3 Validity of the model ...53
1.2 Criteria regarding Test of controllers ... 53
1.2.1 Link between actuator/emitter and room ...54
1.2.2 Link between the room and the controller ...54
1.2.2.1 Position of the controller sensor in the room...54
1.2.2.2 Measurement of a controller sensor ...55
1.2.2.3 Conclusion on necessary outputs for sensor measurement...57
1.2.3 Link between the room conditions and performance assessment ...57
1.2.3.1 Position of performance assessment ...57
1.2.3.2 State variable(s) or index for performance assessment ...58
1.2.3.3 Conclusion on performance assessment ...63
2. ANALYSIS OF EXISTING ROOM MODELS ...65
2.1 Models of convection ... 66
2.1.1 Well-mixed models...66
2.1.2 Computational fluid models...66
2.1.3 Zonal models ...67
2.1.4 Simplified models using supplementary identification or correlation ...71
2.2 Models of conduction... 71
2.3 Models of radiation ... 72
2.4 Lumped parameter room models... 72
2.5 Conclusion on room models... 73
2.6 Conclusion on model criteria... 74
3. CONCLUSION CHAPTER III...76
CHAPTER IV - MODEL DEVELOPMENT ...77
1. SYSTEM DEFINITION AND GENERAL EQUATIONS OF THE CONVECTIVE ROOM MODEL ...78
2. DIVISION OF THE ROOM INTO SUB-VOLUMES...79
3. STUDY AND SELECTION OF CORRELATIONS FOR CONVECTIVE PHENOMENA...81
3.1 Airflow in plumes... 81
3.1.1 Radiator plumes ...81
3.1.2 Convector plumes ...82
3.1.3 Free plumes...83
3.1.4 General representation for plumes ...84
3.2 Airflow in jets... 84
3.2.1 Overview and definitions...84
3.2.2 Isothermal jets...86
3.2.2.1 Jet zones and centre-line jet velocity ...86
3.2.2.2 Velocity profile...87
3.2.2.3 Air flow rates ...88
3.2.3 Non isothermal jets ...89
3.2.3.1 Horizontal jets...89
3.2.3.2 Vertical jets...89
3.2.4 General representation for jets ...91
3.3 Airflow at internal wall surfaces ... 92
3.3.1 Natural convection...93
3.3.2 Negatively buoyant flow...94
3.4 Convective heat transfer coefficients at the internal room surfaces ... 96
4. DEVELOPMENT OF THE CONVECTIVE ROOM MODEL ...97
4.1 Division of the sub-volumes in two parts... 98
4.2 Development of the simplified zonal model ... 99
4.2.1 General structure of the model...99
4.2.2 Definition of the particular air flow matrices...99
4.2.2.1 Air flow due to emitter plume or positively buoyant fan coil unit jet ...99
4.2.2.2 Air flow due to negatively buoyant fan coil unit jet ...100
4.2.2.3 Air flow in the ceiling jet...101
4.2.2.4 Air flow due to plumes from internal heat gains...101
4.2.2.5 Air flow due to the boundary layer at the external surfaces ...102
4.2.2.6 Air flow due to a boundary layer of natural convection at the internal walls ...102
4.2.2.7 Air flow due to negatively or positively buoyant air flow at the internal walls ...103
4.2.2.8 Air exchange with external conditions or the HVAC system...104
4.2.3 Construction of the final air flow matrix AFM...104
4.2.4 Estimation of the maximum downward travel of negatively buoyant air flow at the internal walls..104
4.2.5 Calculation of heat transfer in the zonal model ...105
4.3 Development of a Module estimating the temperature in the sensor zones ... 106
4.3.1 Division of the sensor zones into three characteristic zones...106
4.3.2 Function for the temperature in the transition zone of the wall jet ...106
4.3.3 Calculation of the temperature in the sensor zones...107
4.4 Conclusion model development ... 110
5. IMPLEMENTATION OF THE ROOM MODEL IN THE GRAPHICAL SIMULATION ENVIRONMENT...110
5.1 First level: the Room model ... 111
5.2 Model of convection... 113
5.2.1 The zonal model ...113
5.2.1.1 State space representation ...113
5.2.1.2 Sub-volumes with high and low inertia...114
5.2.2 The sensor module...116
5.3 Conclusion model implementation... 118
6. EXPERIMENTAL VALIDATION OF THE ROOM MODEL ...119
6.1 Case 1: Electric convector... 120
6.2 Case 2: Fan coil unit in heating mode ... 124
6.3 Case 3: Fan coil unit in cooling mode ... 128
6.4 Conclusion on validation of the room model ... 132
7. SENSITIVITY ANALYSIS ON IMPORTANT PARAMETERS OF THE ROOM MODEL...132
7.1 Sensitivity of the correlation for penetration of the negatively buoyant air flow at the internal walls133 7.1.1 Error of air flow entrained into the jet or plume ...133
7.1.2 Error of air entrainment into the plume or jet at the ceiling...133
7.1.3 Error due to the estimation of the length of the wall jet...133
7.1.4 Error introduced by the estimation of the initial jet thickness ...133
7.1.5 Error due to a false temperature difference between the air temperature in the wall jet and at the centre 134 7.1.6 Addition of errors ...134
7.2 Sensitivity of the sensor module on an error in the important parameters of the wall jet correlation137 8. CONCLUSION CHAPTER IV...138
CHAPTER V - APPLICATIONS ...139
1. SIMULATION OF A BUILDING ...140
1.1 Building structure ... 140
1.1.1 Building level...140
1.2.3 VAV system...142
1.2.3.1 Diffuser selection ...142
1.2.3.2 The VAV control system...144
1.2.3.3 VAV terminal box...144
1.2.4 Controllers ...145
1.2.5 Controller sensor...145
2. SINGLE ROOM TESTS ...146
2.1 Electric convector... 147
2.1.1 General behaviour of resultant temperature...147
2.1.2 Possible impact on results of controller tests ...148
2.2 Fan coil unit... 150
2.2.1 Heating tests...150
2.2.1.1 General behaviour of resultant temperature...150
2.2.1.2 Possible impact on results of controller tests ...151
2.2.2 Cooling tests ...153
2.2.2.1 General behaviour of resultant temperature...153
2.2.2.2 Possible impact on results of controller tests ...154
2.2.2.3 Emitted power and water flow rate through the coil ...156
2.3 VAV system ... 157
2.3.1 Cooling tests ...157
2.3.1.1 Slot diffuser...157
2.3.1.2 Radial ceiling diffuser...161
2.3.2 Heating tests...164
2.3.2.1 Slot diffuser...164
2.3.2.2 Radial ceiling diffuser...168
3. VAV WHOLE BUILDING PERFORMANCE TESTS...172
3.1 Impact of room model and sensor position on the performance assessment... 172
3.1.1 Summer case...172
3.1.2 Winter case ...174
3.2 Impact of room model and sensor position on building energy consumption... 176
4. IMPACT OF SENSOR POSITION AND ROOM MODEL ON THE TUNING OF CONTROLLERS ...177
5. CONCLUSION CHAPTER V ...179
CONCLUSION ...181
L
IST OF
S
YMBOLS
English letter symbols
m& Flow rate [kg/s]
A Surface [m²]
Ar Archimedes number (Gr/Re²) [-]
b Thickness of plume [m]
C Constant for jets or plumes [-]
cp Thermal heat capacity of air [J/(kg K)]
D, d Thickness, diameter [m]
E0 Air entrainment ratio [-]
f Weighting factor for temperature in sensor zones [-]
Gr Grashof number [-]
h Convective heat transfer coefficient [W/(m² K)]
H Height [m] K, K' Jet constant [-] L Length [m] n Exponent [-] R Resistance, Radius [K/W] Re Reynolds number [-] St Stanton number [-] t Time [s] V Volume [m3] W Width [m] x Length [m]
x0 Distance from the fictitious jet origin [m]
y Length in y direction [m]
z Height [m]
z0 Height of the fictitious plume origin [m]
zmax Penetration of jet [m]
Greek letter symbols
λ Conductivity [W/(mK)] ∆ Difference [-] β Diffusivity [m²/s] Φ Heat flux [W] θ Temperature difference [K] ϑ Temperature [°C]
Θ Weighting factor for temperature in boundary layer [-]
Subscripts
air air
BL boundary layer
cond conductive
conv convective, convector em emitter
ext, e external fresh fresh air supply gain internal heat gain heavy heavy wall structure
i current air sub-volume number j sub-volume adjacent to sub-volume i
jet jet zone
light light wall structure
mr mean radiant
p plume
rad radiative, radiator s resultant surf surface tot total
transition transition zone of the wall jet w wall
win window Matrices and vectors
A Matrix of heat loss of sub-volumes by heat and mass flow (A1 – A4) B Matrix of heat gain of sub-volumes by heat and mass flow (B1 – B3) C Matrix of thermal masses of the sub-volumes
D Matrix defining the outputs of the system E Matrix defining the outputs of the system
U Disturbance vector
X State vector
Y Output vector
Abbreviations
AFM Air Flow Matrix
AHU Air Handling Unit
ASHRAE American Society of Heating Refrigerating and Air-conditioning Engineers BEMS Building Energy Management System
BL Boundary layer
CSTB Centre Scientifique et Technique du Bâtiment CV Convector
EREDIS Enceinte de REcherche sur la Diffusion de l'air et les Interactions Système-Enveloppe FCU Fan coil unit
GRES Comfort index (G=uniformity of ambience, R=radiative asymmetry, E=temperature difference between feet and head, S=floor temperature)
HVAC Heating, Ventilating and Air Conditioning MAXE Maximum root square error
PMV Predicted Mean Vote
PPD Predicted Percentage of Dissatisfied RMSE Root mean square error
SIMBAD Simulator for Building and devices SV Sub-volume
UCRES Comfort index (U=uniformity of ambience, C=air drafts, R=radiative asymmetry, E=temperature difference between feet and head, S=floor temperature)
VAV Variable air volume system
I
NTRODUCTION
The expectation of occupants on indoor comfort is nowadays very high. This results in increasing constraints at the HVAC system in buildings and more and more sophisticated control systems. The latter have to provide the required comfort and to minimise the energy consumption of the HVAC systems.
Various studies have been carried out in order to reduce energy consumption and to improve comfort in buildings.
On the one hand dynamic simulation tools, with hourly time step, are used in studies on energy consumption for simulations on a yearly basis. They assume the conditions in a room as perfectly mixed.
Computational Fluid Dynamics (CFD) models, on the other hand, are used for comfort studies and the prediction of airflow in rooms as they provide detailed conditions in the room. Since CFD calculations are very time consuming, they are mostly used for static problems.
With the control of these systems getting more and more complex and integrating different building services, tools have to be developed in order to provide a new testing environment for the complex controllers.
The SIMBAD building simulator is an example of such a tool and is one step towards such a testing environment. It enables the connection between real control systems such as building energy management systems or room controllers to a virtual building with its HVAC system and different building services (e.g. sun-blinds, lighting, etc.). This "emulation", carried out on a weekly basis, provides then information about the performance of the control system.
The accuracy of the modelling of HVAC systems and building services in existing testing environments has already reached a high level. On the other hand, the modelling of conditions in the rooms of the building is still simplified to some extent. While conduction and radiation modelling is sufficiently detailed, convection modelling is usually poor and often assumes that the air in the room is perfectly mixed. Two main problems arise:
- Where is a controller's sensor placed and what does it measure? - Where and how is controller performance assessed?
This thesis deals with the two aspects and presents the development of a room model that is adapted to controller tests and to study the influence of sensor position in building thermal control.
The model will be implemented in a toolbox of dynamic models of HVAC components. This toolbox aims at providing models of components that are "easy to use" and suitable for the design and test of control systems. It is designed in a commercial graphical environment to benefit from its technical computing environment and its readily available user-friendly interface.
In a first chapter, the interest of controller tests by simulation or by emulation is shown. The main objectives for the development of the room model are presented.
In the second chapter of the thesis, the important phenomena, to be represented in the model, are analysed experimentally and by detailed simulation. A large number of controller tests in real test rooms at CSTB and within a European Research project have been analysed in order to obtain criteria for different room geometries and HVAC systems. A list of convective phenomena is gathered for the development of criteria for the new room model.
In a third chapter, criteria for the room model, regarding both sensor measurement and performance assessment, are developed. Taking into account these both main groups of criteria, an appropriated model type for controller tests is chosen for further development.
The fourth chapter deals with the development of the room model. The necessary elements for the model are selected and integrated into the model. The model is validated for a room equipped with different HVAC systems and sensitivity analysis is carried out for the main parameters of the new model.
The last chapter consists of an application of the new model to a single room with different HVAC systems and a whole building, equipped with a VAV system and other building services (e.g. sun-blinds, lighting etc.). Controller performance and energy consumption is analysed for different sensor positions. The results are compared to those obtained using a well-mixed model.
C
HAPTER
I
C
ONTEXT AND OBJECTIVES
Controllers of HVAC systems in buildings on the room level (terminal controllers) as well as on the building level (Building Energy Management Systems - BEMS) get more and more sophisticated.
The development and test of these complex control systems raises new questions such as:
- Where can these complex controllers be tested?
- How can the performance of these controllers be evaluated?
Using virtual laboratories (VL) offers a flexible tool for the development and test of controllers. Various advantages of such a test environment will be explained in a first part of this chapter.
In different places toolboxes of models of building and Heating, Ventilation and Air Conditioning (HVAC) systems are in development in order to provide a tool for the test of controllers of these systems. The models have to be user-friendly, simple and valid. A second part of this chapter lists the rules for the development of the models included in these toolboxes.
The main question for controller manufacturers, probably the main group of potential users, is the validity of these VL. The main element of any test of thermal building controllers is the room model. While other models have been improved and adapted to control studies, the room model is still very simplified due to the complexity of the phenomena nevertheless it has an important effect on all other parts of the system. A room model, suitable for controller tests, is developed in this thesis.
The main objectives of the thesis are discussed in a third part of this chapter. Starting with an analysis of convective room phenomena, the needs for a new model are studied regarding its use for controller tests.
1. INTRODUCTION TO HVAC BUILDING CONTROL
In modern buildings, HVAC systems as well as lighting/shading systems control the internal conditions such as temperature, humidity, pollutants or illuminance. The systems have to guarantee comfortable and healthy conditions for the occupants in the rooms and, at the same time, reduce energy consumption without creating uncomfortable conditions for the occupants. The control of the systems is generally represented by a control loop similar to that shown in Figure I - 1. DISTURBANCE PROCESS ACTUATOR(S) ALGORITHM SENSOR Measured variable(s) Controlled variable(s) Command(s) SETPOINT CONTROLLER Position(s)
Figure I - 1: General principle of a control loop
The control loop includes a controller, an actuator, the process to be controlled, disturbances of the process and a sensor measuring the controlled variable(s).
The variables measured by the sensor are compared with a set point value. An algorithm outputs a command signal that is transferred via the actuator to the process, disturbed by conditions outside the process. In addition to open loop commands, different closed-loop algorithms can be used ([ASHRAE97], [Knabe92]):
- On/Off controllers
- P controllers (proportional)
- PI controllers (proportional-integral)
- PID controllers (proportional-integral-differential) - Fuzzy controllers
In the case of HVAC systems, the process can be observed on different levels of the HVAC system (cf. Figure I - 2):
- Control on the room level (e.g. control of the terminal unit of a Variable Air Volume (VAV) system)
The conditions (e.g. temperature) in the rooms or groups of rooms (building zones) are controlled. The process can either be thermal, flow or lighting phenomena in the rooms. The sensor is placed somewhere in the room and measures conditions as for example temperature or humidity. The actuator is for example a valve, interacting on the hot water flow rate through a radiator.
- Control central unit (e.g. control of the central Air-Handling-Unit of a VAV system)
The central part of a HVAC system, for example a VAV system, provides the air needed for the conditioning of the zones, distributed to the terminal units of the building zones. Different controllers act on fans, valves, pumps or dampers, installed in the AHU.
- Supervisory control (supervision of the two previous groups)
Depending on superior criteria (e.g. total building energy consumption or time dependent tariffs), this controller has the possibility of interaction on control signals from the two first levels. Supervi sory cont rol Zone cont rol Cent ral uni t cont rol
Control System 1 Control System 2 Control System 3
Lighting/shading control zone 1 Lighting/shading control zone 3 Lighting/shading control zone 4 Lighting/shading control zone 2 Heating control production/distribution Heating control zone 4 Heating control zone 3 Heating control zone 2 Heating control zone 1 Ventilation control production/distribution Ventilation control
Zone 3 Ventilation controlZone 4
Ventilation control Zone 1 Ventilation control Zone 2 Supervisor Lighting/Shading Supervisor Heating Supervisor Ventilation Systems to control Control level
Figure I - 2: Example for different levels of building control
The trend in the development of HVAC controllers changes from optimisation of individual control to the aspects of total building control (e.g. Building Energy Management Systems BEMS).
control is developed. Supplementary control interactions are so added between the different systems.
The time range from a new idea to an available product on the market is decreasing more and more, while the complexity of the products increases. This increasing complexity is mostly due to the development and integration of controllers on all levels of building control or even the interaction of control of several building systems.
At the same time, more attention is paid on the comfort in the rooms. The controller(s) has (have) to guarantee comfort conditions in the occupant zone.
For this purpose, testing methods for the controllers have to be developed permitting to test controllers from the early development stage to the final product. The different control systems as well as different levels of the control systems have to be tested separately or combined in order to get detailed information about the performance of the control.
2. TEST OF HVAC CONTROLLERS
Most components of HVAC systems are classified in their performance using standard tests (e.g. EN 215-1 for thermostatic valves). No comparable standards exist to date in order to test and classify control systems, neither for terminal controllers nor for building controllers.
In the following two sections the main questions for testing controllers are raised, on the one hand for terminal controllers and on the other hand for building controllers.
2.1 TEST OF HVAC TERMINAL CONTROLLERS
Room controllers exist for all current HVAC systems as e.g. radiators, convectors or fan coil units. They are characterised by different control algorithms and they use different sensors and sensor positions for the measurement of the variable to control.
The whole system can be divided into the following parts of the control loop (Figure I - 3): - Room
- Sensor - Controller
- Actuator (and eventually a valve or a switch) - HVAC component
A test of such a system raises a large number of questions, partially represented in Figure I - 3, a revised scheme of the control loop:
- what variables should be tested (temperature, humidity, draft, etc.)
- is the controller considered as an independent component or as a combined system including the sensor, the actuator and the valve?
- where and how has the control loop to be divided, if only a part of the control loop is tested? - what HVAC system (manufacturer and size) is used?
- in what room are the controllers tested (size and type)? - where is the controller's sensor placed?
- how can performance be assessed? - what test procedure is used ?
- how are the results used for classification of controllers?
DISTURBANCE PROCESS ACTUATOR(S) ALGORITHM SENSOR Measured variable(s) Command(s) SETPOINT CONTROLLER Position(s) Additional information
Reference variable(s) Performance
assessment
Offset = f (sensor position)
Figure I - 3: Revised scheme of a control loop
2.2 TEST OF HVAC BUILDING CONTROLLERS
While the test of HVAC terminal controllers already raises a certain number of questions, it is even more problematic when HVAC building controllers shall be tested. These complex control systems include a large number of control variables so that their test raises a number of supplementary questions, additional to those of the single room tests.
The aim of particular BEMS systems can be different, from maintaining comfort conditions to minimising energy consumption or taking into account periods of low tariffs. It is thus difficult to define a standard procedure for the performance assessment of this kind of control.
A test of these controllers starting from the criteria of the manufacturer makes more sense. The manufacturer can define his specific test procedure and criteria of evaluation for the improvement of the product.
2.3 REAL TEST ENVIRONMENT FOR CONTROLLER TESTS
The applicability depends on the controller level (cf. Figure I - 2) to be tested. While a test of controllers on the room level is possible in test cells, the test of central or supervisory controllers is very difficult if not even impossible. The more complex the controlled system, the more difficult the test of used control devices is.
In general, a real test provides the following advantages: - Test of controllers in a real environment,
- Test of the whole control loop (sensor, controller, and actuator). The disadvantages on the other side are:
- Boundary conditions (surface temperatures, water/air inlet, solar radiation, internal gains,…) are difficult to manage since controller tests create dynamic zone conditions. Repeatability is not guaranteed from one test to another.
- Building parameters (e.g. heavy/light construction) can only be changed with considerable effort and time (new construction would be necessary).
- Disturbances (e.g. occupancy and weather) are difficult or impossible to manage. - Testing time is very large.
- The test of buildings with several rooms cannot be carried out with a total managing of load profiles (real but unpredictable profiles - no predefined tests possible).
- Enormous measurement effort is necessary for sufficient test monitoring. - Extremely high testing costs.
Real tests bring visibly many disadvantages. While the use of a real test environment would be possible, with some difficulties, for terminal controllers, it would be very difficult to realise for tests of BEMS controllers.
2.4 USE OF VIRTUAL LABORATORIES FOR THE TEST OF CONTROLLERS
A promising alternative for a real test environment is a virtual laboratory able to test real or simulated controllers in a virtual test environment. Its advantages and inconveniences are studied in the following sections.
2.4.1 PRINCIPLE OF A VIRTUAL LABORATORY
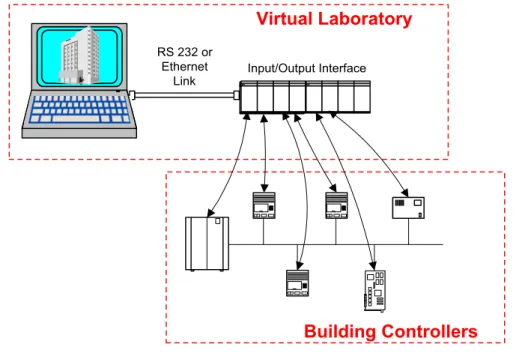
Virtual laboratories use simulation models in order to replace a “real” part of a system by a simulated test environment. Virtual or real controllers can be tested using a virtual laboratory by simulation (whole system is virtual) and by emulation (part of the system is real) respectively. Figure I - 4 shows the principle of the test of real controllers using emulation technique and the two main parts of the virtual laboratory:
- Virtual representation of a part of the system
The particularity of the virtual laboratory is the use of the “input/output interface”. On the one hand the conditions to be controlled (e.g. room temperatures) are transferred from the simulated building e.g. in form of voltages to the controllers (in order to replace the sensor signal). On the other hand the controller commands are transferred to the actuators (real or virtual) and the impact on the building is taken into consideration in the simulation.
Input/Output Interface RS 232 or Ethernet Link Virtual Laboratory Building Controllers
Figure I - 4: Principle of a virtual laboratory used for the test of real building controllers
The run time of the simulation model of the virtual laboratory has to be slowed down in order to permit a test in real time.
In the case of the test of simulated controllers, the input/output interface disappears and the building is directly connected to the controllers.
Controller tests using a virtual laboratory provide an enormous flexibility for the user. Various applications are possible by simulation and by emulation:
- Development of new control strategies or algorithms for different buildings in the virtual laboratory (simulation),
- Optimisation of controller parameters for a given simulated building (simulation or emulation),
- Test of controller prototypes for different simulated buildings (emulation),
- Test of any existing (real) controller for different simulated buildings (emulation), - Comparison of different controllers for an existing system (simulation or emulation).
2.4.2 CRITERIA OF MANUFACTURERS FOR VIRTUAL LABORATORIES
In the meantime, computer technology changed dramatically. Commercially available hardware and software of today facilitate the development, implementation and usability of virtual laboratories.
Various simulation models or virtual laboratories exist to date ([Dexter94], [Mathews99], [Haves98], [Hong97], [Husaunndee00], [Kast98], [Osman96], [Vaezi97a], [Visier00], [Wang99]). Their main problem is the restricted usability due to complex models and model parameters that are difficult to obtain. [Hus98] carried out an inquiry with 27 companies on the HVAC field in order to characterise the interest of manufacturers for the use of VL and the criteria important for these VL.
According to the study, 45% of the companies use simulation tools. 17% of the non-users would be interested in simulation, if there was a tool that is suitable to their purposes.
61.5% of the users of simulation tools apply simulation to develop their products without taking into account the interconnection of their product with the system to which they are connected. The rest take into account phenomena of system interaction. This group of users is mainly composed of companies working on the control field where the study of the interactions of their product with the system is of major importance.
Among the users, simulation is actually used for two main purposes: the design (92%) and the test (54%) of products, the principal parts in the development of a product.
The major criteria for used simulation tools are given as: - Validity of the simulation models
- Easy parametering - Easy comprehension - Modularity
- Possibility of modification
- Possible interconnection with other models
- Hybrid simulation (mixing of discrete and continuous models [Stateflow00])
The study showed also the demand of the non-users of simulation tools for the use on PC’s.
2.4.3 APPLICATION OF A VIRTUAL LABORATORY TO CONTROLLER TESTS
Compared with a real test environment, the virtual laboratory offers several advantages, reducing enormously many of the problems of controller tests. The advantages are:
- Cheap installation and test,
- Perfect control of all boundary and test conditions by the user,
- Flexible parametering of the test-building concerning structure, size, use, loads, system equipment, …
- Minimisation of test time (simulation),
- no sensor calibration necessary,
- Perfect test monitoring since all test data are available, - Easy test automation,
- Possibility of sensitivity analysis for system or controller parameters,
- Possible choice of different representative systems or buildings (e.g. heavy/light structure) and easy adaptation to actual building technology.
On the other hand, the virtual laboratory presents risks that are to be considered: - Test of controller under unrealistic conditions,
- Error introduced by breaking up of the real control loop (input/output interface),
- Insufficient level of modelling of system components in the control loop (emitter, building model, sensor etc.),
- Risk of false interpretation due to extremely large number of available data. The last point is in common with controller tests in a real test environment.
To date, virtual laboratories are used in several research projects. Each of them underlines the advantages and large domain of application of the VL:
- SIMTRAIN [Arditi98]: Simulation models are used for training and education on the control field. The training tool can be used from users with various level of knowledge.
- SIMTEST [Lahrech01], A virtual laboratory is used in order to test individual room controllers. The VL consists of a building with only one zone.
- SIMBAD, QUALISIM ([Vaezi91], [Vaezi97b], [Vaezi00], [Riederer01c]), Building Energy Management Systems BEMS and several controllers are tested on a six-zone building.
The listed projects illustrate the large domain of application of a virtual laboratory. On the other hand, if a virtual laboratory is developed for such a large domain of application, the used simulation models have to be suitable to the concerned case.
In the SIMTEST project [http://ddd.cstb.fr/simtest], a test bench for room controllers has been developed. During the project several difficulties appeared due to the test rooms used for validation and due to the use of simplified simulation models, assuming the room air perfectly mixed ([Riederer00]). More suitable but also more complex models can partially solve the observed problems. The testing principle has also been proposed for a new standard for testing HVAC terminal controllers ([CEN-TC247]).
In the SIMBAD project on the other hand, the use of more complex models could introduce difficulties to handle the results due to the high number of available data.
Both concerns have thus to be solved simultaneously. The models used have to be able to provide enough data for tests on the room level. For the tests on the building level, solutions have to be provided defining the use of the more detailed information.
2.4.4 RULES FOR THE DEVELOPMENT OF A VIRTUAL LABORATORY
The SIMBAD building and HVAC toolbox [SIMBAD01], developed in the graphical simulation environment Simulink [Simulink98], is already used for virtual laboratories. In [Husaunndee97], [Husaunndee99a] and [Husaunndee99b] rules are developed for such a model toolbox. The rules have to be followed in order to keep the perfect modularity of the models.
All models are developed for the study of controllers. The models have thus to represent the dynamic phenomena with the necessary level of detail for this application.
The model library should be able to provide the user the assessment of: - Performance of controllers
- Conditions in the occupant zones - Air quality in the building zones
- Energy consumption of building zones and the whole building
The modularity of the models is based on a definition of interconnections between the models. The interconnections are similar to real interconnections as for example pipes or ducts. The assembly of models corresponds thus to the real system installation. The following vectors have been defined:
- Vector of air (temperature, absolute humidity, pressure, flow rate) - Vector of water (temperature, flow rate)
- Heat transfer - Electricity - Weather data
- Busses containing information or controller commands
All inputs and outputs of the models of the library can be connected using these “standardised” vectors.
Main attention is paid on the parametering of the models. For many available models it is very difficult to obtain all necessary parameters. An approach using two types of models can solve this problem. If detailed information is available, detailed models can be used. As the data provided by the manufacturer catalogues contains only a restricted amount of information, simplified models are used in these cases.
An approach of typical and specific parameters is used. This concept permits the use of pre-defined files that contain all specific parameters. A new user can so obtain valid results without a detailed knowledge of the specific system parameters; however specialists can change them, if necessary.
The models themselves are, if possible, structured following the given rules. The experienced user can so understand the modelled phenomena. Static and dynamic parts of the models are separated, if possible.
In general, the use of pre-processors (e.g. [TRNSYS96]) for the determination of model parameters should be avoided. This makes the model easier to use and the parameters can be changed without difficult transfer of files or information between model environment and pre-processor.
3. MAIN OBJECTIVE AND WORK PLAN OF THE PHD THESIS
The thesis is focussed on the development of a room model as a first step towards a representative controller test. It represents the principal part of any test of thermal building control, on the room level and also on the building level.
Existing room models used for controller tests suppose the air in the zone completely homogeneous in temperature and humidity ([Kast98] [Rouvel97], [Vaezi97b]). This reduces some of the problems raised in § 2. On the other hand, the coupling of the HVAC system or internal heat gains in the room and the room itself can produce inhomogeneous zone conditions. This has an effect on the result of the test of controllers and is neglected in the case of these simple models.
In [Riederer00], two room models have been tested for their use in control applications. These models were a well-mixed model and a second model with only two air sub volumes. The applicability of these models to controller tests has been shown. However, three main problems appeared while using them:
- the difference between centre and sensor temperature - the validity of the models when varying emitter loads - the sensor characterisation
The key points for all these problems are the conditions and phenomena in a room. In Chapter II, as a first step, the room conditions for different HVAC systems are analysed using a real test room and a "virtual" test room, a detailed Computational Fluid Dynamics (CFD) model. A large
amount of experimental results leads to a list of phenomena that have to be considered for the
development of a room model suitable for controller tests and able to simulate rooms with flexible geometry, type, and equipped with different HVAC systems.
In Chapter III, using the results from Chapter II, the key points of controller test are studied. Existing model types are compared in order to find a model type that is adapted to further development for the use in controller tests where the controller performance is assessed and the
sensor is placed at realistic positions.
In Chapter IV, the new room model is developed and integrated in the graphical modelling environment. Validation and sensitivity analysis is carried out.
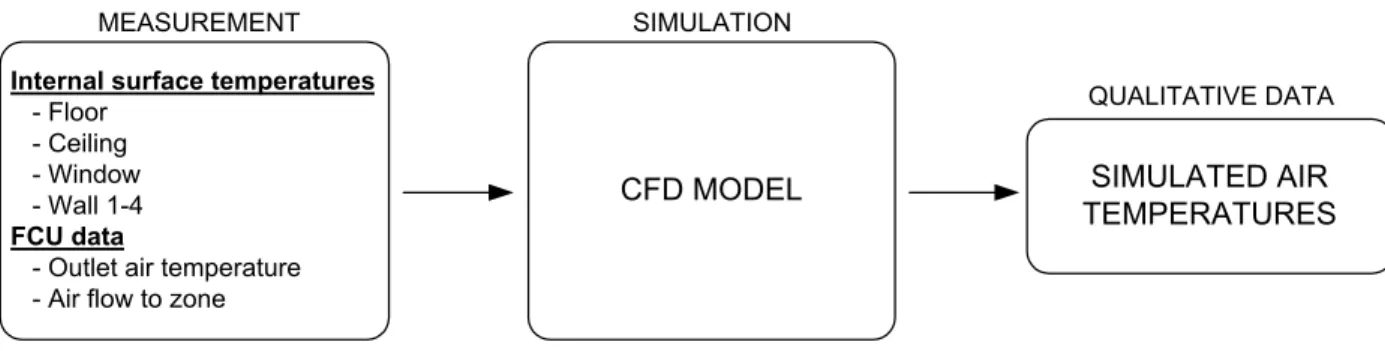
The development of the room model can be represented by Figure I - 5.
Finally, in Chapter V, the developed model is used in order to analyse the improvement of the room model compared to classic models in cases of controller tests.
For different HVAC systems, the influence of the sensor position is analysed.
The room model as an important part of a complete building is studied in a third part of Chapter V. For a Variable Air Volume (VAV) system, the impact of the sensor position and model
type is studied regarding performance assessment of the controller as well as energy consumption.
FOR WHAT (Applications) Controller tests - standardised - individual ROOM
MODEL BUILDINGMODEL
OBJECTIVE SIMULATION TOOL -Coupling CONSTRAINTS (Implementation) Models structure (graphical simulation environment) Programming rules Analysis phenomena Needs AVAILABLE TOOLS CFD Experiment 2 - T e st ro o m s Analysis Room models Emitter models 1 Bi b lio gr ap hy Comfort models
Figure I - 5: Main objectives of the study
4. CONCLUSION CHAPTER 1
An introduction to HVAC control and controller tests has been given. The main question appearing in controller tests have been raised.
The high potential of the use of virtual laboratories for controller tests, compared to tests in a real environment, has been shown. Except some acceptable inconveniences, the VL offers a great number of advantages that make their use very interesting for research laboratories as well as for manufacturers.
The VL permits both the development of new control strategies on the room and on the building level, and the test of controllers (real or simulated). It can also be used for a standardised performance assessment proposed in standardisation committees, e.g. [CENTC247].
The SIMBAD building and HVAC toolbox is an example of a first step towards a virtual laboratory. The structure of all implemented models is adapted to this existing toolbox in order to provide adequate modularity. Rules for structuring the models of the toolbox in the graphical environment and method of parametering of the models are main steps to make models easy to use. The VL becomes thus interesting for various kinds of users.
As a main part of a VL in the test of terminal controllers and of BEMS systems, a new room model is developed in this thesis. [Riederer00] listed problems of existing room models when used for controller tests. Representing the link between the virtual world (system) and the real world (tested controller), it has to be developed in a suitable level of detail considering the needs of a controller test in a virtual laboratory. The needs of the potential users, manufacturers and research laboratories, have to be taken into account as well.
C
HAPTER
II
A
NALYSIS OF PHENOMENA IN A HEATED
,
COOLED OR AIR
-CONDITIONED ROOM
As shown in Chapter I, controller tests with assessment of controller performance raise two main questions:
- where is a controller's sensor placed and what temperature(s) does it
measure?
- at which reference position and how is performance assessed?
In “well-mixed” models both temperatures are identical. The temperature controlled by the zone temperature controller is the same as the temperature used for the performance assessment.
In reality, both temperatures are often different. The difference between both is due to convective phenomena and to the asymmetry of radiation in the room. Controller tests using a simplified model may not be accurate enough. The asymmetry of radiation can generally be well represented by the use of suitable models for the wall structure (conductive and radiative models). Several models have been tested and studied in previous research ([Brau80], [Roux84]).
On the other hand, convective phenomena have been researched for the issue of comfort in buildings, but never for their importance for controller tests.
In this Chapter, convective phenomena in rooms are studied. Besides their influence on the temperature of the wall structure, they are responsible for any temperature non-homogeneity in a room. The results are used as a basis for the development of a list of criteria (Chapter III) to be considered for the development of models for control studies.
The analysis, carried out mainly in the EREDIS tests cell at CSTB, helps to generalise convective phenomena in a room in order to obtain a simple model, able to represent the most current cases of HVAC systems.
The study is carried out for steady state as well as for transient conditions using measurement and simulation (CFD).
1. GENERAL AIRFLOW PATTERNS IN ROOMS
There are two important positions in a room for the assessment of controller performance: the occupant position and the position near the internal walls, where a controller's sensor is usually placed. The air temperature at both positions depends strongly on the airflow pattern in the zone. The airflow in a zone can be divided into two main groups:
) Airflow due to convective sources or air inlets (airflow generators) ) Airflow at walls (indirect generators)
The first group, convective phenomena from heat sources or air inlets, has been subject of several studies. [Horwarth80], [Inard88], [Bouia93], [Blay93], [Allard90] and [Barles94] studied convective phenomena of radiators and convectors, with and without fresh air supply in the room. [Ngendeku88] and [Maalej94] proposed correlations for stratification in rooms with convective heat sources. [Kherrouf95] and [Peng96] studied a room equipped with a fan coil unit in cooling and heating mode. Several studies are available about isothermal and non-isothermal jets in rooms ([Abr63], [Raj76], [Schw61], [Grim93], [Chen80], [Alb74], [Goldman86], [Kapoor88], [Riberon83] and [Buchmann95]). [Simoneau89] studied the interaction between natural and forced convection (air jet) in rooms.
For the air flow at walls, the problem is different: depending on the temperature difference at the walls and on the general airflow in the room, the airflow can change in direction and flow rate. It is helpful to divide the flow near walls into the following groups:
) Natural convection boundary layer (no convective heat sources in the room)
) Negatively or positively buoyant air flow due to air flow "generators" in the room (convective heat sources or non-isothermal ventilation in the room)
The first type of airflow is observed in the case of high temperature differences at the walls combined with the absence of convective heat sources in the room. The boundary layer of natural convection is, in this case, not disturbed by other airflow in the room. [Allard87] studied this phenomenon for the case of a cooled or heated wall.
In the case of convective heat sources in the room, the airflow due to these sources can have a more or less important influence on the airflow at the internal walls of the room.
In the following, typical airflow patterns in rooms are listed as well as the possible phenomena at the internal walls. The given airflow patterns are partly taken from real tests carried out in a European project ([Lahrech01] and [Hediger01]) and from other authors ([Peng96], [Inard88], [Inard90], [Allard87], [Laret80], [Barles94]). Starting with these sources it is tried to generalise the problem for different kind of emitters.
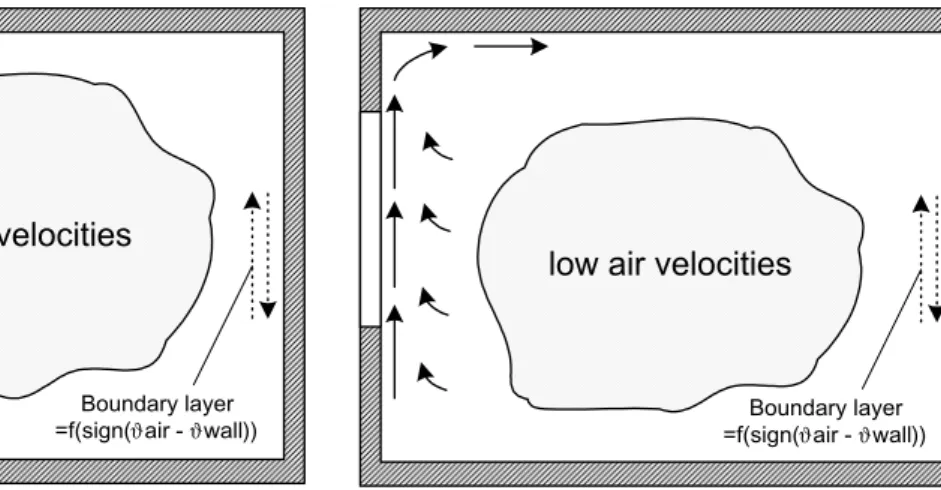
The typical airflow pattern for a room without convective heat sources is shown for the winter case (Figure II - 1) and for the summer case (Figure II - 2):
Figure II - 1:General airflow pattern: no air emitter, winter case
Figure II - 2: General airflow pattern: no air emitter, summer case