O
pen
A
rchive
T
OULOUSE
A
rchive
O
uverte (
OATAO
)
OATAO is an open access repository that collects the work of Toulouse researchers and
makes it freely available over the web where possible.
This is an author-deposited version published in :
http://oatao.univ-toulouse.fr/
Eprints ID : 13907
To link to this article : DOI :10.1016/j.ijpsycho.2015.04.019
URL :
http://dx.doi.org/10.1016/j.ijpsycho.2015.04.019
To cite this version :
Peysakhovich, Vsevolod and Causse, Mickaël
and Dehais, Frédéric and Scannella, Sébastien (2015)
Frequency
analysis of a task-evoked pupillary response :
Luminance-independent measure of mental effort.
International Journal of Psychophysiology. ISSN 0167-8760
Any correspondance concerning this service should be sent to the repository
administrator:
[email protected]
UNCORRECTED PR
OOF
Frequency analysis of a task-evoked pupillary response:
Luminance-independent measure of mental effort
Vsevolod Peysakhovich
⁎
, Mickaël Causse, Sébastien Scannella, Frédéric Dehais
DCAS, ISAE, Université de Toulouse, 10 Avenue E. Belin, 31055 Toulouse, Cedex 4, France
a b s t r a c t
a r t i c l e i n f o
Article history:
Received 10 November 2014 Received in revised form 27 March 2015 Accepted 27 April 2015
Available online xxxx
Keywords:
Task-evoked pupillary response Pupil diameter
Spectral analysis Pupillary power spectrum Load on memory LF/HF ratio
Pupil diameter is a widely-studied cognitive load measure, which, despite its convenience for non-intrusive operator state monitoring in complex environments, is still not available for in situ measurements because of numerous methodological limitations. The most important of these limitations is the influence of pupillary light reflex. Hence, there is the need of providing a pupil-based cognitive load measure that is independent of light conditions. In this paper, we present a promising technique of pupillary signal analysis resulting in luminance-independent measure of mental effort that could be used in real-time without a priori on luminous conditions. Twenty-two participants performed a short-term memory task under different screen luminance conditions. Our results showed that the amplitude of pupillary dilation due to load on memory was luminance-dependent with higher amplitude corresponding to lower-luminance condition. Furthermore, our experimentation showed that load on memory and luminance factors express themselves differently according to frequency. Therefore, as our statistical analysis revealed, the ratio between low (0–1.6 Hz) and high frequency (1.6–4 Hz) bands (LF/HF ratio) of power spectral densities of pupillary signal is sensitive to the cognitive load but not to luminance. Our results are promising for the measurement of load on memory in ecological settings.
36 1. Introduction
The pupil diameter has an important place in psychophysiology. Receiving input from parasympathetic and sympathetic nervous systems, the aperture in the iris provides interesting information about autonomic nervous system activity. The parasympathetic excita-tion and/or sympathetic inhibiexcita-tion result in pupil constricexcita-tion, while sympathetic excitation and/or parasympathetic inhibition result in pu-pillary dilation (Beatty and Lucero-Wagoner, 2000). Thus, the pupil be-havior is hypothesized to reflect the balance of relative sympathetic and parasympathetic activations. Different correlations between pupil activ-ity and attentional effort or cognitive processing have been established from the early 60s (Hess and Polt, 1960, 1964; Kahneman and Beatty, 1966) to nowadays (Ariel and Castel, 2014; Kang et al., 2014; Naber and Nakayama, 2013; Causse et al., 2010). As noted byKahneman (1973)in his work on attention and effort, a good measure of mental ac-tivity must satisfy three criteria: it should be sensitive to between-task and within-task variations as well as between-subject differences. The measure of pupil diameter seems to satisfy all three of these criteria (Kahneman, 1973; Andreassi, 2000; Beatty and Lucero-Wagoner, 2000). Nevertheless, the pupil is sensitive to many other factors besides mental effort.Tryon (1975)listed 23 factors that influence pupil size
among which luminosity variation is the most commonly cited. Thus, in spite of successful application of pupillometry under controlled labo-ratory settings, this psychophysiological proxy is still not available to infer cognitive states in realistic environments (e.g.flight deck, air traffic control radar room).
Comparing results of studies from different laboratories,Beatty in his review (1982)concluded that, Task-Evoked Pupillary Response (TEPR) amplitude was a consistent index of cognitive activity despite various illumination conditions across studies. However, the interaction between luminance and the extent of pupillary cognitive dilation has remained unclear.Bradshaw (1969)conducted a simple reaction task under two different light conditions and found no difference in dilation peaks. More recently, Pomplun et al. (2003) andXu et al. (2011) mea-sured pupillary changes during a visual task experiment and an arith-metic task. No interaction between cognitive load and luminance conditions was found in these studies.
More than that, whereas it has been known that the pupil reacts in response to luminance changes in the environment (Loewenfeld and Lowenstein, 1993), it should be also noted that even when investigators control light conditions (ambient, computer screen etc.) and maintain them constant, the pupil muscles also respond to luminance of the fixa-tion point neighborhood (Pereverzeva et al., 2012). For example, while observing an image of a white cupfilled with black coffee, a fixation of our gaze on the black beverage will cause the iris aperture to dilate in comparison to afixation on the cup.Palinko and Kun (2012)described an example of an experiment taking this pupillary light response into
⁎ Corresponding author at: ISAE, DCAS, 10 Avenue E. Belin, 31055 Toulouse, Cedex 4, France.
UNCORRECTED PR
OOF
account. Three targets of different shades of gray were displayed on a static image. The participants performed a vigilance task while focusing on one of three presented targets. The cognitive component reflecting the level of vigilance was identified by subtracting the pupillary reaction due to the change of focus between two targets of different luminance. The results of this experimentation showed that the cognitive compo-nent of pupil reaction was still present despite the occurrence of the light reflex. Therefore, it was possible to detect the cognitive effort even when it interfered with pupillary light response. Nevertheless, this method is condition-locked since the luminance conditions were controlled and an averaged pupillary light response was obtained for each condition. In real environment such transitions from one level of luminance to another are limitless and it is impossible to obtain an av-eraged pupillary light response for each condition. Another method to identify cognitive pupillary component by calculating an independent component analysis was proposed byJainta and Baccino (2010). Al-though such methods could be successfully applied for post-analysis, they are inconvenient for on-line estimation of mental effort. Another method, convenient for on-line workload estimation, called“Index of Cognitive Activity” (Marshall, 2002) identifies fast pupillary dilations using wavelet analysis and counts their occurrences per second. It was reported to be sensitive to workload but not to light conditions (Marshall, 2002). Even though no experimental study was conducted, Marshall manipulated both screen luminance and room illumination to obtain dark and light conditions and reported that the index of cogni-tive activity was insensicogni-tive to luminance change. Furthermore, a recent study on nonhuman primates (Hampson et al., 2010) confirmed that fast pupillary dilations correlated with neuronsfiring in frontal cortex, hence suggesting a neural basis for the index of cognitive activity.
Nevertheless, very few studies have addressed the interaction issues between the TEPR and the light conditions (e.g. screen luminance, room illumination).Steinhauer et al. (2004)conducted an experiment under moderate room light and in darkness. They found an influence of task difficulty on overall pupil diameter during recording in light.
Benedetto et al. (2014)manipulated both screen luminance and ambi-ent illuminance during digital reading. They found that the screen lumi-nance had a more significant effect on pupil diameter compared to ambient illuminance. Authors proposed to explain it by proximity and concentration on the computer screen. Hence, the challenge is to define a pupil-based measure of cognitive load that would be independent of light conditions. Indeed, frequency analysis of pupillary response could bring to light its hidden behavior that reflects autonomic nervous system's reaction to light and cognition.
Pupillary signal is commonly analyzed both in time and frequency domains. In the time domain, one of the most current techniques of pu-pillary signal analysis consists in comparing the Task Evoked Pupu-pillary Responses (TEPR), a notion generalized byBeatty (1982). The TEPR is an averaged stimuli-locked pupil reaction reported to a short pre-stimulus baseline. It could be compared to an event-related potential— electrophysiological brain response— where pupillary “potential” is measured in pixels or millimeters, seeBeatty (1982), Beatty and Lucero-Wagoner (2000),Goldwater (1972)andAndreassi (2000)for exhaustive reviews.
In the frequency domain, pupillary oscillations drew researchers' attention starting withLowenstein's work (1963)describing pupillary fatigue waves that were quantified later byLüdtke et al. (1998). Since then, spectral analysis is often applied to analyze pupillary data. Pupil-lary spectrum is used either alone or together with other psychophysi-ological markers, for example, as an input for an artificial neural network (Ren et al., 2013). A few studies reported an increase of power spectrum density (PSD) of pupillary signal under mental work-load conditions compared to the rest or a control condition. Thus,
Nakayama and Shimizu (2004)found a significant increase of PSD in the frequency bands of 0.1–0.5 Hz and 1.6–3.5 Hz within calculation tasks. Fourier analysis of pupillary response is often applied in psycho-pathology (Grünberger, 2003; Grünberger et al., 1999) and sleep
research (Wilhelm et al, 1998; Lüdtke et al., 1998), where researchers often have a long pupillary record that permits a precise frequency anal-ysis. According to these studies, the amplitudes of pupillary oscillations are proportional to cognitive activity. Eventually, irregularities of pupil-lary oscillations can give insights about the activation of sympathetic/ parasympathetic nervous systems and the balance between them. For instance,Lew et al. (2008)discussed a possible application of short-time Fourier transforms for pupillary data analysis in order to investi-gate the changes of frequency components across time.
Along with pupil diameter, heart activity is another widespread psy-chophysiological proxy. As the pupil, the heart is influenced by both parasympathetic and sympathetic activity, decreasing and increasing its rhythm, respectively. The cardiac activity can be described by the heart rate variability method. The analysis of power spectrum of R–R in-tervals reveals two particular frequency components of cardiac activity: blood pressure variation located within a Low Frequency (LF) band from 0.04 up to 0.15 Hz, as defined byCamm et al. (1996); and respira-tory sinus arrhythmia located within a High Frequency (HF) band from 0.15 up to 0.40 Hz. Variability of the HF component is associated with parasympathetic activity, while the LF band is thought to be under both sympathetic and parasympathetic controls with dominant sympa-thetic influence (Billman, 2011). Since the proposition ofPagani et al. (1986), the ratio of cardiac signal powers within LF and HF bands, re-ferred as LF/HF or LH ratio, although controversial (Billman, 2013), is often used to measure the sympatho-vagal balance. Some researchers reported an increase in LF/HF ratio induced by mental effort (Durantin et al., 2014; Mizuno et al., 2011; Mukherjee et al., 2011). Since LF/HF ra-tios in these studies were greater than 1, this increase could be interpreted as a greater increase in the LF band compared with the HF band.
Calcagnini et al. (1997)simultaneously recorded pupillary and cardiac activity and reported that cardiovascular rhythms were contained in the pupillary signal. Since, there have been a few applica-tions of LF/HF ratio technique for pupillary analysis. For example,
Murata and Iwase (1998, 2000)reported increasing LF/HF ratio for pupil oscillations with increasing mental workload, using mental arith-metic and Sternberg short-term memory tasks. To compute the LF and HF activity, they used bands from 0.05 up to 0.15 Hz and from 0.3 up to 0.5 Hz, respectively. More recently, the ratio was used in a motor re-petitive task (Reiner and Gelfeld, 2013). Authors found that the LF/HF ratio decreased with the number of repetitions, indicating a decrease of mental workload (probably due to a habituation effect).
The objective of the present study was to explore the interaction be-tween luminance and cognition on pupillary dilation to deduce a pupil-based measure of load on memory that would be independent of nance conditions. To that end, we manipulated computer screen lumi-nance and load on memory. We investigated the influence of the luminance conditions on the task-evoked pupillary response and on the power spectrum of the pupillary signal under different levels of load on memory. To the authors' knowledge, no studies have performed an analysis of mental effort via the power spectrum of the pupillary sig-nal under different light conditions. In this study, we assessed the fol-lowing questions: a) How do luminance conditions affect the pupillary PSD? b) Is there an interaction effect between luminance and load on memory conditions on the TEPRs and power spectrum of the pupillary signal? c) If so, can we extract a frequency-based feature of the pupillary signal that would be solely dependent on the load on memory?
2. Materials and methods 2.1. Participants
208
22 healthy volunteers (4 females, 3 left-handed, age 24.5 ± 2.8,
ed-209
ucation 15.1 ± 1.0), students of ISAE (French Aerospace Engineering
210
School), all native French speakers, participated in the experiment
UNCORRECTED PR
OOF
after they gave their informed written consent. All reported normal au-ditory acuity and normal or corrected-to-normal vision.
2.2. Experimental design
Participants performed a short-term memory task where they were asked to recall a paced sequence of digits. Stimuli were presented in the auditory modality via two stereo speakers, positioned at each side of a computer monitor. Mean sound level of stimuli was measured at 75.3 ± 0.9 dB. Three levels of difficulty were produced with stimuli of 5, 7 or 9 digits, generated pseudo randomly (never two same successive digits) while the screen luminance was changing from trial to trial. The screen background was black (3.4 cd/m2), gray (24 cd/m2) or white
(54.8 cd/m2). In half of cases the participants were asked to retain the
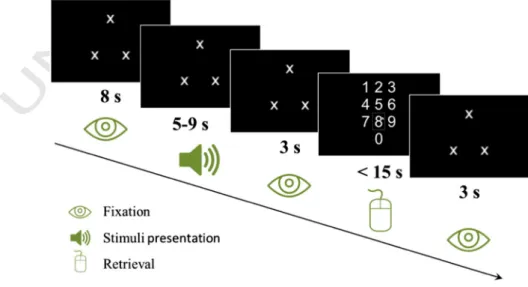
series of digits and to report it back (load on memory condition), while in others they were only asked to listen passively (control condi-tion). The time course of an example trial with black background and load on memory conditions is represented inFig. 1.
Except for the retrieval phase (when a numeric keypad was showed) threefixation crosses were forming a fixation triangle in the center of the computer screen. The subject was informed about the condition (whether or not to retain the series) by means of the direction of the fix-ation triangle during the whole trial. If the triangle pointed at the top (as onFig. 1), the subject was informed to recall the series. If the triangle pointed at the bottom (inverted compared to that onFig. 1: twofixation crosses at the top and one at the bottom), the subject was informed to listen to the stimulus passively (i.e. not to recall it). Furthermore, for control trials the on-screen numeric keypad was replaced by sharp signs placed in the same configuration as 10 pad digits.
Prior to the start of the main experiment, participants were visually provided with instructions and performed a practice block of 18 trials to familiarize with each condition. Then participants completed two blocks of 45 trials each (about 20 min long) with a 5 minute pause in-between. The experiment lasted for a total of 45 min and contained 5 trials per condition.
2.3. Stimuli and apparatus
A pseudo-random list of stimuli (used for all participants) was gen-erated using the following four rules: 1) the screen background changed each trial, 2) no more than two successive control trials were adminis-tered, 3) no more than two successive series of the same size (5, 7 or 9 digits) were presented, 4) each block began with at least two task tri-als. Thefirst rule helped to inform participants about the start of the next trial. The second rule averted the excessive distraction (that one
could expect during three or more successive control trials that would last approximately for 1 min and a half) and prevented the rhythm that one could expect in the case of alternation of control and load on memory conditions on every trial. The third rule made it impossible to think out a strategy of series retention because of the randomness of se-ries size (i.e. the participants were never aware of the number of digits they would have to memorize until the end of the sequence). Finally, the fourth rule helped the participants to get into gear in the beginning of each block.
Each trial started with an 8-second pre-stimulus accommodation period, during which participants' eyes were adapting to the new screen luminance condition. Then a sequence of digits was presented at a rate of one digit per second. After a 3-second retention pause, participants reported the sequence back (for the load on memory condition only) through the on-screen numeric keypad using the mouse. For the control condition they were asked to click on sharp signs randomly. Participants had 12 s to enter the series but were not informed about the exact max-imum. Once the response was given, each trial ended with an additional 3-second pause. No additional stimulus onset asynchrony was used as each trial length varied randomly as a function of response duration.
The experiment was conducted in a darkened sound-proof cham-ber. Ambient illuminance was measured at 10 lx. Participants were seated at a distance of approximately 65 cm from the 22″ monitor (1680 × 1250). During the whole experiment, participants' gaze posi-tion and pupil diameter were recorded with a remote SMI RED eye-tracker (SensoMotoric Instruments GmbH, Germany) at a sampling rate of 120 Hz. This device tracks the pupil diameter with precision despite the head is notfixed with a chinrest. Before each block the 5-point calibration of the eye-tracker was validated with four additional fixation points.
The stimuli presentation and data acquisition routines were imple-mented in Python programming language using PsychoPy software (Peirce, 2007). The data acquisition routine used iViewX SDK to communicate with the eye-tracker. The data analysis was performed in Matlab (Mathworks) and Statistica (StatSoft) softwares.
2.4. Pupil signal pre-processing
As suggested by Siegle (2011) the raw pupillary data were smoothed with a simple procedure described byGlaser and Ruchkin (1976), namely with a“two pass” 9-point filter (low-pass with cutoff frequency of 5.9 Hz). The attenuation in the band up to 4 Hz of the ap-pliedfilter was less than 0.1 dB. Identified blinks were then replaced using linear interpolation. In order to remove the eyelid-closure effect as well as the consequences offiltering in the neighborhood of signal
UNCORRECTED PR
OOF
discontinuities caused by blinks, 12 adjoined points (100 ms) from each side were replaced as well. The pupillary signal was then down-sampled to 50 Hz. This was done not only to reduce the data size but also to be able to average point-by-point stimuli-locked pupillary re-sponses. Indeed, small irregular inter-sampling lags can interfere with the averaging procedure. The down-sampling technique generates a regular time grid and allows therefore computing correctly the TEPRs. 2.5. Data processing for statistical analyses
For the time domain analysis, baseline pupil diameter was calculated as the median value of the 500 ms preceding the stimulus onset. Trials were segregated according to experimental conditions and averaged point-by-point giving a TEPR per condition per participant. For the sta-tistical analysis, the mean value of pupil diameter during the retention pause (3 s following the stimuli) was used.
The frequency analysis was performed on 8-second periods consisting of the last 5 s of stimuli presentation and 3 s of the pause be-fore retrieval. The linear trend was removed using detrend MATLAB® function that removes the best straight-linefit from the signal. Then, each period of 400 samples (8 s × 50 Hz) was zero-padded to 512 sam-ples so that the frequency resolution was less than 0.1 Hz. The power spectral density (PSD) was estimated using Welch's method (pwelch function from Matlab Signal Processing Toolbox) with segments of length 50 with 50% overlap. Each segment was windowed with a Hamming window. Finally, the power was converted to dB. Most of the pupillary activity appears within the frequency band up to 4 Hz ac-cording toNakayama and Shimizu (2004). Thereby, the TEPRs frequen-cy components were analyzed within the frequenfrequen-cy band from 0 up to 4 Hz.
2.6. Statistical analyses
A trial was rejected if the overall time spent to blink exceeded 50% of the period of interest (i.e. exceeded 4 s) and if the longest blink exceeded 1 s in length. After data rejection, a 2 × 3 × 3 three-way ANOVA— load (load on memory vs. control) × luminance (black vs. gray vs. white) × size (5 digits vs. 7 digits vs. 9 digits)— was performed to examine the number of valid trials for each condition. The analysis re-vealed a significant data loss depending on luminous condition, F(2, 42) = 17.7, pb .001, η2= 0.46. Tukey's HSD (Honestly Signi
ficant Dif-ference) post-hoc comparison showed that the average number of valid trials was significantly lower (p b .001) for the black luminous condition (1.9 ± 0.3 out of 5) compared with gray (3.5 ± 0.2 trials) and white (3.5 ± 0.2 trials) background conditions. During the darkest condition participants probably gave their eyes a rest after an exposure to a bright screen in darkened room that implied higher blink rate (Benedetto et al., 2014). Therefore, this condition was not used for the further anal-ysis because of insufficient number of average valid trials to have a valid mean value. Furthermore, as stated byNakayama (2006), loss of pupil signal caused by blinks has an impact on frequency analysis adding extra power in the spectrum. More importantly, as suggested bySiegle (2011), at least 5–10 trials have to be averaged in order to obtain reliable results. However, we retained at most 3.9 ± 0.3 (out of 5) valid trials per condition. In order to further increase the number of observa-tions and to focus the analysis of the interaction between load and luminous conditions, we aggregated the three different levels of dif ficul-ties for all the subsequent analysis. Eventually, we had at least 10.2 ± 0.9 valid trials (out of 15) within each condition.
Statistical two-sided t-test was performed on the number of correct-ly recalled sequences for load on memory condition to investigate the influence of the luminance condition on performance.
Four 2 × 2 two-way repeated measure ANOVAs with within subject factor load (load on memory vs. control) and luminance (gray back-ground vs. white backback-ground) were carried out on the absolute pupil
diameters (during baseline and retention pause), TEPRs and total PSD. Tukey's HSD was used for post-hoc comparisons.
To compare the effect of two levels within each of the two factors (load and luminance) across different frequencies, we computed Cohen's D value for each frequency point. As consistent with Cohen (“A medium effect size is conceived as one large enough to be visible to the naked eye.”) we chose the threshold value of 0.4 (Cohen, 1988) to select the data points significantly impacted by the load on memory effect across the frequencies. Low Frequency band and High Frequency band were identified accordingly. Three 2 × 2 two-way repeated measure ANOVAs with within subject factor load (load on memory vs. control) and luminance (gray background vs. white background) were carried out on the mean PSD within LF and HF bands, as well as on LF/ HF ratio. Tukey's HSD was used for post-hoc comparisons.
3. Results
3.1. Behavioral results
Statistical two-sided t-test comparison showed that screen lumi-nance had no influence on participants' performance, t(22) = 0.34, p = 0.74.
3.2. Absolute pupil diameter
3.2.1. During 500 ms pre-stimulus baseline period
The two-way ANOVA (load × luminance) showed no effect of task, F(1, 21)b 1, p = 0.78, but a strong main effect of luminance (smaller pupil for brighter screen), F(1, 21) = 128.0, pb .001, η2= 0.86, on
ab-solute pupil diameter during the baseline period. No interaction was found, F(1, 21)b 1, p = 0.33.
3.2.2. During retention pause
Two-way ANOVA (load × luminance) revealed significant main ef-fects of both load, F(1, 21) = 78.8, pb .001, η2
= 0.79, and luminance factors, F(1, 21) = 180.5, pb .001, η2= 0.90, on absolute pupil
diame-ter. The pupil was greater for the load on memory condition compared to the control condition. And it was greater for the gray background compared to the white background. The interaction was also significant, F(1, 21) = 24.35, pb .001, η2= 0.54. As shown by Tukey's HSD test, the
pupil was significantly smaller within the load on memory condition with white background (pb .001) compared to the control condition with gray background. In addition, the post-hoc test showed that load on memory vs. control condition implied significantly greater (pb .001) pupil diameter for both luminance conditions.
3.3. TEPRs in time domain
The two-way ANOVA (load × luminance) revealed a significant main effect of load on pupil diameter that was larger during the load on mem-ory condition compared to the control condition, F(1, 21) = 69.5, pb .001, η2= 0.77. In addition, we found a main effect of luminance,
F(1, 21) = 29.9, pb .001, η2= 0.59, corresponding to a smaller dilation
amplitude within the white background condition (seeFig. 2). The in-teraction of the two factors was also significant, F(1, 21) = 5.96, pb .05, η2= 0.22. Tukey's HSD post-hoc tests showed that the load
ef-fect (load on memory vs. control) was significant for both light condi-tions (pb .001) whereas the influence of luminance was significant only during the load on memory condition (ploadb .001, pcontrol=
0.42;Fig. 2).
3.4. TEPRs in frequency domain
The two-way ANOVA (load × luminance) for the total spectrum (0–4 Hz) showed that the PSD was significantly higher under load on memory condition than under control condition, F(1, 21) = 9.6,
UNCORRECTED PR
OOF
2 pb .01, η2= 0.31. The gray background condition yielded signi
ficantly
3 higher PSD compared to the white background, F(1, 21) = 38.5,
4 pb .001, η2= 0.65. No significant interaction was found, F(1, 21) =
5 0.01, p = 0.91.
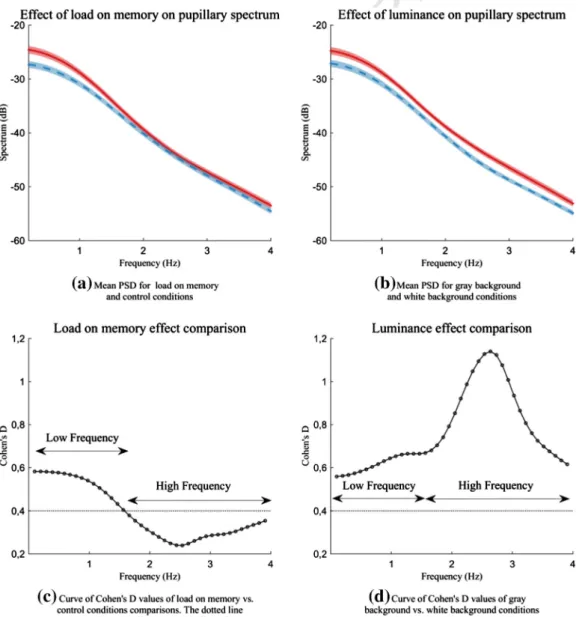
Fig. 3shows the mean spectrum values across participants for the main effect of both load on memory (a) and luminance conditions (b). While the effect of the luminance factor was high for the total spectrum (d), the effect of the load factor faded away as a function of frequency (c). After the comparison of the effect of two levels within each of two factors (load and luminance) across different frequencies using Cohen's D values, we determined a frequency threshold of 1.6 Hz (Low Frequen-cy band = 0–1.6 Hz; High Frequency band = 1.6–4 Hz). We averaged PSD in these two bands in order to assess load on memory (Fig. 3c) and luminance effects (Fig. 3d) with classical analysis of variance.
In the Low Frequency band (0–1.6 Hz) the mean PSD was signifi-cantly higher under load on memory vs. control condition, F(1, 21) = 9.41, pb .01, η2= 0.31. In addition, the white background caused
signif-icantly smaller mean PSD than the gray background, F(1, 21) = 14.9, pb .001, η2= 0.42. No interaction was found, F(1, 21) = 0.3, p =
0.59. Regarding the High Frequency band (1.6–4 Hz), no significant ef-fect of load on memory on the mean PSD was found, F(1, 21) = 4.1, p = .06, while luminance had a significant effect, F(1, 21) = 32.4, pb .001, η2= 0.61. No interaction was found, F(1, 21) = 0.2, p =
0.64. In summary, the effect of load was significant only for the low fre-quency band whereas the effect of luminance was significant for both frequency bands.
Fig. 2. Grand-average response-aligned TEPR (with shaped error-type) per condition. Timeline corresponds to the last 4 s of stimulus presentation and 3 s of retention pause. The vertical dashed line depicts the start of the retention pause.
Fig. 3. Curves of mean values (with shaped error-type) for (a) load on memory vs. control conditions and (b) gray background vs. white background conditions; and (c, d) corresponding curves of Cohen's D values of point-by-point comparisons.
UNCORRECTED PR
OOF
We then computed LH/HF ratio of mean PSD. The results of the ANOVA showed a significantly lower ratio under load on memory vs. control condition, F(1, 21) = 6.83, pb .05, η2= 0.25, while no effect
of the luminance was found, F(1, 21) = 1.67, p = .21. No interaction was found, F(1, 21) = 0.5, p = 0.47.Table 1summarizes the mean and standard deviation values for the main results.
4. Discussion
We investigated the effect of load on memory under different lumi-nance conditions on the pupillary task-evoked response and its different components of power spectrum. Our main results showed that the TEPR amplitude was smaller under bright vs. dark condition and that the load on memory impacted specifically the low frequency component of pu-pillary spectrum, whereas the luminance affected both low and high frequency bands. Thesefindings allowed identifying a frequency-based metric of pupillary activity— the LF/HF ratio — that is sensitive to load on memory but not to luminance.
4.1. Effects of load on memory and luminance factors on the absolute pupil diameter
There was no effect of load on memory on the baseline (500 ms pre-stimulus) pupil diameter. This indicates the absence of the anticipation effect, i.e. no mental preparation effect to load on memory condition vs. control condition. Pupil baseline diameter was solely impacted by lumi-nance. Thus, the effects of load on memory on TEPR are not due to any confounding factors on the baseline.
The absolute pupil diameter was significantly higher under load on memory vs. control condition, which is coherent withBeatty and Lucero-Wagoner (2000). Pupil diameter was also significantly smaller under white background condition. However, the pupil size for the load on memory condition with white background was smaller than
for the control condition under gray background condition. These results confirm the findings ofXu et al. (2011); the light reaction is pre-dominant over the cognitive pupillary component. This major light in-fluence motivates the use of relative pupillary dilations (TEPRs). 4.2. Effects of load on memory and luminance factors on the TEPR amplitude
The TEPR amplitude under load on memory condition was not the same according to luminance condition; the same amount of load on memory induced higher relative pupillary dilation within darker back-ground condition. Thus, to accurately measure the mental workload based on the pupil diameter, it might be important to take the point of fixation and its luminance into account.
Thisfinding is coherent with previous findings. Namely, pupil diam-eter was found to have a close relationship with thefiring rate of the locus coeruleus (LC), a nucleus in the brainstem that is involved in the neural circuitry regulating arousal and autonomic function (Samuels and Szabadi, 2008; Gilzenrat et al., 2010; Rajkowski et al., 1993). In-creased LC activity correlates with higher sympathetic tone (Elam et al., 1986; Gilzenrat et al., 2010) and leads to parasympathetic inhibi-tion of Edinger–Westphal complex (Samuels and Szabadi, 2008), that both result in pupillary dilation. Decreased parasympathetic tone under dim light (Steinhauer et al., 2004) should therefore result in higher sympathetic influence on the peak pupil diameter (i.e. larger ap-erture). It should be noted that the sympathetic component of pupillary dilation has greater latency; the inhibition of parasympathetic path-ways results in an earlier peak, whereas sympathetic activity is respon-sible for pupillary peak dilation after about 1200 ms of stimulus presentation (Steinhauer and Hakerem, 1992). Consequently, when studying sustained processing measuring mean pupil diameter for a long period of time (e.g.Steinhauer et al., 2004), the average pupil size is slightly greater under bright light conditions (contribution of early parasympathetic dilations). Conversely, while focusing on mean peak dilations as in our study, the brighter light diminished the TEPR's peak amplitude as a consequence of increased parasympathetic tone.
Pomplun and Sunkara (2003)proposed to perform a calibration pro-cedure in order to determine a pupil baseline diameter as a function of display brightness for accurate cognitive load measurement in ecologi-cal situations. During the experiment, the authors suggested to subtract the calibration value from the pupillary signal according the current dis-play brightness. This extends the standard baseline subtraction proce-dure to the cases when the display brightness changes during stimuli presentation, as in an ecologicalflight or drive stimulator. Furthermore, our results encourage the extension of this calibration procedure by specifying the relationship between the amplitude of pupillary dilation for a given amount of cognitive load and current display luminance. Interestingly, as no such model presently exists, an extra“cognitive” cal-ibration could be performed simultaneously by asking participants to perform a mental calculation by varying display luminance and measur-ing the correspondmeasur-ing TEPR amplitude.
4.3. Effects of load on memory and luminance factors on the spectrum of the pupillary signal
The analysis of the total considered spectrum (0–4 Hz) showed that the PSD of the pupillary signal was higher under load on memory com-pared to the control condition, and under the gray background condi-tion compared to the white background condicondi-tion. While the absolute pupil diameter revealed the overall effort due to some cognitive process, the power of spectral density of pupillary signal characterizes the activ-ity of the nervous system during this process. In the context of our experiment, the higher pupillary activity indicated higher overall effort (cf. results on absolute pupil diameter inSection 3.2) because of the cu-mulative nature of this short-memory task. This result echoes the find-ings ofNakayama and Shimizu (2004)who observed an increase in pupillary power spectrum during mental computations.
Table 1
a) Effect of load on memory condition on the dependent variables. b) Effect of background luminance condition on the dependent variables. Values are mean ± (SD), (n = 22 for all variables).
a)
Dependent variable Load on memory factor
Control Load on memory Absolute diameter during
baseline period (mm)
4.04 (0.17) 4.02 (0.16)
Absolute diameter during retention pause (mm)⁎⁎⁎ 3.96 (0.16) 4.36 (0.18) TEPR amplitude (mm)⁎⁎⁎ −0.07 (0.02) 0.33 (0.04) Total spectrum (dB)⁎⁎ −39.80 (0.59) −38.48 (0.67) Mean PSD in LF (dB)⁎⁎ −30.46 (0.67) −28.27 (0.78) Mean PSD in HF (dB) −46.02 (0.60) −45.29 (0.67) LF/HF ratio of mean PSD⁎ 0.66 (0.01) 0.62 (0.01) b)
Dependent variable Luminance factor
Gray White
Absolute diameter during baseline period (mm)⁎⁎⁎
4.42 (0.19) 3.64 (0.14)
Absolute diameter during retention pause (mm)⁎⁎⁎ 4.62 (0.20) 3.71 (0.14) TEPR amplitude (mm)⁎⁎⁎ 0.20 (0.03) 0.06 (0.02) Total spectrum (dB)⁎⁎⁎ −38.10 (0.64) −40.18 (0.59) Mean PSD in LF (dB)⁎⁎⁎ −28.30 (0.70) −30.43 (0.68) Mean PSD in HF (dB)⁎⁎⁎ −44.63 (0.70) −46.68 (0.57) LF/HF ratio of mean PSD 0.63 (0.01) 0.65 (0.01) ⁎ p b .05. ⁎⁎ p b .01. ⁎⁎⁎ p b .001. 6
UNCORRECTED PR
OOF
Besides, the statistical analysis showed that load on memory and lu-minance factors did not have the same effect on the pupillary signal spectrum. While under brighter condition the PSD was higher through-out the whole considered frequency band (0–4 Hz), the effect of the load on memory factor was only present in the low frequency band (up to 1.6 Hz). Indeed, the adaptation of the pupil to the luminous level (light/dark reflexes) and the cognitive component of the pupillary reaction have different neural pathways.
4.4. Effects of load on memory and luminance factors on the LF/HF ratio The analysis of the effect of load on memory and luminance on the spectrum of pupillary signal allowed us to dissociate these two effects. The ratio of PSD of the pupillary signal within Low and High frequency bands was significantly lower under load on memory condition com-pared to the control condition; but it did not differ in the luminance con-ditions. This result is in line with previous studies on the influence of mental workload on heart rate variability showing a greater increase of LF activity compared to HF activity (Durantin et al., 2014; Mizuno et al, 2011; Mukherjee et al, 2011). Nevertheless, note the difference be-tween the frequency bands used in this study compared to the stan-dardized bands used in heart rate variability studies. As for cardiac activity analysis (Billman, 2013), the physiological basis of these chang-es in the low-high frequency ratio is difficult to discern.
Compared with the index of cognitive activity (Marshall, 2002), that tracks the fast punctual pupillary dilations and may indicate increases of neuronfiring (Hampson et al., 2010), the presented LF/HF ratio of pupil-lary power spectrum indicates the overall tonic state during mental ac-tivity. Thereby, the LF/HF ratio measures the cognitive load with lower temporal resolution, but requires lower sampling frequency compared with the index of cognitive activity.
5. Conclusion
This study showed that the amplitude of task-evoked pupillary re-sponse depends on luminance conditions. Therefore, the interpretation of pupillary data in complex ecological settings, where it is difficult to constantly control for display luminosity, might be done carefully. For example, a stimuli-locked dilation of 0.5 mm on a bright vs. darkfixation area would not have the same interpretation in terms of mental effort. Thus, an extra calibration procedure could be performed prior to the ex-periment, in order to deduce a relationship between the extent of cog-nitive pupillary dilation and the current luminance level. It would be also interesting to investigate the interaction effects of the ambient illu-minance and thefixation area luminance on the pupillary cognitive di-lation. Such experiments could lead to a model linking the amplitude of TEPR and light conditions to facilitate calibration procedure.
Furthermore, the frequency analysis turns to be an efficient tool for pupillary data investigation. Different factors impact different pupillary frequency components. While the luminance impacts both high and low frequency components, the load on memory factor manifests itself only within low frequency band. Therefore, we can construct some use-ful features based on signal frequency components, for example the LF/ HF ratio of pupillary power spectrum. The presented pupillary LF/HF ratio could potentially be an efficient objective measure of mental effort based on pupil diameter that does not depend on luminance conditions. Besides its off-line applications for pupillary signal analysis, thisfinding could be helpful in creating a near real-time luminance-independent metric for mental workload estimation. Thus, there will be no need of measuring the point offixation and its neighborhood luminance to cor-rect the pupillary measurements. Mental effort could be detected with a simple camera measuring pupil diameter.
Future studies could validate the currentfindings by recording simultaneously the cardiac, respiratory and pupillary activities under different luminance conditions with longer periods of interest. The con-frontation of cardiac and respiratory data (on one hand) and pupillary
data (on the other) would give extra physiological sense to pupillary frequency components.
References
Andreassi, J.L., 2000. Pupillary response and behavior. Psychophysiology: Human Behav-ior & Physiological Response. Lawrence Erlbaum Associates, Mahwah, NJ, pp. 218–233.
Ariel, R., Castel, A.D., 2014. Eyes wide open: enhanced pupil dilation when selectively studying important information. Exp. Brain Res. 232 (1), 337–344.http://dx.doi. org/10.1007/s00221-013-3744-5.
Beatty, J., 1982. Task-evoked pupillary responses, processing load, and the structure of processing resources. Psychol. Bull. 91, 276–292.
Beatty, J., Lucero-Wagoner, B., 2000. The pupillary system. In: Cacioppo, J.T., Tassinary, L.G., Bernston, G.G. (Eds.), Handbook of Psychophysiology, 2nd ed. Cambridge Uni-versity Press, Cambridge, England, pp. 142–162.
Benedetto, S., Carbone, A., Drai-Zerbib, V., Pedrotti, M., Baccino, T., 2014. Effects of lumi-nance and illumilumi-nance on visual fatigue and arousal during digital reading. Comput. Hum. Behav. 41, 112–119.http://dx.doi.org/10.1016/j.chb.2014.09.023.
Billman, G.E., 2011. Heart rate variability— a historical perspective. Front. Physiol. 2.
http://dx.doi.org/10.3389/fphys.2011.00086.
Billman, G.E., 2013. The LF/HF ratio does not accurately measure cardiac sympatho-vagal balance. Front. Physiol. 4.http://dx.doi.org/10.3389/fphys.2013.00026.
Bradshaw, J.L., 1969. Background light intensity and the pupillary response in a reaction time task. Psychon. Sci. 14 (6), 271–272.http://dx.doi.org/10.3758/BF03329118. Calcagnini, G., Lino, S., Censi, F., Cerutti, S., 1997. Cardiovascular autonomic rhythms in
spontaneous pupilfluctuations. Comput. Cardiol. 133–136http://dx.doi.org/10. 1109/CIC.1997.647848.
Camm, A., Malik, M., Bigger, J., Breithardt, G., Cerutti, S., Cohen, R., et al., 1996. Heart rate variability: standards of measurement, physiological interpretation and clinical use. Task Force of the European Society of Cardiology and the North American Society of Pacing and Electrophysiology. Circulation 93 (5), 1043–1065.
Causse, M., Sénard, J.-M., Démonet, J.F., Pastor, J., 2010. Monitoring cognitive and emotion-al processes through pupil and cardiac response during dynamic versus logicemotion-al task. Appl. Psychophysiol. Biofeedback 35 (2), 115–123. http://dx.doi.org/10.1007/ s10484-009-9115-0.
Cohen, J., 1988. Statistical Power Analysis for the Behavioral Sciences. Lawsrence Erlbaum Associates, Hillsdale, NJ.
Durantin, G., Gagnon, J.-F., Tremblay, S., Dehais, F., 2014. Using near infrared spectroscopy and heart rate variability to detect mental overload. Behav. Brain Res. 259, 16–23.
http://dx.doi.org/10.1016/j.bbr.2013.10.042.
Elam, M., Svensson, T.H., Thorèn, P., 1986. Locus coeruleus neurons and sympathetic nerves: activation by cutaneous sensory afferents. Brain Res. 366 (1), 254–261. Gilzenrat, M.S., Nieuwenhuis, S., Jepma, M., Cohen, J.D., 2010. Pupil diameter tracks
chang-es in control state predicted by the adaptive gain theory of locus coeruleus function. Cogn. Affect. Behav. Neurosci. 10 (2), 252–269.http://dx.doi.org/10.3758/CABN.10.2. 252.
Glaser, E.M., Ruchkin, D.S., 1976. Principles of Neurobiological Signal Analysis. Academic Press, New York, NY.
Goldwater, B.C., 1972. Psychological significance of pupillary movements. Psychol. Bull. 77 (5), 340–355.
Grünberger, J., 2003. Pupillometrie in der klinischpsychophysiologischen Diagnostik. Springerhttp://dx.doi.org/10.1007/978-3-7091-6032-9.
Grünberger, J., Linzmayer, L., Walter, H., Rainer, M., Masching, A., Pezawas, L., et al., 1999. Receptor test (pupillary dilatation after application of 0.01% tropicamide solution) and determination of central nervous activation (Fourier analysis of pupillary oscilla-tions) in patients with Alzheimer's disease. Neuropsychobiology 40 (1), 40–46. Hampson, R.E., Opris, I., Deadwyler, S.A., 2010. Neural correlates of fast pupil dilation in
nonhuman primates: relation to behavioral performance and cognitive workload. Behav. Brain Res. 212, 1–11.http://dx.doi.org/10.1016/j.bbr.2010.03.011.
Hess, E.H., Polt, J.M., 1960. Pupil size as related to interest value of visual stimuli. Science 132 (3423), 349–350.
Hess, E.H., Polt, J.M., 1964. Pupil size in relation to mental activity during simple problem-solving. Science 143 (3611), 1190–1192.
Jainta, S., Baccino, T., 2010. Analyzing the pupil response due to increased cognitive de-mand: an independent component analysis study. Int. J. Psychophysiol. 77 (1), 1–7.
http://dx.doi.org/10.1016/j.ijpsycho.2010.03.008. Kahneman, D., 1973. Attention and Effort. Prentice-Hall.
Kahneman, D., Beatty, J., 1966. Pupil diameter and load on memory. Science 154 (3756), 1583–1585.
Kang, O.E., Huffer, K.E., Wheatley, T.P., 2014. Pupil dilation dynamics track attention to high-level information. PLoS One 9 (8).http://dx.doi.org/10.1371/journal.pone. 0102463.
Lew, R., Dyre, B.P., Werner, S., Wotring, B., Tran, T., 2008. Exploring the potential of short-time Fourier transforms for analyzing skin conductance and pupillometry in real-time applications. Proceedings of the Human Factors and Ergonomics Society Annual Meeting 52, pp. 1536–1540.http://dx.doi.org/10.1177/154193120805201949. Loewenfeld, I.E., Lowenstein, O., 1993. The Pupil: Anatomy, Physiology, and Clinical
Appli-cations. Iowa State University Press Ames.
Lowenstein, O., Feinberg, R., Loewenfeld, I.E., 1963. Pupillary movements during acute and chronic fatigue a new test for the objective evaluation of tiredness. Invest. Ophthalmol. Vis. Sci. 2 (2), 138–157.
Lüdtke, H., Wilhelm, B., Adler, M., Schaeffel, F., Wilhelm, H., 1998. Mathematical proce-dures in data recording and processing of pupillary fatigue waves. Vis. Res. 38 (19), 2889–2896.
UNCORRECTED PR
OOF
Marshall, S.P., 2002. The index of cognitive activity: measuring cognitive workload.Pro-ceedings of the IEEE Conference on Human Factors and Power Plants, pp. 75–79
http://dx.doi.org/10.1109/HFPP.2002.1042860.
Mizuno, K., Tanaka, M., Yamaguti, K., Kajimoto, O., Kuratsune, H., Watanabe, Y., 2011. Mental fatigue caused by prolonged cognitive load associated with sympathetic hy-peractivity. Behav. Brain Funct. 7, 17.http://dx.doi.org/10.1186/1744-9081-7-17. Mukherjee, S., Yadav, R., Yung, I., Zajdel, D.P., Oken, B.S., 2011. Sensitivity to mental effort
and test–retest reliability of heart rate variability measures in healthy seniors. Clin. Neurophysiol. 122 (10), 2059–2066.http://dx.doi.org/10.1016/j.clinph.2011.02.032. Murata, A., Iwase, H., 1998. Evaluation of mental workload byfluctuation analysis of pupil
area. Proceedings of the 20th Annual International Conference of the IEEE Engineer-ing in Medicine and Biology Society, vol. 20, No 6, pp. 3094–3097http://dx.doi.org/ 10.1109/IEMBS.1998.746146.
Murata, A., Iwase, H., 2000. Evaluation of mental workload by variability of pupil area. IEICE Trans. Inf. Syst. 83 (5), 1187–1190.
Naber, M., Nakayama, K., 2013. Pupil responses to high-level image content. J. Vis. 13 (6), 7.http://dx.doi.org/10.1167/13.6.7.
Nakayama, M., 2006. Influence of blink on pupillary indices. Proceedings From BioCAS: The Biomedical Circuits and Systems Conference. BioCAS, London, pp. 29–32http:// dx.doi.org/10.1109/BIOCAS.2006.4600300.
Nakayama, M., Shimizu, Y., 2004. Frequency analysis of task evoked pupillary response and eye-movement. Proceedings From the ACM Eye Tracking Research & Application Symposium. ACM Press, New York, NY, pp. 71–76http://dx.doi.org/10.1145/968363. 968381.
Pagani, M., Lombardi, F., Guzzetti, S., Rimoldi, O., Furlan, R., Pizzinelli, P., et al., 1986. Power spectral analysis of heart rate and arterial pressure variabilities as a marker of sympatho-vagal interaction in man and conscious dog. Circ. Res. 59 (2), 178–193. Palinko, O., Kun, A.L., 2012. Exploring the effects of visual cognitive load and illumination
on pupil diameter in driving simulators. Proceedings of the Symposium on Eye Track-ing Research and Applications, pp. 413–416http://dx.doi.org/10.1145/2168556. 2168650.
Peirce, J.W., 2007. PsychoPy— psychophysics software in Python. J. Neurosci. Methods 162 (1), 8–13.http://dx.doi.org/10.1016/j.jneumeth.2006.11.017.
Pereverzeva, M., Binda, P., Murray, S.O., 2012. Covert attention to bright and dark surfaces drives pupillary responses. J. Vis. 12 (9), 661-661.http://dx.doi.org/10.1167/12.9.661.
Pomplun, M., Sunkara, S., 2003. Pupil dilation as an indicator of cognitive workload in human–computer interaction. Proceedings of the International Conference on HCI. Rajkowski, J., Kubiak, P., Aston-Jones, G., 1993. Correlations between locus coeruleus (LC)
neural activity, pupil diameter and behavior in monkey support a role of LC in atten-tion. Soc. Neurosci. Abstr. 19, 974.
Reiner, M., Gelfeld, T.M., 2013. Estimating mental workload through event-related fluctu-ations of pupil area during a task in a virtual world. Int. J. Psychophysiol. 93 (1), 38–44.http://dx.doi.org/10.1016/j.ijpsycho.2013.11.002.
Ren, P., Barreto, A., Gao, Y., Adjouadi, M., 2013. Affective assessment by digital processing of the pupil diameter. IEEE Trans. Affect. Comput. 4 (1), 2–14.http://dx.doi.org/10. 1109/T-AFFC.2012.25.
Samuels, E., Szabadi, E., 2008. Functional neuroanatomy of the noradrenergic locus coeruleus: its roles in the regulation of arousal and autonomic function part II: phys-iological and pharmacological manipulations and pathological alterations of locus coeruleus activity in humans. Curr. Neuropharmacol. 6 (3), 254–285.http://dx.doi. org/10.2174/157015908785777193.
Siegle, G., 2011. Analysis of pupillary data. Fundamentals of Pupillary Measures and Eye Movements Workshop. Society for Psychophysiological Research.
Steinhauer, S.R., Hakerem, G., 1992. The pupillary response in cognitive psychophysiology and schizophrenia. Ann. N. Y. Acad. Sci. 658 (1), 182–204.
Steinhauer, S.R., Siegle, G.J., Condray, R., Pless, M., 2004. Sympathetic and parasympathetic innervation of pupillary dilation during sustained processing. Int. J. Psychophysiol. 52 (1), 77–86.
Tryon, W.W., 1975. Pupillometry: a survey of sources of variation. Psychophysiology 12 (1), 90–93.
Wilhelm, B., Wilhelm, H., Lüdtke, H., Streicher, P., Adler, M., 1998. Pupillographic assess-ment of sleepiness in sleep-deprived healthy subjects. Sleep 21 (3), 258–265. Xu, J., Wang, Y., Chen, F., Choi, E., 2011. Pupillary response based cognitive workload
mea-surement under luminance changes. In: Campos, P., Graham, N., Jorge, J., Nunes, N., Palanque, P., Winckler, M. (Eds.), HCI— INTERACT 2011. Volume 6947 of LNCS, pp. 178–185http://dx.doi.org/10.1007/978-3-642-23771-3_14.