DOCTORAT DE L'UNIVERSITÉ DE TOULOUSE
Délivré par :Institut National Polytechnique de Toulouse (Toulouse INP) Discipline ou spécialité :
Ecologie Fonctionnelle
Présentée et soutenue par :
Mme CLARISSE LINEle vendredi 27 septembre 2019
Titre :
Unité de recherche : Ecole doctorale :
Evaluation of parameters influencing plant response to carbon nanotube
contamination
Sciences de l'Univers de l'Environnement et de l'Espace (SDU2E) Laboratoire Ecologie Fonctionnelle et Environnement ( ECOLAB)
Directeur(s) de Thèse :
M. EMMANUEL FLAHAUT MME CAMILLE LARUE
Rapporteurs :
M. MATHIEU PINAULT, CEA SACLAY Mme GERALDINE SARRET, CNRS
Membre(s) du jury :
Mme ANNE PROBST, CNRS TOULOUSE, Président M. EMMANUEL FLAHAUT, UNIVERSITE TOULOUSE 3, Membre
Mme ANA ELENA PRADAS DEL REAL, INSTITUTO MADRILENO INVESTIGACION, Membre Mme CAMILLE LARUE, CNRS TOULOUSE, Membre
Mme CATHERINE SANTAELLA, CEA CADARACHE, Membre
M. NICOLAS GRUYER, CENTRE EXPERTISE ANALYSE ENVIRONNEMENT, Membre
Carbon nanotubes (CNTs) are among the most used nanomaterials (NMs) thanks to their excellent properties (i.e. optical, mechanical, electrical and thermal). All along their lifecycle, they may be spread unintentionally in the environment. They could also be introduced intentionally due to novel applications (e.g. growth regulators in agriculture, remediation of polluted soil, etc.). For this reason, it is essential to assess their behavior and potential impacts on ecosystems and particularly on agroecosystem. Plants are found at the interface between soil, air and water and at the basis of the food chains. The possible accumulation of such emerging contaminants in edible plants places this topic in the food safety field, and thus makes it a potential public health problem. Overall, behaviour and effects of CNTs in plants are not well understood and still very controversial. This can be explained by the influence of several parameters on plant response to CNT exposure. For instance, plant response can be different if CNTs are internalized or not. However, their detection in plants is still a challenge. Several CNT detection techniques were reviewed in this work and their pros and cons tested. To review the different detection techniques, we used hydroponic exposure while all the other experiments were conducted in soil. Plant response can also vary according to the type of NMs used. To investigate this hypothesis, tomato plant response to two TiO2
-NPs and double walled CNTs (DWCNTs) was evaluated using classical morphological and biochemical markers and Fourier-transformed infrared spectroscopy (FTIR). Our results highlighted that even if the two NMs were different for several parameters (i.e. shape, size, surface chemistry), tomato plants tended to exhibit a common response with a strong impact on cell wall components. CNTs can also have different impacts according to the plant species considered. Responses of different plant species (tomato, canola, maize and cucumber) to a DWCNT contamination were assessed highlighting differences among species: maize displayed a decreased development while for the other species, enhanced development was mostly identified. However, plant cell wall components were impacted in the four species. Many different CNTs are currently available on the market, varying in their physicochemical parameters. Five types of CNTs with different diameter/number of walls, functionalization and length were used to investigate their impacts on canola. Canola was more sensitive to CNTs with the smallest diameter and the highest specific surface area, but it was also observed that the functionalization greatly modulated plant response. Finally, the influence of a concomitant environmental stress on CNT toxicity was investigated. Canola plants were grown under optimal conditions or under heat stress. Under optimal conditions, the different CNTs did not canola impact canola growth. However, under heat stress, CNT exposure led to significant differences in plant development according to CNT type. Functionalized double walled CNTs were able to alleviate the effects of the abiotic stress on the plants while the non-functionalized CNTs increased the inhibition on plant development. Plants were thus more sensitive to CNTs when they were submitted to a concomitant heat stress.
Keywords: carbon nanotubes, detection, plant response, FTIR, plant species, physicochemical parameters, combined stress
Les nanotubes de carbone (NTC) sont parmi les nanomatériaux (NM) les plus utilisés grâce à leurs excellentes propriétés optiques, mécaniques, électriques et thermiques. Tout au long de leur cycle de vie, ils peuvent se propager de façon involontaire ou intentionnelle dans l’environnement. Il est donc essentiel d'évaluer leur comportement et leurs impacts potentiels sur les écosystèmes et en particulier sur l'agroécosystème. Les plantes se trouvent à l'interface entre le sol, l'air et l'eau et à la base des chaînes alimentaires. L'accumulation possible d'un tel contaminant émergent dans les plantes place ce sujet de recherche dans le domaine de la santé publique. Le comportement et les effets des NTC chez les plantes ne sont pas bien compris et demeurent très controversés. Ceci peut s'expliquer par l'influence de plusieurs paramètres sur la réponse des plantes à une contamination. Ainsi, la réponse peut être différente si les NTC sont internalisés ou non. Cependant, leur détection dans les plantes reste un défi. Plusieurs techniques de détection de ces NTC ont été examinées dans ce travail afin d’en déterminer les avantages et les inconvénients. Pour passer en revue les différentes techniques, nous avons utilisé des conditions d’exposition hydroponiques alors que toutes les autres expériences ont été réalisées en sol. La réponse des plantes peut également varier selon le type de NM utilisé. Les impacts de deux types de NM (TiO2-NPs
et NTC) ont été évalués sur des plants de tomate en utilisant des marqueurs morphologiques, biochimiques et la spectroscopie infrarouge par transformée de Fourier (FTIR). Nos résultats ont mis en évidence que même si les deux NM étaient différents pour plusieurs paramètres (forme, taille, chimie de surface), les tomates avaient tendance à présenter une réponse commune avec un fort impact sur les composants des parois cellulaires. Les NTC peuvent également avoir un impact différent selon les espèces végétales considérées. Différentes espèces végétales (tomate, colza, maïs et concombre) ont été exposées à une contamination en NTC mettant en évidence des différences de sensibilité entre les espèces. Le développement du maïs a diminué tandis que pour les autres espèces, le développement a été augmenté pour la plupart. Cependant, les composants des pariétaux ont été modifiés chez les quatre espèces. De nombreux NTC avec des paramètres physico-chimiques différents sont actuellement disponibles sur le marché. Cinq types de NTC variant en diamètre, fonctionnalisation et longueur ont été utilisés pour étudier leur impact sur le colza. Le colza s’est avéré plus sensible aux NTC ayant le plus petit diamètre, mais la fonctionnalisation modulait grandement la réponse de la plante. Enfin, l'influence d'un stress environnemental (stress thermique) sur la toxicité des NTC a été étudiée. Dans les conditions de croissance optimales, le colza n'a montré aucune réponse aux différents NTC en termes de développement des plantes. Cependant, sous l'effet du stress thermique, l'exposition aux NTC a entraîné des différences de croissance significatives selon le type de NTC : les NTC fonctionnalisés ont permis d'atténuer les effets du stress abiotique sur les plantes, tandis que les NTC non fonctionnalisés ont augmenté l'inhibition du développement des plantes. Les plantes étaient donc plus sensibles aux NTC lorsqu'elles étaient soumises à un stress thermique concomitant.
Mots-clés : nanotubes de carbone, détection, réponse des plantes, FTIR, espèces végétales, paramètres physico-chimiques, stress combiné
Merci à Géraldine Sarret et Mathieu Pinault d’avoir accepté de rapporter mon manuscrit de thèse. Merci également aux autres membres du jury : Ana Prada Del Real, Catherine Santaella et Nicolas Gruyer et merci également à Anne Probst d’avoir présidé mon jury de thèse.
Merci ensuite à mes directeurs de thèse (Camille Larue & Emmanuel Flahaut) de m’avoir donné l’opportunité de faire cette thèse. Emmanuel : même si la chimie me faisait peur, je me suis finalement rendue compte que ce n’était pas si horrible que ça ! Merci pour toutes tes explications qui ont su faire comprendre la chimie à une biologiste. Merci d’avoir été disponible malgré ton emploi du temps de ministre et tes congrès aux quatre coins du monde. Camille : déjà mille fois mercis de m’avoir pris pour cette thèse. En trois ans il s’en est passé des choses… J’avoue que je ne sais même pas par où commencer, j’ai trop de merci à te dire ! Je pense que le premier c’est quand même un grand merci pour ta gentillesse. Tu as toujours été présente pour moi à tous les moments de ma thèse même quand j’étais à l’autre bout de l’Atlantique. Merci pour ton enthousiasme et ton optimiste. Tu sais toujours voir le positif partout même dans les manips que je voulais jeter à la poubelle. Et oui évidemment, nos recherches vont sauver le monde et ton prix Nobel arrivera vite !! Je pense qu’en trois ans, la seule fois où je t’ai vu perdre un tout petit peu de ton optimisme, c’était au fin fond de la Serbie après avoir retiré 6000 € et failli louper un avion qui finalement n’a décollé que le lendemain ! Une de tes grandes qualités, c’est aussi d’être à l’écoute et de savoir te remettre en question pour être une très bonne encadrante. Tu as réussi pleinement ton job d’encadrante. Je pense qu’en trois ans tu es devenu plus qu’une directrice, j’ai la chance d’avoir trouvé une amie et je sais que je peux compter sur toi. Je suis ta première thésarde, mais c’est bon maintenant il y a vrai bébé pour me remplacer ! Je vous souhaite beaucoup de bonheur à tous les trois.
Si on retrace mon parcours en recherche, j’ai deux personnes à remercier grandement : ce sont mes deux mentors. Nicolas, j’ai découvert la recherche au Canada à tes côtés. Merci pour tous tes coups de pouce comme la Suède. Tu es un très bel exemple de réussite ! Bertrand, juste un très grand merci : professeur à l’ISA, directeur de master, maitre de stage et surtout ami. Merci pour tout ce que tu as fait pour moi, merci pour la thèse car c’est complétement grâce à toi si j’en suis là aujourd’hui. Merci de m’avoir donné le gout de la recherche. Merci pour toutes ces discussions (alcoolisées ou non) qui m’ont fait beaucoup réfléchir !! Les Lillois, merci pour ce stage avec vous qui m’a fait encore plus apprécier la recherche ! Je vais continuer sur les différents laboratoires. Le CIRIMAT, même si je ne venais pas beaucoup, j’ai toujours été super bien accueillie et j’ai adoré vous parler de mes plantes. C’était super de voir à quel point vous étiez curieux et c’était drôle d’apporter de l’exotisme dans les journées des doctorants ! EcoLab, là où j’ai clairement passé la plupart de mon temps pendant ces trois ans. Un grand merci à Annie et Jérôme, papa et maman du laboratoire, toujours là pour aider et discuter entre deux manips. Jérôme, Macgyver indispensable avec toutes tes idées bricolage ! Annie, je me demande comment le laboratoire va fonctionner sans toi ! Merci à tous les chercheurs pour les discussions sur mes manips de thèse qui m’ont
ends (canoë par exemple !) ont été indispensables à mon épanouissement en thèse. Merci pour tout gros Lolo et je sais que tu seras toujours là pour les pauses bouffe !! Une qui a été très importante pendant cette thèse c’est ma collègue de bureau qui est devenue ma coloc mais surtout une grande amie : ma Pepou. Bon je pourrai en raconter beaucoup mais tu le sais déjà ! En tout cas, merci pour toutes ces soirées, les discussions dans les bons comme dans les mauvais moments. Tu es une fille en or et ne t’inquiètes pas la Nouvelle Calédonie ne sera pas si loin que ça !
Un grand merci à toute ma famille et mes amis qui ont été là pour me soutenir. Mamounette, merci d’être toujours là pour moi et merci pour tous tes colis ! Je ne suis pas morte de faim dans le Sud ! Ma Ion merci de ton soutien, de tes remontages de moral. Qui l’eut cru, on va finir toutes les deux docteurs…
Je ne vais pas citer tout le monde mais un grand merci à tous ceux qui sont venus assister à ma soutenance de thèse. Vous n’imaginez pas à quel point cela m’a fait plaisir de vous voir tous pour cette journée si importante pour moi. J’ai passé un weekend inoubliable entouré des gens que j’aime. Je me suis rendue compte de la chance incroyable que j’avais d’être si bien entourée.
INTRODUCTION (VERSION FRANÇAISE RÉSUMÉE)……….1
1. Les nanotechnologies ... 2
2. Les nanotubes de carbone ... 3
Description ... 3
Synthèse des NTC ... 3
Propriétés et applications des NTC ... 4
3. Ecotoxicologie des NTC ... 5
Dissémination et détection des NTC dans l’environnement ... 5
Impacts des NTC sur les plantes ... 6
4. Présentation de l’étude ... 7
C
HAPTER1:
I
NTRODUCTION... 9
1. Carbon nanotubes: Impacts and behaviour in the terrestrial ecosystem - A review ... 10
1.1. Abstract ... 11
1.2. Introduction ... 12
1.3. Carbon nanotube synthesis, properties and applications ... 15
1.4. Releases and potential exposure pathways ... 17
1.5. Detection and characterization of carbon nanotubes in environmental matrixes ... 18
1.6. Fate and impacts of carbon nanotubes on soil and related organisms ... 20
1.7. Fate and impacts of carbon nanotubes on plants ... 27
1.8. Conclusion ... 42
2. Literature update ... 44
3. Thesis outline... 46
C
HAPTER2:
M
ATERIALS AND METHODS... 49
1. Carbon nanotube preparation... 50
1.1. Catalyst powder synthesis ... 52
1.1.1. Catalyst powder synthesis by citric combustion ... 52
1.1.2. Catalyst powder preparation by impregnation ... 52
1.2.1. DWCNT from methane ... 53
1.2.2. MW13CNT synthesis from ethanol ... 54
1.3. Extraction and washing of CNTs ... 55
1.4. CNT covalent functionalization using nitric acid ... 55
1.5. CNT dispersion in aqueous medium ... 55
1.5.1 Dispersion with ultrasounds ... 55
1.5.2. Non-covalent functionalization using carboxymethylcellulose (CMC)... 56
2. Biological models and exposure conditions ... 58
2.1. Plant species ... 59 2.1.1. Tomato ... 59 2.1.2. Canola ... 60 2.1.3. Cucumber ... 60 2.1.4. Maize ... 61 2.2 Exposure conditions ... 61 2.2.1. Hydroponics ... 62 2.2.2. Soil ... 63
3. CNT characterization and detection ... 65
3.1. Chemical elemental analysis of CNTs ... 67
3.1.1. Organic micro-analysis ... 67
3.1.2. X-Ray Photoelectron Spectroscopy (XPS) ... 67
3.2. BET method ... 68
3.3. Raman spectroscopy analysis ... 68
. Thermogravimetric analysis ... 70
. Laser Doppler electrophoresis (LED) ... 70
. Broadband microwave biosensor ... 71
. Isotopic-ratio mass spectrometry (IRMS) analyses ... 72
. Imaging techniques ... 74
3.8.1. Two-photon excitation (TPE) microscopy imaging ... 74
3.8.2. Autoradiography analysis ... 74
3.8.5. Transmission electron microscopy (TEM) ... 77
3.8.6. Hyperspectral imaging (HSI) ... 78
. Sample preparation for biological tissues ... 79
3.9.1. Sample preparation for TEM and hyperspectral imaging ... 79
3.9.2. Sample preparation for µNRA and µXRF analyses ... 80
3.9.3. Digestion of plant tissues ... 80
4. Methods for the evaluation of CNT toxicity in plants ... 81
. Plant development ... 81
. Plant physiology ... 81
. Plant biomacromolecules with Fourier Transformed InfraRed (FTIR) spectroscopy ... 83
C
HAPTER3:
CNT
CHARACTERIZATION... 87
1. Chemical elemental analysis ... 89
1.1. Bulk analysis ... 89
1.2. Surface atomic composition using X-Ray Photoelectron Spectroscopy (XPS) ... 90
2. CNT morphology ... 92
3. Specific surface area (SSA) ... 97
4. Structural defects and 13C enrichment determination ... 98
5. Thermal stability ... 100
6. Zeta potential ... 101
C
HAPTER4:
D
ETECTION OFCNT
S IN PLANT MATRIX... 104
Article: CNT detection in plant matrix
... 107
1. Introduction ... 108 2. Morphological impacts ... 110 2.1. Effects of DWCNTs ... 110 2.2. Effects of MWCNTs ... 112 2.3. Discussion ... 114 3. CNT detection ... 115 3.1. Raman spectroscopy ... 115
3.1.3. Discussion ... 119
3.2. Transmission electron microscopy ... 120
3.3. Broadband microwave biosensor ... 123
3.4. Two-photon excitation microscopy ... 126
3.5. Hyperspectral imaging ... 129
3.6. Synchrotron micro X-Ray fluorescence ... 130
3.7. Techniques that require enriched CNTs ... 133
3.7.1. Isotopic-Ratio mass spectrometry ... 133
3.7.2. Micro ion beam analysis ... 134
3.7.3. Autoradiography... 137
4. Conclusion ... 139
C
HAPTER5:
A
SSESSING PLANT RESPONSE TO2
NM
S USINGFTIR
SPECTROSCOPY... 142
Article: Fourier Transform InfraRed spectroscopy contribution to disentangle nanomaterial (DWCNT, TiO2) impacts on a crop plant
... 145
1. Introduction ... 146
2. Materials and methods ... 148
2.1. Nanomaterials ... 148
2.2. Soil characteristics and contamination ... 148
2.3. Plant material and cultivation ... 149
2.4. FTIR analysis ... 149
2.5. Chemometric analysis for FTIR data ... 149
2.6. Statistical analysis ... 150 3. Results ... 151 3.1. Morphological responses ... 151 3.2. FTIR analysis ... 153 4. Discussion ... 156 5. Conclusion ... 158
walled carbon nanotube contamination in soil
... 163
1. Introduction ... 164
2. Material and methods ... 165
2.1. DWCNT preparation and characterization ... 165
2.2. Soil characteristics and contamination ... 166
2.3. Plant material and cultivation ... 166
2.4. Biochemical analyses ... 167
2.5. FTIR measurements and chemometric analysis ... 167
2.6. Statistical analysis ... 168
3. Results ... 169
3.1. DWCNT characterization ... 169
3.2. Impacts of DWCNTs on plant morphological response ... 170
3.3. Impacts of DWCNTs on plant biochemical responses ... 175
3.4. Impacts of DWCNTs on the plant biomacromolecules ... 177
4. Discussion ... 179
5. Conclusion ... 181
C
HAPTER7:
E
VALUATION OF THE INFLUENCE OF THE PHYSICOCHEMICAL PARAMETERS OFCNT
S ON PLANT RESPONSE UNDER OPTIMAL CONDITIONS AND HEAT STRESS... 183
Article: Influence of the physicochemical parameters of CNTs on their impacts on canola plant under optimal and abiotic stress conditions
... 186
1. Introduction ... 187
2. Materials and methods ... 188
2.1. Nanomaterials ... 188
2.2. Soil characteristics and contamination ... 188
2.3. Plant material and cultivation ... 189
2.4. Biochemical response analysis ... 189
2.5. Nutrient concentration analyses ... 189
2.6. Statistical analysis ... 189
3.2. Stress effects on plant growth... 192
3.3. CNT impacts in optimal growth conditions ... 194
3.4. CNT impacts combined with heat stress ... 195
4. Discussion ... 201
5. Conclusion ... 205
C
HAPTER8:
C
ONCLUSION&
PERSPECTIVES... 207
1. Scientific conclusion ... 208
1.1. Influence of different parameters on plant response to CNT exposure ... 208
1.1.1. Influence of the plant species ... 208
1.1.2. Plant response to different types of NMs ... 209
1.1.3. Influence of CNT physico-chemical properties ... 209
1.1.4. Influence of CNT dispersion in the exposure medium ... 211
1.1.5. Influence of an environmental stress ... 211
1.2. Techniques used for CNT detection, characterization and plant response evaluation ... 212
1.3. General perspectives ... 213
2. Side activities during the PhD thesis ... 216
C
ONCLUSION&
PERSPECTIVES(
FRANÇAIS) ... 219
1. L’influence de la réponse des plantes à l’exposition aux NTC... 220
1.1. La réponse des plantes à différents types de NM ... 220
1.2. Influence des espèces de plantes ... 220
1.3. Influence des propriétés physicochimiques ... 221
1.4. Influence d’un stress environnemental ... 222
1.5. Influence de la suspension de NTC ... 222
2. Techniques utilisées pour la détection, la caractérisation des NTC et l’évaluation de la réponse des plantes ... 223
3. Perspectives générales ... 224
INTRODUCTION
(Version française résumée)Figure 1 Évolution du pourcentage d'atomes en surface des particules en fonction de leur diamètre en nanomètres. La barre rouge représente le seuil expérimental en dessous duquel les propriétés exceptionnelles des nanoparticules apparaissent (Auffan et al., 2009). ... 2 Figure 2 Représentation d'un NTC mono paroi. ... 3
C
HAPTER1:
I
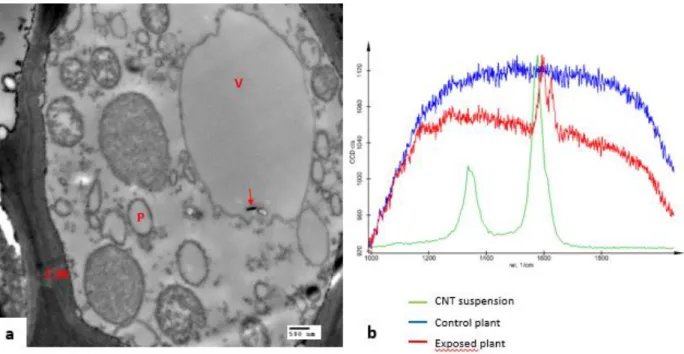
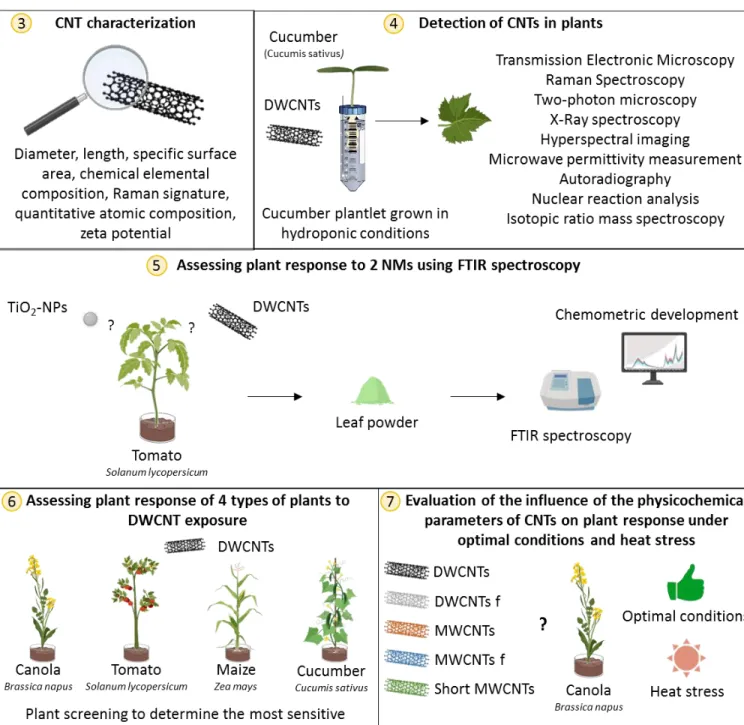
NTRODUCTIONFigure 3 Literature review of CNT impacts and behaviour on plants (culture conditions and plant stage exposure). Seedling represents plant after germination but still growing. Adult plants are plant which they reach adult height. ... 14 Figure 4 TEM image of MWCNTs in wheat’s roots; roots of wheat (Triticum aestivum) exposed to 100 mg/L of MWCNTs dispersed in gallic acid for 7 days; CNT is indicated by arrow; (C.W) cell wall; (P) plaste; (V) vacuole. b. Raman spectra of the CNT suspension, the control plant and the same exposed plant as the TEM image. ... 19 Figure 5 Uptake and distribution of carbon nanotubes in plants. CNTs have been enlarged for better visibility. In the cell, in light blue: vacuole, in green: chloroplasts, in purple: nucleus with the grainy endoplasmic reticulum, in orange: smooth endoplasmic reticulum, and in dark blue the plasmode (for colors: referred to the online version). ... 28 Figure 6 Root length of wheat (Triticum aestivum) exposed in hydroponics to different types of CNTs (DWCNTs non-functionalized (DWCNTs nf), DWCNTs functionalized (DWCNTs f) and MWCNTs (Larue et al. unpublished data). Stars indicate significant difference (p<0.05). ... 30 Figure 7 Graphical scheme of the different parts of my PhD project with the corresponding chapter in yellow circles: (3) CNT characterization, (4) Detection of CNTs in plants, (5) Assessing plant response to 2 NMs using FTIR spectroscopy, (6) Assessing plant response of 4 types of plants to DWCNTs and (7) Evaluation of the influence of the physicochemical parameters of CNTs on plant response under optimal conditions or heat stress. ... 47
C
HAPTER2:
M
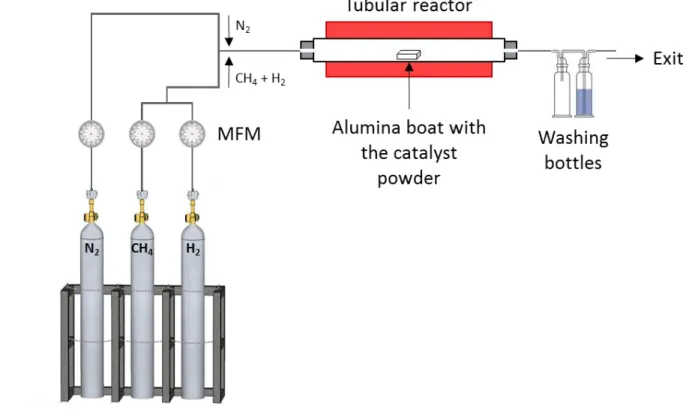
ATERIALS AND METHODSFigure 8 Graphical scheme of the CNT synthesis and functionalization made at the CIRIMAT. Yellow circles relate to the corresponding paragraphs of the chapter 2. ... 51 Figure 9 Diagram of the experimental setup used for the synthesis of DWCNT by CCVD from CH4. An
alumina boat with the catalyst powder was introduced in a tubular reactor fed with nitrogen (N2) or
methane and dihydrogen (CH4 + H2). Gas flows were regulated using mass flowmeters (MFM). A washing
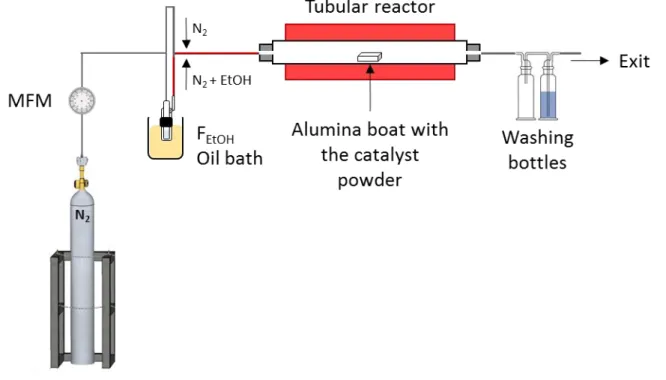
bottle was placed at the exit in order to monitor the gas flow and another to avoid the backflow in the tubular reactor. ... 53 Figure 10 Diagram of the experimental setup used for the synthesis of MW13CNT by CCVD using EtOH. An
alumina boat with the catalyst powder was introduced in a tubular reactor fed with nitrogen (N2) or N2 +
bottle was placed at the exit in order to monitor the gas flow and another to avoid any backflow in the
tubular reactor. ... 54
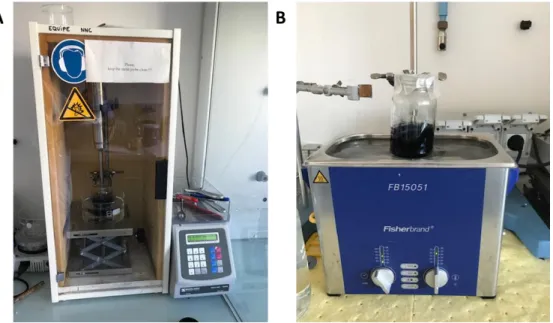
Figure 11 A. The ultrasonic probe with the generator, the soundproof box, the microprobe and the crystallizer with ice. B. The ultrasonic bath. ... 56
Figure 12 Effect of CMC on DWCNT suspension stability. A. 100 mg.L-1 DWCNT suspension without dispersant just after preparation. B. 100 mg.L-1 DWCNT suspension without dispersant 24h after preparation. C. 100 mg.L-1 DWCNT suspension with CMC (100 mg.L-1) just after preparation. D. 100 mg.L-1 DWCNT suspension with CMC (100 mg.L-1) after 24h. ... 57
Figure 13 Graphical scheme of the plant species used and the two exposure conditions. Yellow circles relate to the corresponding part of the Chapter 2... 58
Figure 14 Botanical drawing of tomato plant (Solanum lycopersicum) (Magnan, Lytchiz’ blog) ... 59
Figure 15 Botanical drawing of canola (Brassica napus) (Müller, 1887). ... 60
Figure 16 Botanical drawing of cucumber (Cucumis sativus) (Blanco, 2008) ... 60
Figure 17 Botanical drawing of maize (Zea mays). ... 61
Figure 18 Experimental design for cucumber exposure in hydroponics. ... 62
Figure 19 Contamination of the soil with CNTs in a tray. ... 64
Figure 20 Typical Raman signature of carbon nanotubes (DWCNTs) with the different characteristics bands (RBM, D, G and G’)... 69
Figure 21 Concept of the broadband microwave biosensor developed by MH2F LAAS-CNRS. RF = Radio Frequency, EM = Electromagnetic. From Grenier et al., 2010. ... 72
Figure 22 Bohr atom model illustrating the basic principle of X-Ray fluorescence. A. X-ray excitation leads to the ejection of a core-shell electron from the atom. B. The generated vacancy is filled up by a higher-shell electron, a process that results in the emission of a photon whose energy is equal to the difference in binding energies of the two shelves involved in the transition. From Fahrni et al., 2007. ... 75
Figure 23 Scheme of a Transmission Electronic Microscope (TEM) ... 77
Figure 24 A. Fragment of the plant tissue in an Eppendorf tube with OCT resin. B. Cryo-microtome used at EcoLab. C. Orientation of the sample during cutting. ... 80
Figure 25 Graphical scheme of the different methods used for the evaluation of CNT toxicity in plants. Yellow circles relate to the corresponding parts of the Chapter 2. ... 81
Figure 26 Scheme of a FTIR spectrometer. B. Schematic representation of the three main sampling modes for FTIR spectroscopy. Both images are from Baker et al., 2014. ... 83
Figure 27 Typical biological spectrum showing the main biomolecular peaks from 3,000 to 800 cm-1, where ѵ = stretching vibrations, δ = bending vibrations, s = symmetric vibrations and as = asymmetric vibrations. Image from Baker et al., 2014. ... 84
CHAPTER 3: CNT CHARACTERIZATION
Figure 28 TEM pictures of the different CNTs. A and B for DWCNTs, C and D for DWCNTs f, E and F for MWCNTs, G and H for MWCNTs f, I and J for short MWCNTs and K and L for MW13CNTs ... 92nanometers of the six used CNTs (DWCNTs (A), functionalized DWCNTs (B), MWCNTs from Cheaptubes (C), functionalized MWCNTs from Cheaptubes (D), short MWCNTs from Nanografi (E) and MW13CNTs from
CIRIMAT (F)). ... 94 Figure 30 Distribution diagram of the length for the MWCNTs shorts. ... 95 Figure 31 TEM pictures of the MWCNTs before (A and C) and after the suspension preparation (B and D). ... 96 Figure 32 Raman spectra of the different CNT used (DWCNTs, MWCNTs, short MWCNTs, MWCNTs 12C,
MWCNTs 2% 13C and MWCNTs 50% 13C) between 50 and 3,000 cm-1. ... 98
Figure 33 Thermograms of the different CNTs showing the mass variation ∆m (%) and the derivative mass dTG (%/min). ... 100
CHAPTER 4: CNT DETECTION IN PLANT MATRIX
Figure 34 Graphical scheme resuming the experiments done for the CNT detection ... 106 Figure 35 Literature review (33 publications from 2008 to 2018) of the different techniques used to detect CNTs in plants (A) and the different studied plant organs (B). TEM = transmission electronic microscopy, SEM = scanning electron microscopy, MIH = microwave induced heating, IR = infrared spectroscopy, FTIR = Fourier transformed infrared spectroscopy. ... 109 Figure 36 Morphological parameters (height, root size, fresh and dry biomass (leaves, roots and total), water content and ratio roots/leaves) of the control cucumber plants and the cucumber plants grown in the DWCNT suspension at 100 mg/L during 15 days. Results were the average of 6 experiments (with 3 replicates per condition, per experiment i.e. 18 biological replicates). No significant difference was found, student test, p-value < 0.05. ... 111 Figure 37 Morphological parameters (height, root size, fresh and dry biomasses (leaves, roots and total), water content and ratio roots/leaves) of the control cucumber plants and the cucumber plants grown in MW13CNT suspension at 100 mg/L during 15 days. Results are an average of 3 experiments with 3
replicates per condition for each experiment. No significant difference was found, student test, p-value < 0.05. ... 112 Figure 38 Pictures of the oldest cucumber leaf of the control plants (A and B) and the plants exposed to MW13CNTs at 100 mg/L during 15 days (C and D). ... 113
Figure 39 Leaf area of the oldest (F1) and the youngest (F2) leaves as well as the total leaf area of control plants and plants exposed to MW13CNTs at 100 mg/L during 15 days. No significant difference was found,
student test, p-value < 0.05. ... 114 Figure 40 Raman spectra of the DWCNT suspension and the entire leaf with the same suspension of DWCNTs using the 633 and the 1064 nm laser. (A) With the laser 633 nm: acquisition time 2 sec, 3 acquisitions; with the laser 1064 nm: acquisition time 20 sec, 3 acquisitions. For both no baseline correction. (B) For both spectra: acquisition time 2 sec, 3 acquisitions, and no baseline correction. (C) Acquisition time 60 sec, 3 acquisitions, baseline correction. ... 117
control digested leaves and CNT-spiked digested leaves (B) both using 633 nm laser. For all the spectra: 60 sec of acquisition time, 3 acquisitions, baseline correction. ... 118 Figure 42 (A) Raman mapping (selected range between 1200 and 1700 cm-1 corresponding to the two more
intense Raman bands of DWCNTs) and (B) the corresponding picture with optical microscope (dark spots are the CNTs). ... 119 Figure 43 A. High magnification of root cells of Lotus japonicus treated with MWCNTs (diameter 8-15 nm and length 5-50 µm) (Yuan et al., 2017). B. High magnification of Triticum aestivum leaves exposed to MWCNTs (mean diameter 41.2 nm and length 1-10 µm) (Larue et al., 2012). C. High magnification of
Catharanthus.roseus protoplasts incubated with MWCNTs (diameter 20-30 nm and length 0.5-2 µm)
(Serag et al., 2011). Red arrows indicate CNTs, green arrows indicate cell wall. ... 121 Figure 44 High magnification of root cross sections of cucumber grown in DWCNT suspension (100 mg/L for 15 days). A. focused picture. B. Defocused picture showing the CNTs. ... 121 Figure 45 High magnification of root sections of cucumber grown in DWCNT suspension (100 mg/L) for 15 days. Red arrows are pointing to potential CNT agglomerates. ... 122 Figure 46 A. High magnification TEM image of tobacco cells exposed to MWCNTs (Khodakovskaya et al., 2012). B. High magnification TEM image of tomato seeds exposed to MWCNTs (Lahiani et al., 2017). C and D. High magnification TEM images of soybean seeds exposed to MWCNTs (Lahiani et al., 2013). Black arrows are showing potential CNTs. ... 122 Figure 47 High resolution picture of DWCNTs. ... 123 Figure 48 Permittivity (real and imaginary parts) at 0.2 GHz of the plant growth medium and the medium spiked with DWCNTs (100 mg/L) at different measurement times (0, 2, 4 and 6 min). ... 124 Figure 49 Contrast of the real part Ɛ’ (A) and imaginary part Ɛ’’ (B) of the permittivity of the DWCNTs in the medium as a function of the EM wave frequency between 0.2 and 20 GHz. ... 125 Figure 50 Contrast of the permittivity (real and imaginary parts) at 0.2 GHz of the digested control plants and plants grown in the DWCNT suspension at 100 mg/L during 15 days. Measurement time = 6 min. 126 Figure 51 (A) Optical image of the DWCNTs. (B) Corresponding 2D tomographic image with the two-photon excitation microscopy of the DWCNTs. Excitation at 880 nm and emission range between 500 and 600 nm. DWCNTs are in blue (false color). ... 127 Figure 52 Tomographic 3D images of (A) a control root and (B) a control leaf with the two-photon excitation microscopy. Excitation at 720 nm. Green color is representing the plant cell wall and cytoplasm. Orange color is attributed to chloroplasts. ... 127 Figure 53 Two photon excitation microscopy observation of cucumber roots spiked with the DWCNTs. Excitation at 880 nm and emission range between 500 and 600 nm. DWCNTs are in blue (false color). Optical image in the background. ... 128 Figure 54 Two photon excitation microscopy observation of control digested cucumber leaves (A) and control digested leaves spiked with DWCNTs (25 mg of DWCNTs/kg of dry plant weight (B). Excitation at
the background. ... 128 Figure 55 (A) Hyperspectral imaging of cucumber leaves exposed for 15 days to 100 mg/L DWCNT with (B) the spectral profile corresponding to the red square in A and (C) the zoom with in red the pixel identified as CNT based on the spectral region between 550 and 650 nm. ... 130 Figure 56 µX-Ray maps of leaf trichomes of control plant (A) and plant exposed to 100 mg/L of DWCNTs during 15 days (B) with the corresponding XRF spectra and fits without Co (C and D) or with Co (E and F). Co emission energy is at 6.9 keV. ... 132 Figure 57 Graphical representation of the mean (± standard deviation) δ13C obtained after analysis of
cotyledons and leaves of control plants and plants grown in 2 wt. % DW13CNT suspension (100 mg/L) for
15 days. ... 134 Figure 58 NRA spectrum of the leaf cross section of the plant exposed to MW13CNTs at 100 mg/L during
15 days. 12C and 13C from the leaf section and from the polycarbonate film were identified as well as other
light elements. ... 135 Figure 59 Pictures (A and C) and autoradiography pictures corresponding (B and D) of two cucumber plants grown with DW14CNTs at 100 mg.L-1 during 15 days. ... 138
C
HAPTER5:
A
SSESSING PLANT RESPONSE TO TWO DIFFERENTNM
SFigure 60 Summary of the experimental design to disentangle impacts of TiO2-NPs and CNTs on tomato
plants using FTIR ... 144 Figure 61 TEM pictures of TiO2-NPs (A) (Vijayaraj et al., 2018) and DWCNTs (B) ... 148 Figure 62 Results of the morphological parameters (plant height (A), leaf number (B), leaf surface area (C) and total fresh biomass (D)) after tomato exposure ( for 5, 10, 15 or 20 days) to TiO2-NPs and CNTs at 100
or 500 mg/kg. For each graph, statistical analyses were done separately for each exposure durations. Different letters imply statistical differences (p<0.05). ... 151 Figure 63 PCA on the morphological parameters of tomato plants (plant height, number of leaves, leaf area and total biomass) for the four exposure durations (5, 10, 15 and 20 days) and the different exposure conditions (Control, CNT 100, CNT 500, TiO2 100 and TiO2 500). Bigger symbols are the barycenters of
ellipses. ... 152 Figure 64 PC-LDA of the FTIR spectra (between 800-1800 and 2700-2900 cm-1) acquired on tomato leaves
for the four exposure durations (5, 10, 15 and 20 days) with the different exposure conditions (Control, CNT 100, CNT 500, TiO2 100 and TiO2 500). PC-LDA were run with Orange software and drawn with RStudio
(ggplot2). ... 153 Figure 65 Normalized FTIR spectra for tomato plants exposed for 15 days to TiO2 or CNT at 100 or 500
mg.kg-1. Peaks contributing the most to differences among are highlighted in yellow. Peak A = 2848-2852
cm-1, lipid region. Peak B = 1537-1550 cm-1, amide II region. Peak C = 1312-1320 cm-1, carboxyl region. Peak
D = 1155-1160 cm-1, polysaccharide region (cellulosic compounds). Peak E = 1070-1082 cm-1,
polysaccharide region (hemicellulose compounds). Peak F = 990-1052 cm-1, pectin and various
Figure 66 Summary of the experimental design used to assess the impacts of DWCNTs on four different plant species. ... 162 Figure 67 DWCNT characterization (A) TEM image of the purified DWCNTs. (B) Raman scattering spectrum obtained using a 633 nm wavelength laser. (C) The weight loss profile obtained from TGA analysis. (D) Table summarizing the physicochemical characteristics (TW = triple walled, DW = double walled, SW = single walled). ... 169 Figure 68 Leaf number during the experiment from day 1 to day 35 for the four plant species (cucumber, canola, maize and tomato) grown in a silty sand soil without (control) or with DWCNTs (CNT) at 100 mg/kg of dry soil. Significant differences are labeled with a star * (student test, p-value < 0.05). ... 171 Figure 69 Plant height from day 14 to day 35 of the experiment for the four plant species (A cucumber, B canola, C maize and D tomato) grown in a silty sand soil without (control) or with DWCNTs (CNT) at 100 mg/kg of dry soil. Significant differences are labeled with a star * (student test, p-value < 0.05)... 172 Figure 70 Results of the morphological analyses for the four studied plants (canola, cucumber, maize and tomato) grown in a silty sand soil without (Control) and with DWCNTs (CNTs) at 100 mg/kg of dry soil. A germination rate, B number of leaf, C height of the plant, D leaf fresh biomass, E root fresh biomass, F total fresh biomass, G root dry biomass, H leaf area and I leaf area per leaf. Significant differences are labeled with a star * (Kruskal-Wallis test for non-parametric data and one-way ANOVA for parametric data, p-value < 0.05). ... 174 Figure 71 Results of the biochemical analyses for the four studied plants (canola, cucumber, maize and tomato) grown in a silty sand soil without (Control) and with DWCNTs (CNTs) at 100 mg/kg of dry soil: total chlorophyll concentration (A), flavonoid concentration (B), and total phenolic compound concentration (C). Significant differences (p<0.05) are labeled with a star * (Kruskal-Wallis test for non-parametric data and one-way ANOVA for parametric data, p-value < 0.05). ... 175 Figure 72 PCA of morphological (germination rate, number of leaves, height of the plant, fresh and dry biomasses, leaf area) and biochemical parameters (total chlorophyll, flavonoid and phenolic compound concentration) for the four types of plants (canola, cucumber, maize and tomato) grown in a silty sand soil without (Control) and with DWCNTs (CNTs) at 100 mg/kg of dry soil. PCA were run and drawn with RStudio (FactoMineR and ggplot2). Bigger points are the barycenter of ellipses. ... 176 Figure 73 PCA of the FTIR spectra (between 800-1800 and 2700-2900 cm-1) for the four types of plants
(canola, cucumber, maize and tomato) with the different conditions (Control and CNTs). PCA were run with Orange software and draw with RStudio (ggplot2). ... 177 Figure 74 Normalized FTIR spectra for the four types of plants (canola, cucumber, maize and tomato) with the two conditions (Control and CNTs). Peaks contributing the most among the different groups are highlighted in yellow. ... 178
UNDER OPTIMAL CONDITIONS AND HEAT STRESS
Figure 75 Summary of the experimental design used to assess the impacts of 5 different types of CNTs under optimal and heat stress conditions... 185 Figure 76 PCA of the different morphological and biochemical parameters (germination, number of leaves, height, leaf area, leaf area per leaf, dry and fresh biomass, SLA and total chlorophylls) of the canola plants grew with or without the different CNTs (DWCNTs, DWCNTs f, MWCNTs, MWCNTs f, short MWCNTs) at three concentrations (0.1, 10 and 100 mg/kg-1) in a fine sandy loam soil during 5 weeks. ... 194
Figure 77 Germination rate of the control plants and plants grown in contaminated soil during five weeks with the five CNTs at the three different concentrations. Kruskal Wallis tests were used for non-parametric data. Different lowercase letters indicate significant differences (p-value < 0.05). ... 195 Figure 78 Morphological parameters (height, number of leaves, leaf area, leaf area per leaf, SLA and water content) of the control plants and the plants grown in soil contaminated with the different CNTs at three concentrations (0.1, 10 and 100 mg/kg). Letters indicate the differences. ... 197 Figure 79 Fresh (A) and dry biomass (B) for leaves and roots of the control plants and the plants grown in soil contaminated with the different CNTs at three concentrations (0.1, 10 and 100 mg/kg). Letters indicate the differences. ... 198 Figure 80 Biochemical parameters: A. Chlorophyll a, B. chlorophyll b, C. total chlorophylls, D. carotenoids and E. lipid peroxidation of control plants and plants grown in soil contaminated with the different CNTs at three concentrations (0.1, 10 and 100 mg/kg). Different letters indicate significant differences (p<0.05). Data are mean ± standard error, n = 5). ... 199 Figure 81 PCA of the nutrient contents (B, Ca, Cu, K, Cd, Mn, Mg, Na, P, Si, S and Ti) in leaves and roots of the canola plants grown with or without the different CNTs (DWCNTs, DWCNTs f, MWCNTs, MWCNTs f, short MWCNTs) at 3 concentrations (0.1, 10 and 100 mg.kg-1) in a fine loamy soil during 5 weeks. ... 200
CHAPTER 8: C
ONCLUSION&
PERSPECTIVESFigure 82 Summary of the different experiments realized during this PhD word with the CNT characterization, the CNT detection and a summary of the different tested parameters than can influence the plant response to CNT contamination. ... 215
CHAPTER 1: INTRODUCTION
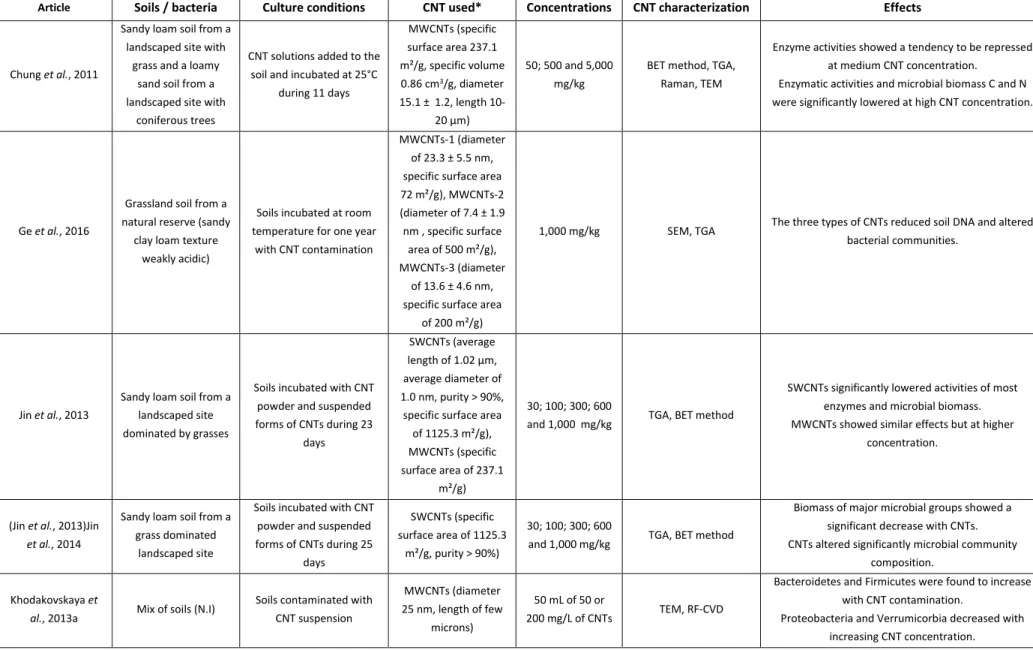
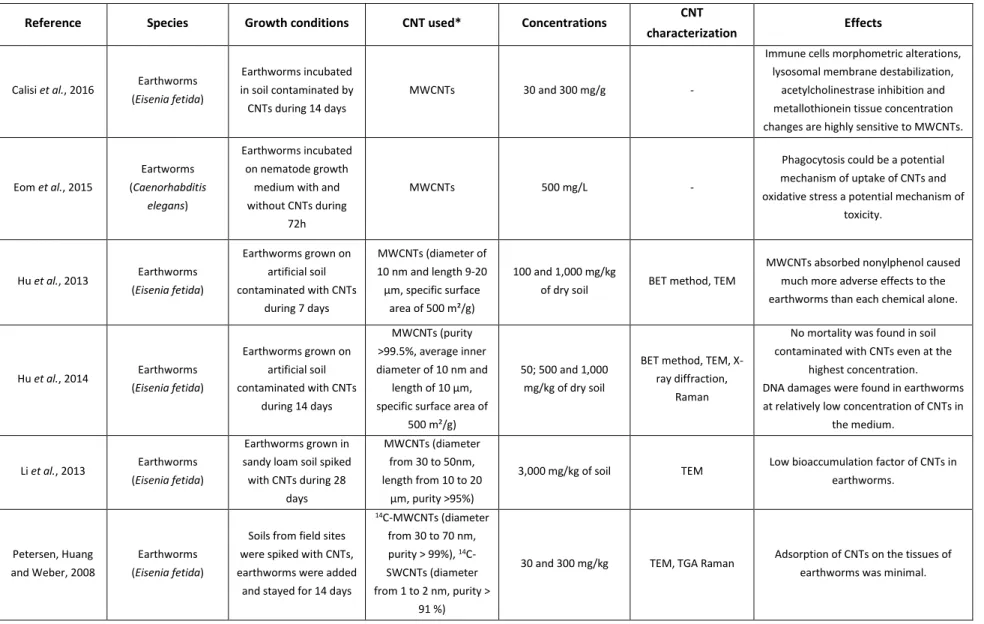
Table 1 Studies on CNT impacts and behavior on soil microorganisms ... 23 Table 2 Studies on CNT impacts and behavior on soil macroorganisms ... 25 Table 3 Studies on CNT impacts and behavior on plants ... 31
CHAPTER 2: MATERIALS AND METHODS
Table 4 Soil characteristics for the LUFA soil 2.1 and the agricultural soil used at the CAES (CAES soil). ND = non determined. ... 63 Table 5 Analyses used for CNT characterization and detection in biological matrices with the type of equipment or the method, the purpose, the analysis mode (bulk or for imaging), the location of the analysis and the analyst. NP = information Non Provided ... 65 Table 6 Technical parameters used for the FTIR spectroscopy analysis at ESRF. ... 85
CHAPTER 3: CNT CHARACTERIZATION
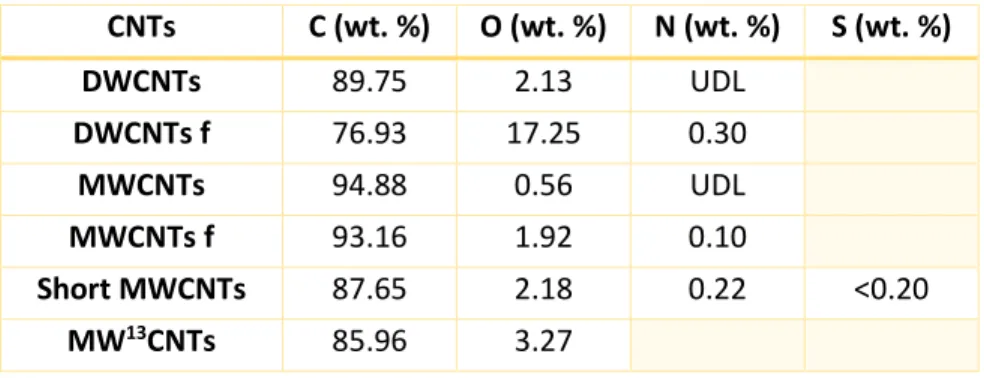
Table 7 Summary of the physicochemical characteristics of the different CNTs using TEM, micro-analyzers, ICP-AES, BET method, Raman analysis, TGA and zeta potential analysis. * Median from Flahaut et al., 2003. ** data from providers ... 88 Table 8 Elemental analysis (C, O, N and S) of the five CNT samples used (in wt. %). For orange boxes, analysis was not done because those elements were not expected. UDL = under detection limit. ... 89 Table 9 Elementary metal analysis (Co, Mo, Fe and Ni contents) of the five CNT samples used (in wt. %). For the green boxes, elements were not quantified. Quantification was done only on elements that were expected according to the catalyst used. ... 90 Table 10 XPS results for the different CNTs with the peak energy of the different elements (C, O, Co, Cl and Mo), the area under the peak, the atomic percentage, the mass percentage corresponding and the mass percentage from the chemical elemental analysis. ... 91 Table 11 Specific Surface Area (SSA) in m²/g of the five CNT samples used. ... 97 Table 12 Raman shift of the D and G bands with the ratio between the intensities of the D and G bands (Ig/Ig). Values are mean of 10 spectra. ... 98 Table 13 Comparison of the thermogravimetric results of the different CNTs with the final mass loss (%) and the temperature mass loss (°C). ... 101 Table 14 Zeta potential values in mV in DI water, in Hoagland medium containing 100 mg/L of CMC and in a LUFA soil solution ... 102
C
HAPTER4:
CNT
DETECTION IN PLANT MATRIXTable 15 Counting based on the NRA analysis of 13C corresponding to the polycarbonate film and to the
Table 16 Most relevant peaks extracted from the logistic regression for 15 days of exposure with the band letter corresponding to the figure 4, the band assignment and the main compounds that can be found with the cited references. ... 155 Table 17 Area under the peak of the 6 peaks contributing the most to differences among plants exposed to the 5 conditions: control, CNT 100, CNT 500, TiO2 100 and TiO2 500 after 15 days of exposure. Area
under the peak was calculated using Orange software by integrating the different peak from O. ... 156
CHAPTER 6: ASSESSING PLANT RESPONSE OF 4 TYPES OF PLANTS TO DWCNT EXPOSURE
Table 18 Most relevant peaks extracted from the logistic regression for the four types of plants with the band letter corresponding to the figure 74, the area under the peak, the band assignment and the main compounds that can be identified with the cited references. ... 179
CHAPTER 7: E
VALUATION OF THE INFLUENCE OF THE PHYSICOCHEMICAL PARAMETERS OFCNT
S ON PLANT RESPONSE UNDER OPTIMAL CONDITIONS AND HEAT STRESSTable 19 Characteristics of the different CNTs used. *Information provided by Flahaut et al (2003) ** Information provided by Cheaptubes© *** Information provided by Nanografi© (letters) statistical analysis using Kruskal Wallis (p-value < 0.05) and ND = non-determined. Different techniques were used: TEM for diameters and length, BET method for SSA measurement, organic micro-analyzers for elemental analysis (CNOS), ICP-AES for metal analysis, the ID/IG ratio with Raman spectroscopy and the zeta potential
with a zetasizer. ... 191 Table 20 Morphological parameters of the control canola plant in the two experiments (with and without stress) with the differences in percent. * indicates statistical differences (p-value < 0.05). SLA = specific leaf area ... 193 Table 21 Conditions expressed in other metrics than mass concentrations (mg/kg): surface concentration (m²/kg), elemental concentrations (mg/kg) for C, O, N, Co, Mo, Fe and Ni. NM = element not measured. ... 204
1
2
1. L
ES NANOTECHNOLOGIES
Afin de répondre au développement et à l’augmentation de la population, notre société moderne est en constante évolution avec pour objectif l’amélioration des connaissances et des méthodes dans de nombreux domaines. Dans ce but, les industries et la science se tournent de plus en plus vers les nanotechnologies (Das et al, 2015). Un nanomatériau (NM) est défini comme étant un matériau naturel, formé accidentellement ou manufacturé contenant des particules libres, sous forme d’agrégat ou sous forme d’agglomérat, dont au moins 50 % des particules, dans la distribution en nombre par taille, présentent une ou plusieurs dimensions externes se situant entre 1 et 100 nm (European Commision, 2011). Le secteur des NM est en pleine expansion depuis quelques années. Le nombre de produits de la vie quotidienne contenant des NM a augmenté passant de 54 en 2005 à plus de 3000 en 2019 (Danish Consumer Council, The Ecological council, 2019). Au-delà de leur taille nanométrique, la caractéristique la plus importante des NM est leur rapport surface/volume très important. En effet, plus la taille du matériau est faible, plus le pourcentage d’atomes en surface augmente (Figure 1).
Cette forte augmentation d’atomes en surface rend les matériaux beaucoup plus réactifs et leur confère des propriétés nouvelles, ou accentue celles déjà existantes. Les propriétés des NM peuvent être très variées. On peut ainsi trouver des NM très résistants mécaniquement, très conducteurs (électricité, chaleur) ou encore agissant comme des catalyseurs très performants. Ces propriétés particulières offrent de nouvelles possibilités dans de très nombreux domaines d'applications. On les retrouve par exemple en agroalimentaire, en électronique, dans des articles de sport ou encore dans le médical. L’agriculture porte également une attention grandissante aux NM. Ils pourraient être utilisés pour l’optimisation des engrais
Figure 1 Évolution du pourcentage d'atomes en surface des particules en fonction de leur diamètre en nanomètres. La barre rouge représente le seuil expérimental en dessous duquel les propriétés exceptionnelles
des nanoparticules apparaissent (Auffan et al., 2009).
Po u rce n tag e d ’ato me s en s u rfac e
3
et des produits phytosanitaires (Iavicoli et al., 2017). Les NM les plus utilisés sont les ceux à base d'oxyde de métaux ou de métaux (argent, dioxyde de titane) ainsi que les NM carbonés (Vance et al., 2015). Parmi ces derniers, les nanotubes de carbone (NTC) constituent une des classes les plus importantes au niveau de leurs potentiels applicatifs. Ils sont aussi les seuls à permettre la combinaison de plusieurs propriétés physiques telles par exemple une résistance mécanique exceptionnelle et une bonne conductivité électrique.
2. L
ES NANOTUBES DE CARBONE
Description
Les NTC sont décrits comme des feuillets de graphène enroulés sur eux-mêmes pour former des tubes (Figure 2). Il existe une multitude de NTC différents. Ils peuvent varier selon plusieurs paramètres physicochimiques. Ils ont une longueur souvent comprise entre 1 et 100 µm. Ils peuvent présenter un nombre de parois différent, on trouve ainsi trois types de NTC : les NTC mono paroi (un seul feuillet de graphène), les NTC double parois (deux tubes de graphène concentriques) et les NTC multi parois (plus de 2 tubes de graphène concentriques). Ils présentent un diamètre pouvant varier de moins de 1 nm pour les mono parois jusqu’à plusieurs dizaines de nm pour les multi parois. Il est également possible de fonctionnaliser les NTC (greffage de groupements chimiques sur la face extérieure du tube externe), ce qui va modifier leurs propriétés de surface. Hydrophobes par nature, la fonctionnalisation peut ainsi leur conférer un caractère plus hydrophile (dans le cas du greffage de fonctions oxygénées par exemple), ce qui permet, entre autres, de les utiliser plus facilement en suspension et d'améliorer leur dispersion dans une matrice.
Synthèse des NTC
Des techniques de préparation à très hautes températures (pouvant atteindre jusqu’à 6000°C) ont tout d’abord été utilisées comme l’ablation laser et l'arc électrique (Prasek et al., 2011). Ces méthodes ont progressivement été remplacées par une technique plus "basses températures" de dépôt chimique catalytique en phase vapeur (Chemical Vapor Deposition, CVD) (Laurent et al., 1998). Avec cette dernière, l’orientation, l’alignement, la longueur, la pureté et la densité des tubes peuvent être modulés. La technique CVD est expliqué dans le chapitre 2 matériels et méthodes (1.2).
4
Propriétés et applications des NTC
Grâce à leur structure unique, les NTC possèdent des propriétés optiques, électriques, thermiques, mécaniques et chimiques remarquables. D’un point de vue mécanique, ils sont extraordinairement flexibles malgré leur forte rigidité. Les NTC sont également extrêmement résistants : ils sont 100 fois plus résistants mais 6 fois plus légers que l’acier (Chang and Liu, 2010). Ils possèdent des propriétés électriques intéressantes : selon leur structure, ils peuvent se comporter comme des semi-conducteurs ou des métaux. Grâce à leurs propriétés électroniques et leur bonne stabilité à hautes températures, les NTC peuvent supporter de très fortes densités de courant (Yao et al., 2000). Concernant les propriétés thermiques, la faible proportion de défauts structuraux et leur géométrie cylindrique leurs permettent d’avoir une forte conductivité thermique le long de l’axe des tubes (Berber et al., 2000).
Du fait de ces propriétés, le nombre d’applications ne cesse de croitre ; le marché pourrait ainsi dépasser les 8 milliards de dollars américains d’ici 2024 (Global market Insights, 2017). Ils sont employés dans de nombreux secteurs d’applications tels que l’énergie, les matériaux composites ou encore l’électronique (Terrones, 2004). Ils peuvent ainsi être utilisés dans les batteries des équipements mobiles afin d’améliorer le stockage de l’énergie (Zhai et al., 2016). On peut également les retrouver dans la composition des écrans plats afin de permettre une plus faible consommation électrique (Terrones, 2004). Ils sont envisagés pour la réalisation d'écrans flexibles dans lesquels ils remplacent avantageusement le matériau conducteur transparent actuel (Indium Tin Oxide), trop fragile. Ils sont utilisés dans les équipements sportifs comme les raquettes de tennis, les cadres de vélos ou encore les clubs de golf afin de les rendre plus légers tout en étant très résistants. Ils sont aussi dans certains vêtements les rendant plus imperméables et résistants (Vance et al., 2015) tout en leur conférant des nouvelles propriétés (monitoring médical par exemple). Les NTC apparaissent également comme étant une nouvelle opportunité pour les applications biomédicales : même si les premières applications envisagées telles que le transport de molécules thérapeutiques (Bianco
et al., 2005) ne sont plus d'actualité (toxicité potentielle), d'autres pour combattre le cancer en limitant la
propagation des cellules cancéreuses grâce à leur potentiel redox (Fiorito et al., 2014; García-Hevia et al., 2015) sont toujours en développement. L’agriculture est également un secteur où l’on pourrait utiliser les NTC. En effet, certaines études ont montré qu’ils étaient capables de stimuler la croissance des plantes (Liné et al., 2017). Ils pourraient donc être utilisées en tant que fertilisants dans les champs (Gogos et al., 2012). Grâce à leurs fortes capacités d’absorption, ils pourraient éliminer des contaminants biologiques comme les bactéries ou les virus, ou chimiques (métaux lourds, molécules organiques, etc.). En effet, ces contaminants présentent une forte affinité pour les NTC, ce qui permettrait une élimination plus simple (Upadhyayula et al., 2009). Comme d’autres NM, ils pourraient donc être utilisés dans des secteurs comme la remédiation des sols ou des eaux polluées (Liné and Larue, sous presse).
5
3. E
COTOXICOLOGIE DES
NTC
Dissémination et détection des NTC dans l’environnement
Tout le long de leur cycle de vie, depuis leur production jusqu’à la destruction des « nanoproduits » en passant par leur utilisation ou encore leur transport, les NTC peuvent se répandre dans l’environnement (Gottschalk et al., 2013b). La dissémination est le plus généralement non intentionnelle. Par exemple, les NTC peuvent être accumulés dans les sols suite à l’usure des pneus contenant des NTC sur les routes (Nowack et al., 2013). Une étude a également mis en évidence des NTC dans les poumons d’enfants Parisiens, une hypothèse avancée par les auteurs de l’étude étant qu’ils viendraient des pots catalytiques des voitures (Kolosnjaj-Tabi et al., 2015). Il est important de noter que les NTC mis en évidence dans ces travaux ressemblent assez peu au niveau de leur morphologie aux NTC synthétisés de manière intentionnelle. Ils se retrouvent également concentrés dans les boues de station d’épuration (STEP), ce qui représente un vecteur fort vers les sols agricoles puisqu’un des principaux débouchés pour ces boues est l’épandage en agriculture (Sun et al., 2016b). Les NTC pourraient être également dispersés dans l’environnement de manière intentionnelle si par exemple ils sont utilisés dans la remédiation des sols et des eaux pollués, ou encore en comme fertilisants en agriculture (Upadhyayula et al., 2009).
A ce jour, la concentration des NTC dans l’environnement ne peut être mesurée directement car nous ne disposons pas des moyens techniques nécessaires. Seules des études de modélisation permettent d'estimer les concentrations présentes dans les différents compartiments environnementaux. Sun et al. (2016b) ont suggéré que la concentration en NTC dans les eaux de surface en 2014 en Europe était de 0,36 ng/kg, de 6,74 µg/kg dans les sédiments, de 35 ng/kg dans les sols urbains et naturels, de 11,7 µg/kg dans les sols traités avec des boues de station d’épuration et enfin de 0,02 ng/m3 dans l’atmosphère.
La détection et la quantification des NTC dans des échantillons biologiques sont très complexes. En effet, il est difficile de détecter une forme spécifique de carbone dans une matrice elle-même essentiellement carbonée. Certaines techniques sont tout de même utilisées mais, mis à part le marquage isotopique au
14C, il est généralement très difficile d’analyser à la fois qualitativement et quantitativement les NTC dans
des matrices biologiques et/ou environnementales (Czarny et al., 2014). Parmi ces techniques, on note la microscopie électronique à transmission (MET), la spectroscopie Raman, les analyses thermogravimétriques (ATG), les mesures microondes ou encore l’imagerie hyper spectrale (Herrero-Latorre et al., 2015). D'autres méthodes basées sur la photoluminescence des NTC ne sont valables que pour certains types de NTC (les mono parois) (Lefebvre et al., 2004) et ne sont donc pas généralisables. La mobilité des NTC dans les sols a été peu étudiée dans la littérature, mais quelques tendances peuvent être dégagées. Leur biodisponibilité est plus forte dans des sols riches en matière organique et semble faible dans le cas contraire (Cornelis et al., 2014). Au niveau des végétaux, il a été rapporté de nombreuses fois que les NTC sont capables de pénétrer les graines (Khodakovskaya et al., 2009; Hao et al., 2016; Martínez-Ballesta et al., 2016; Mohamed H. Lahiani et al., 2016) mais aussi les racines des plantes (Tan et
6
jusque dans les feuilles en empruntant le système vasculaire de la plante. Ils ont ainsi été détectés dans les tiges, les feuilles mais également jusque dans les fruits (Begum and Fugetsu, 2012a; Smirnova et al., 2012; De La Torre-Roche et al., 2013; Hao et al., 2016).
Impacts des NTC sur les plantes
Avec l’utilisation croissante des NTC et donc une augmentation potentielle de leur concentration dans l’environnement, le nombre d’études sur leurs impacts (éco)toxicologiques s’est multiplié, montrant en particulier que les NTC présentent des risques potentiels pour l’Homme notamment après une exposition par les voies aériennes. Les effets sanitaires des NTC sont d’autant plus préoccupants qu’ils peuvent être comparés à l’amiante du fait de leur morphologie fibreuse et de leur relative biopersistance (Donaldson
et al., 2013).
Du fait de leur possible future utilisation dans des domaines comme l’agriculture ou encore la remédiation des sols, il est indispensable de déterminer le comportement et les impacts des NTC sur les écosystèmes terrestres, et plus particulièrement sur les plantes d’intérêt agricole. Ce comportement peut en particulier dépendre des propriétés physicochimiques des NTC (pureté, longueur, diamètre, fonctionnalisation) mais également des conditions environnementales (caractéristiques du sol, conditions météorologiques) (Jackson et al., 2013).
Les impacts des NTC sur les plantes sont à ce jour controversés (Liné, Larue and Flahaut, 2017). Il a été montré à de nombreuses reprises qu’ils peuvent améliorer la croissance des plantes. En effet, ils ont permis l’augmentation de la germination de graines (Khodakovskaya et al., 2009; Oleszczuk et al., 2011; Lahiani et al., 2015a; Lahiani et al., 2016), de la production de biomasse, de la production de fleurs ou encore de l’élongation racinaire (Oleszczuk et al., 2011; Smirnova et al., 2012; Tiwari et al., 2014; Martínez-Ballesta et al., 2016; Lahiani et al., 2016). D’autres études ont montré, au contraire, que les NTC peuvent avoir des impacts plutôt « négatifs » sur les plantes. Ils ont ainsi réduit la croissance de certaines plantes ou encore provoqué une augmentation de la teneur en espèces réactives de l’oxygène (ERO) (Tan et al., 2009). Il a été également prouvé que les NTC peuvent causer des lésions nécrotiques sur les tissus foliaires et même modifier la morphologie des feuilles et des racines (Begum and Fugetsu, 2012a). Pour finir, certaines études n’ont pas mis en évidence d’effet des NTC sur les plantes (Lin and Xing, 2007; Larue et al., 2012; Hamdi et al., 2015). Cette grande disparité dans les résultats peut être expliquée par de nombreux paramètres : la nature des NTC mis en jeu, les conditions d’exposition utilisées pour mener l’étude (en conditions hydroponiques ou en sol) ou encore le type de plante utilisé. De plus, l’évaluation de l’impact des NTC peut se faire selon différents marqueurs de l’état de santé de la plante (morphologiques, physiologiques ou encore biochimiques). Le manque de normalisation des conditions d’étude ainsi que la multitude de marqueurs disponibles ne permettent pas une évaluation standardisée de l’impact des NTC sur les plantes. Il existe également une multitude de NTC ayant différents paramètres physicochimiques qui vont conditionner leur comportement. En comprenant les effets de ces paramètres, il sera possible d’utiliser une approche «safe(r) by design» lors de la synthèse des NTC. Cette approche consiste à
7
synthétiser des matériaux plus sûrs pour l’environnement en modulant leurs propriétés physicochimiques mais tout aussi efficace pour l’industrie.
4. P
RESENTATION DE L
’
ETUDE
Dans l'ensemble, les effets et le comportement des NTC chez les plantes sont encore mal compris et très controversés. La réponse de la plante peut être influencée par plusieurs paramètres qui diffèrent d'une étude à l'autre.
Question de recherche n°1 : La phytotoxicité est-elle liée à l'internalisation des NTC dans les feuilles des plantes ?
De nos jours, la détection des NTC dans les plantes est encore un défi, mais il a été démontré que les NTC peuvent être internalisés. Pour répondre à cette question, nous avons analysé plusieurs techniques de détection des NTC chez les plantes en utilisant des concombres (Cucumis sativus) cultivés dans des conditions hydroponiques comme modèle expérimental. Les résultats sont détaillés au chapitre 4. Question de recherche n°2 : Les NTC ont-ils des impacts différents selon les espèces végétales ?
Dans la littérature, peu d'expériences analysant différentes espèces de plantes ont été menées. Ils tendent à démontrer que les impacts des NMs peuvent dépendre des espèces végétales. Notre hypothèse de recherche est que la famille de plantes (dicotylédones vs monocotylédones) régit la réponse des plantes. Pour étudier cette hypothèse, nous avons évalué les impacts des NTC sur 4 plantes différentes : 3 dicotylédones : canola (Brassica napus), tomate (Solanum lycopersicum) et concombre (Cucumis sativus) et 1 monocotyledone : maïs (Zea mays) (chapitre 6). Cette expérience a permis de déterminer les espèces les plus sensibles.
Question de recherche n°3 : Dans quelle mesure les caractéristiques des NTC influencent-elles la réponse des plantes ?
Des travaux antérieurs réalisés au laboratoire ont mis en évidence que les diamètres des TiO2-NP
influençaient l'absorption de NM et leurs effets sur les plantes. Avec cette expérience, nous avons voulu vérifier cette hypothèse sur les NTC. Tout d'abord, nous avons étudié les impacts de deux NM différents : TiO2-NPs et des NTC sur la réponse des plants de tomate (Solanum lycopersicum) (chapitre 5). Pour se
faire, nous avons développé la spectroscopie infrarouge à transformée de Fourier (FTIR). Nous nous attendons à ce que la chimie et la forme des NM conduisent à des modifications biomacromoléculaires différentes.
Ensuite, nous émettons l'hypothèse que les paramètres physico-chimiques des NTC (c.-à-d. diamètre, longueur, fonctionnalisation, dispersion) influencent leurs impacts sur les plants de colza (Brassica napus). Pour cela, 5 NTC ont été utilisés (NTC double parois, NTC double parois fonctionnalisés, NTC multi parois, NTC multi parois fonctionnalisés et NTC multi parois courts) (chapitre 7).
8
Question de recherche n°4 : L'application d'un stress combiné à l'exposition aux NTC entraîne-t-elle une toxicité différente ?
Certaines études ont rapporté qu'un stress combiné entraîne une toxicité plus élevée des NM. Dans le contexte du changement climatique, nous évaluons l'impact du stress thermique sur la toxicité des NTC du colza (Brassica napus). Les effets ont été comparés à la toxicité des NTC sur les plantes poussant dans des conditions de croissance optimales pour vérifier l'augmentation de la sensibilité (chapitre 7).
9
C
HAPTER
1:
I
NTRODUCTION
– Publication –
C. Liné, C. Larue & E. Flahaut. Carbon nanotubes: Impacts and behaviour in the terrestrial ecosystem - A review. Carbon, published in July 2017.
10
1. C
ARBON NANOTUBES
:
I
MPACTS AND BEHAVIOUR IN THE TERRESTRIAL
ECOSYSTEM
-
A
REVIEW
Clarisse Liné
a, b, Camille Larue
a, Emmanuel Flahaut
ba ECOLAB, Université de Toulouse, CNRS, INPT, UPS, France
b CIRIMAT, UMR CNRS 5085/LCMI, Centre Inter-universitaire de Recherche et d’Ingénierie des Matériaux,
11
1.1. Abstract
For more than twenty years, nanotechnologies have arisen a huge interest and are used in numerous fields. Carbon nanotubes (CNTs) are one of the most used nanomaterials thanks to their excellent optical, mechanical, electrical and thermal properties. All along their lifecycle, CNTs may be spread in the environment during production, use, destruction, reuse or potential accidents in production units or during transportation. For this reason, it is essential to evaluate their behaviour and potential impacts on ecosystems and particularly on the terrestrial ecosystem. After a brief summary of CNT properties, synthesis methods, and applications as well as detection and characterisation techniques, this review will focus on impacts of CNTs on the terrestrial ecosystem, discussing their behaviour in soil, plants and interactions with other pollutants as well as their impacts on soil microbiota, macrobiota and plants.