DOCTORAT DE L'UNIVERSITÉ DE TOULOUSE
Délivré par :
Institut National Polytechnique de Toulouse (Toulouse INP) Discipline ou spécialité :
Photonique et système optoélectronique
Présentée et soutenue par :
M. RAUL DA COSTA MOREIRA le jeudi 6 juin 2019
Titre :
Unité de recherche : Ecole doctorale :
Implementation of a high resolution optical feedback interferometer for
microfluidics applications
Génie Electrique, Electronique, Télécommunications (GEET)
Laboratoire d'Analyse et d'Architecture des Systèmes ( LAAS) Directeur(s) de Thèse :
M. THIERRY BOSCH M. JULIEN PERCHOUX
Rapporteurs :
M. ERIC LACOT, UNIVERSITE GRENOBLE ALPES M. SANTIAGO ROYO, CD6 Universitat Politecnica Catalunya
Membre(s) du jury :
Mme ALEXANDRA ALEXANDROVA, UNIVERSITE LYON 1, Président M. GUY PLANTIER, EC SUP ELECTRONIQUE OUEST, Invité
M. JULIEN PERCHOUX, TOULOUSE INP, Membre Mme KARINE LOUBIERE, CNRS TOULOUSE, Membre
M. THIERRY BOSCH, TOULOUSE INP, Membre
MICROFLUIDICS APPLICATIONS
Implémentation d’un Interféromètre par
Réinjection Optique à Haute Résolution pour les
Applications Microfluidiques
Doctorat de l’UNIVERSITÉ DE TOULOUSE Institut National Polytechnique de Toulouse
(INP Toulouse)
École doctorale et spécialité :
GEET : Photonique et Systèmes Optoélectroniques Unité de Recherche :
Laboratoire d’Analyse et d’Architecture des Systèmes (LAAS-CNRS) – équipe OSE, France.
Directeur de Thèse : Prof. Thierry BOSCH Co-directeur : Dr. Julien PERCHOUX
Recent progress of interferometric sensors based on the optical feedback in a laser diode have demonstrated possibility for measurement of flow rates and flow-profiles at the micro-scale. That type of compact and embedded sensors is very promising for a research and industrial field –microfluidics – that is a growing domain of activities, at the frontiers of the physics, the chemical science, the biology and the biomedical. However, the acquisition of flow rate or local velocity at high resolution remains a very challenging issue, and the sensors that have been proposed so far did not have been giving sufficient information on the nature of the particles flowing.
The present thesis is driven by the implementation, validation and evaluation of the sensing performances of the optical feedback interferometry technology in both chemical and biomedical fields of applications. The elaboration of a new generation of sensors that will provide both a high spatial resolution for 2D Doppler imaging is presented, as well as a methodology that gives further information on the flowing particles concentration and/or dimensions. Then, a new embedded optical feedback interferometry imager for flowmetry has been realized using a 2-axis beam-steering mirror mounted on Micro-Electro-Mechanical Systems (MEMS) thus taking the full advantage of the compactness offered by the optical feedback interferometry sensing scheme.
While previous works on optical feedback interferometry flowmetry have been limited to high particle densities fluids in single or multiple scattering regimes, we present also a sensing technique based on the optical feedback interferometry scheme in a laser diode that enables single particle detection at micro and nanoscales through the Doppler-Fizeau effect. Thanks to the proposed signal processing, this sensing technique can detect the presence of single spherical polystyrene micro/nanospheres seeded in watery suspensions, and measure their flow velocity, even when their diameter is below half the laser wavelength. It discriminates particle by their diameter up to a ratio of 5 between large and small ones while most of the technologies for particle characterization is bulk and requires manipulation of the fluid with small volume handling, precise flow and concentration control.
Altogether, the results presented in this thesis realize a major improvement for the use of optical feedback interferometry in the chemical engineering or biomedical applications involving micro-scale flows.
optique dans une diode laser ont démontré la possibilité de mesurer des débits d’écoulements et des profils de vitesses d’écoulement à l'échelle micrométrique. Ce type de capteurs compacts et intégrés est très prometteur pour un domaine - la microfluidique - qui est en expansion, aux frontières de la physique, de la chimie, de la biologie et du biomédical. Cependant, la mesure du débit ou de la vitesse locale en haute résolution reste un problème très complexe et les capteurs proposés jusqu’à présent n’ont pas fourni d’informations sur la nature des particules qui s’écoulent.
La présente thèse porte sur la mise en œuvre, la validation et l'évaluation des performances de détection de la technologie OFI dans les domaines d'applications chimiques et biomédicaux. L'élaboration d'une nouvelle génération de capteurs qui fourniront à la fois une haute résolution spatiale pour l’imagerie Doppler 2D est présentée ainsi qu’une approche novatrice permettant de fournir des informations supplémentaires sur la concentration et/ou les dimensions des particules en mouvement. Ensuite, un imageur Doppler par réinjection optique, embarqué dans un système compact pour la débitmétrie a été réalisé à l'aide d'un micro-miroir monté sur des systèmes micro-électromécaniques (MEMS), tirant ainsi pleinement parti de la compacité offerte par le système de détection par réinjection optique.
Alors que les travaux précédents sur la débitmétrie par réinjection optique ont été limités aux fluides à haute densité de particules dans des régimes de diffusion simples ou multiples, nous présentons également une technique permettant la détection de particules uniques de dimensions micro et nanométriques à travers l'effet Doppler-Fizeau. Grâce au traitement du signal proposé, cette technique de détection peut détecter la présence de micro/nanosphères de polystyrène sphériques uniques ensemencées dans des suspensions aqueuses et mesurer leur vitesse d'écoulement, même lorsque leur diamètre est inférieur à la moitié de la longueur d'onde du laser. Cette méthode présente de nombreux avantages par rapport aux méthodes habituelles qui nécessitent une manipulation du fluide, dans des volumes toujours plus petits avec un contrôle précis du débit et de la concentration.
L’ensemble des aspects traités dans cette thèse représente une avancée majeure pour l’utilisation des capteurs par réinjection dans les applications d’ingénierie chimique ou biomédicale implicant des écoulements à micro-échelle.
Mots clés: interférométrie; Imagerie Doppler; réinjection optique; caractérisation des micro/
May the splendor of the bright star watching for the good in the human Intellect be glorified. May It shine, enthroned over each human heart, repelling the evil of ignorance away from the human mind.
Here I am, being initiated to the high university degree of Philosophiae Doctor in the renowned University of Toulouse, what a happiness! May I contribute to watch for the health of wisdom in this world, by the blessings from the healing loving kindness. May I always remember, and never forget, that science should be developed under the aegis of a fraternal family in favor of the common well-being of the whole humanity, where we must act as true companions of each other. How good and pleasant it is, when the charity of love and the rigor of knowledge can live together as brothers in union, for harmony.
We are never alone although our own efforts. I share the fruits of my work, first of all, with my family. They have always supported my personal formation as social being. My very deep gratitude to my wife Carolina, with who I live fully aware of the invencible powers of love. I thank my mentors, that guided me and offered me tools to shape well my mind. Thanks to my fellows that along this life journey have been exchanging their perspectives and experiences.
I am grateful to Thierry BOSCH for sharing his senior mentorship in the field of laser self-mixing as my thesis advisor. My very special thanks to Julien PERCHOUX for his very dynamic guidance, always present sharing with me the gifts of his sharp mind. It has been a great honor working under the direct supervision of both, as main representatives of the OSE team (LAAS-CNRS).
My sincere thanks for all support of my colleagues and friends: Evelio R. MIQUET, Antonio LUNA A., Reza ATASHKHOOEI, Yu ZHAO, Adam QUOTB, Clément TRONCHE, Francis JAYAT, Emmanuelle TRONCHE, Francis BONY, Olivier BERNAL, Hélène TAP, Han-Cheng SEAT, Jalal AL R., Fernando URGILES, Mengkoung VENG, Einar KNUDSEN, Bastien GRIMALDI, Harris APRIYANTO, Laura LE BARBIER,
I am very grateful to my country, Brazil, that gave me all the conditions to grow. France, thank you for welcome me, allowing me to help as a citizen of the world. Special thanks to all colleagues from ESEO Angers for the opportunities to develop further my teaching skills grasped during my PhD. Godspeed!
Abstract ... ii
Résumé ... iii
Acknowledgements ... iv
INTRODUCTION ... 1
CHAPTER 1: Optical feedback interferometry in fluidics sensing ... 5
1.1. Context ... 5
1.1.1. Laser diodes for Doppler optical feedback flowmetry ... 6
1.1.2. Velocity flow profile ...23
1.1.3. Speckle approach in OFI ...30
1.2. The scattering regimes ... 32
1.3. Laser Diode OFI theory for a multiplicity of single scatterers ... 33
1.4. Motivations of the present thesis ... 37
Chapter references ... 39
CHAPTER 2: OFI flow monitoring ... 42
2.1. Context ... 42
2.2. Signal processing methods ... 43
2.2.1. Spectral morphology ...43
2.2.2. Cut-off frequency method ...46
2.2.3. Peak detection method ...47
2.2.4. Moment method ...48
2.3. Materials and methods ... 50
2.3.1. Fluidic channels ...50
2.3.2. Single lens scheme ...52
2.3.3. Double lens scheme ...56
2.3.4. Double lens with transmission grating ...68
2.4. Conclusion ... 77
Chapter references ... 80
CHAPTER 3 : OFI 2D Doppler imagers ... 83
3.1. Context ... 83
3.2. Translation stages scanning system ... 88
3.3. 2D MEMS micro-mirror beam steering system... 94
3.3.1 Description of the sensor arrangement ...94
3.3.2. Ex-vivo experiments ...98
Chapter references ...110
CHAPTER 4: Micro and nanoparticles characterizations with OFI ... 111
4.1. Context ...111
4.2. Single particle regime ...113
4.3. OFI sensing scheme for single particle detection ...114
4.3.1. Single particle detection algorithm ... 115
4.3.2. Scattering particles ... 117
4.3.3. Detection rate evaluation ... 121
4.3.4. Single detection and velocimetry ... 123
4.3.5. Post-processing analysis regarding sizing prospection ... 129
4.3.6. Detection and velocimetry of large single particles ... 135
4.3.7. Micro and nanoparticle characterization under single scattering regime ... 141
4.4. Conclusion ...148 Chapter references ...149 CONCLUSIONS ... 150 List of publications ... 155 Conference papers ...155 Journal papers ...155 Annex ... 156
INTRODUCTION
Since the invention of the light microscope, our capabilities to discover and explore the microscopic universe have been increasing with time. The scientific discoveries have been revealing a world full of wonders offering possibilities of scientific advancements involving multiple fields of applications.
Much of this development has been possible thanks to the evolution of the microelectronics in particular with the exponential growth of the semiconductor industry, and the continuous progress in the processes of device miniaturization has benefited to the design of microelectromechanical systems.
In this context, the microfluidics emerged as a breakthrough technology with a multidisciplinary field of applications involving engineering, physics, chemistry and biology. In the actual microfluidics research and development, we can highlight two main domains of applications: the chemical one, that includes micromixers, microreactors, lab-on-chip and particle characterization devices; and the biomedical one, mostly related to microvascular researches, disease diagnosis, flow cytometry, and DNA analysis.
In the very most of these microfluidics applications, high-resolution sensing accuracy associated to other features such as compactness and non-invasiveness are highly demanded. Then, the sensing advantages offered by the optoelectronics have been combined to the microfluidics to rise a new cross-disciplinary field of research and technology, sometime labelled as “optofluidics”.
This thesis is inscribed in this context as it deploys the laser sensing techniques based on the Optical Feedback Interferometry (OFI) technology for flowmetry applications. The OFI technology holds very attractive features such as noninvasiveness, non-destructiveness, compactness, robustness, simplicity, low
cost, and self-alignment, while offering enough performance in terms of spatial resolution for flow velocity measurements at micro-scale.
More than any optical sensing approach, OFI which is likely to be the most compact interferometric system that can be designed offers possibility to conceive embedded scientific tools in any domain where micro-scale flow channels are involved. The maturity of such sensing approach remains however low as compared to micro Particle Image Velocimetry (µ-PIV) or Laser Doppler Velocimetry (LDV). While these methods are nowadays the accepted standards in industry as well as in research, the OFI sensing scheme must upgrade its performances and reliability so that it will become an alternative solution. These improvements will come from new implementations of the OFI sensor, and properly established processing approaches. The present thesis aims at contributing to the improvement of the OFI performances for microfluidics sensing and proposes new implementations of the sensor.
Besides evaluating innovating implementations of the flowmetry based on the OFI technology and towards an approach of integration as a real-time embedded system, our researches also explore the domain of micro and nanoparticles detection and characterizations. It investigates the limit of particle detection regarding the particle size with the milestone of detection (with velocity measurement) of single nanoparticles with diameter far below half the laser wavelength.
The present thesis manuscript is organized as follows:
The first chapter presents a review of the fluidics sensing techniques based on Doppler optical feedback interferometry using laser diodes. A comparative review of the main flowmetry methods based on the OFI using the Speckle effect is proposed. A comparison of the two approaches leads to focus attention to the Doppler approach on which our researches are based. Then, we introduce the definitions of the scattering regimes that play a major role in the signal processing strategy. Eventually, the optical feedback effect modeling is presented, describing
multiplicity of single scatterers. Finally, we detail the motivations of this thesis in order to place our choices in the actual scientific context.
The second chapter details the aspects that can affect the OFI signal frequency spectrum morphology and introduces different OFI flow monitoring signal processing methods based on the frequency domain analysis. Three optical configurations are experimentally evaluated, with one focusing lens, a pair of collimating/focusing lenses and the innovating use of a transmission diffraction grating. A detailed comparison of the sensor accuracy in flow velocity measurements from single to multiple scattering regimes is performed with those optical configurations, while for each of them the different signal processing methods are compared.
The third chapter presents an OFI 2D Doppler imager developed during our participation to the European project Diagnoptics dedicated to early skin cancer diagnosis and where the OFI sensor had applications for ex-vivo and in-vivo flow measurement. We present the technical setup and the experiments performed on an optical table with translation stage scanning systems that were the first steps towards the 2D embedded imager. We describe the dedicated algorithm for a signal processing method that handle the strong signal variations induced by the displacement of the target that are likely to happen in the in-vivo configuration. Following that, we present and evaluate our design of a handheld 2D OFI Doppler flow imager that has been realized using a 2-axis beam-steering mirror mounted on a Micro-Electro-Mechanical System (MEMS) in order to take the full advantage of the compactness offered by the OFI sensing scheme. Finally, we present and briefly discuss the results of a clinical study performed for skin cancer diagnosis in the frame of Diagnoptics.
The forth chapter presents a major milestone of our research in OFI flowmetry as it demonstrates the possibility to detect and somehow to characterize micro and nanoparticle flowing in a microchannel. After introducing the definition of the single particle regime, a real-time algorithm for single particle detection and velocimetry is described and evaluated experimentally. Then, the capability of
detection of large diameter particles seeded in a watery suspension of smaller ones in higher concentration is experimentally evaluated. Finally, we present and validate experimentally the methods to perform quantification of the size or the concentration of particles of similar nature in watery suspensions at the multiple particle regime. This study is carried out for a large range of dilution and so at different scattering regimes. The impact of the flow rate is also evaluated.
Finally, a general conclusion is given, and a further perspective for potential future works is proposed.
CHAPTER 1: Optical feedback interferometry in fluidics sensing
1.1. Context
Since the advent of the laser, the optical feedback effect due to the laser light interaction with the environment was observed, and it was considered a parasitic and undesired aspect in laser operation affecting both the frequency and amplitude of the laser output. The optical feedback, also called self-mixing effect, happens when part of the light from the laser beam, which is scattered from an external target, is retro-injected into the laser’s cavity where it creates interferences.
In 1964, Yeh and Cummins [1] became the pioneers in the development of a technique exploiting the Doppler-Fizeau effect with the laser light to measure liquid’s velocity, establishing the principles of the Laser Doppler Velocimetry (LDV). In 1965 Foreman applied this approach to measure gas flow [2], and in 1966 improved the approach from Yeh and Cummins for liquid’s [3]. But in 1968, Rudd [4] was the first to take benefit of the laser optical feedback effect in the He-Ne gas laser for Doppler velocimetry.
Some years after, Seko [5] demonstrated the capability of optical memory readout from a rotating compact disc due to the laser power modulation by induced optical feedback in a semiconductor laser. The output power in the rear end of the laser was measured by an external photodetector.
The optical feedback effect had been also detected in a CO2 laser, and H.
1.1.1. Laser diodes for Doppler optical feedback flowmetry
The optical feedback interferometry (OFI) arises from the interference inside the laser diode cavity between the electromagnetic wave generated by the laser and the one from optical feedback, re-entering the cavity due to the back-scattering or reflection from a distant target. These interferences generate modulations of the amplitude and frequency of the laser output beam, which carries information with physical meanings related to the target. For laser diodes with a built-in package photodiode, the OFI power signal can easily be acquired from the photodiode’s current after proper amplification. When the OFI scheme is applied to metrology in fluidics applications, it can be also denominated optical feedback flowmetry. In such context, the amplitude of the OFI signal is proportional to the amount of light reinjected into the laser cavity once backscattered by particles embedded into the fluid that cross the laser beam. The backscattered power is related to the power density of illumination, the scattering cross-section of the particles and their optical properties according to the scattering theory. The “sensing volume” is defined here as the volume where the scatterers are generating measurable contributions to the OFI signal.
In 1980, Lang and Kobayashi [7] presented a model for the semiconductor laser operation under optical feedback that nowadays represents the cornerstone on describing the laser dynamics under feedback.
S. Shinohara [8] was the first (1986) to take advantage of the built-in photodiode in a laser diode to exploit the optical feedback signal for Doppler velocimetry, revealing the capability to measure the angular velocity of a solid rotating target. Following, Jentink [9] also demonstrated similar results.
In 1992, de Mul et al [10,11] has applied the OFI technique to measure liquid flow, including in-vivo measurements of blood perfusions from human fingertips. The work of de Mul was based on Bonner and Nossal [12], who have developed a theory relating quasi-elastic light scattering measurements to blood flow in tissue microvasculature. This theory implies that the time decay of the photon
inversely with mean translational speed. Analysis of multiple interactions of photons with moving cells indicates the manner in which spectral measurements additionally are sensitive to changes in blood volume. The theoretical model leads to predictions of the way in which photon autocorrelations and photocurrent power spectra depend on variables of the moving particles such as angular scattering cross section, size, number density, and speed distribution.
Bonner and Nossal had shown that the normalized first moment of the spectrum, < > , is proportional to the RMS speed of the moving particles √< 𝑉 >2 as:
< >=𝛽√<𝑉>𝑎√12𝜉2𝑓(𝑚̅), (1.1)
where 𝑎 is the radius of an average spherical scatterer, 𝜉 is an empirical factor which is related to the shape of the red blood cells, and 𝛽 is an instrumental factor which depends primarily upon the optical coherence of the signal at the detector surface. The variable 𝑚̅ , proportional to red blood cell number density, is the average number of “collisions” which a detected photon makes with a moving cell, the function 𝑓(𝑚̅) is linear with the tissue blood volume for 𝑚̅ ≪ 1 (heterodyne) and varies as the square root of tissue blood volume for 𝑚̅ ≫ 1. Considering that, the first moment < > of the signal spectrum 𝑆():
< >= ∫ ||𝑆()d+∞
−∞ , (1.2)
has been taken as an indication of relative measurements of blood flow.
de Mul et al have shown that for optical feedback flowmetry, in the case of liquid flow or tissue perfusion measurements, the 1st moment is proportional to
the average velocity times the number of Doppler scattering particles, while the 2nd
order statistical raw moment of the frequency distribution of the Doppler frequencies from OFI signal power spectrum defined as
< 2 >= ∫ |+∞ 2|𝑆()d
is proportional to the perfusion squared; and, in cases where the multiple-scattering effects are small, the zeroth moment < 0 > (simply the integrated power spectrum, when integrated for ≠ 0):
< 0 >= ∫ 𝑆()d+∞
−∞ , (1.4)
is proportional to the number of Doppler scattering particles, and consequently to the particle concentration.
Since then, the potential flowmetry applications of OFI technology to biomedical fields have really started to be considered and explored.
OFI with fiber-coupled laser diode was also evaluated for flowmetry by Slot [13] and Koelink [14-17], members of de Mul’s team in the University Hospital of Groningen, especially considering the blood perfusion assessment in vivo and in vitro.
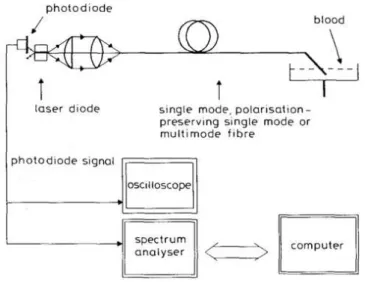
Slot performed in vitro experiments (Fig. 1) using a rotating bowl filled with human blood (with a normal hematocrit of about 40%) uncoagulated with heparin. The calibration of the blood velocity was performed by placing the bowl in a position of the rotating disk with a known angular velocity, and the position of the fiber was fixed accordingly. By rotating the bowl, the signals were measured while the blood ran both towards and away from the fiber facet.
Fig. 1. In vitro experimental setup for self-mixing measurements in a fiber-coupled 780nm diode laser. [13]
Slot has used the first weighted moment of the self-mixing signal spectrum 𝑆(): < > < 0 > = ∫ ||𝑆()d2 1 ∫ 𝑆()d2 1 , (1.5)
measured as a function of the blood flow speed in vitro, proving to have a proportional and reproducible relationship with the blood flow velocity after calibration against a properly chosen standard flow. This measurement is shown in Fig. 2 (with 1 = 0 Hz and 2 = 50 kHz, because the maximum frequency of the
Fig. 2. First (weighted) moment of the self-mixing signal spectrum as a function of the blood velocity with the flow away from fiber facet (•), and flow towards fiber facet (∎). [13]
Slot also proved the usability of the fiber-coupled self-mixing technology for blood flow velocimetry in human in vivo experiments. Figure 3 reveals a preliminary self-mixing signal spectrum obtained after introducing the fiber through a Teflon cannula into the left cephalic vein of a healthy volunteer. The fiber was introduced in the direction of the blood flow, so the blood ran away from the fiber facet.
In Fig. 3 two spectra can be seen, the upper one corresponds to the spectrum of the free-flowing blood, while the lower is the noise spectrum (biological zero obtained by means of an occlusion with a cuff round in the upper arm).
Slot has also performed an in vivo animal experiment in the same conditions as mentioned in the human one, but now the fiber was introduced into the main artery of the left rear leg of a healthy sheep. The perfusion parameter monitored by a digital signal processor (DSP) was the first unweighted moment < > (with 1 = 30 Hz and 2 = 30 kHz, limited by the DSP used). The lower limit 1 was set to eliminate variations in the signal from non-Doppler shifted light (DC component). Figure 4 shows a real-time recording of the measurements while an occlusion of the lower part of the aorta was performed. The biological zero flow level is clearly visible during the occlusion, and also the overshoot of the blood flow after the occlusion.
Fig. 4. Recording of the blood flow in the main artery of the left rear leg of a healthy sheep during an occlusion of the lower aorta. The fast fluctuation of the signal is caused by the heartbeat. [13]
Scalise and de Mul in partnership [17, 18] tested the efficiency of this fiber-coupled self-mixing approach to Doppler velocimetry in intra-arterial conditions. In 2001, using the optical glass fiber inserted in the iliac artery of a pig with an endoscopic bask catheter, they obtained less than 9% difference regarding a commercial ultrasound flowmeter [18].
In the domain of in-vivo biomedical applications, Hast [19] has measured the cardiovascular pulse shape from the radial artery with 95.7% of successfully detected pulses from the Doppler spectrogram, in good correlation with the blood pressure signals measured from the middle finger through a commercial equipment. Figure 5 illustrates the measurement system with both techniques.
Fig. 5. Block diagram of the measurement system [19].
Figure 6 reveals the good correlation between the detected pulses from blood pressure signal and the Doppler peaks pulses and for a 30-second measurement in a volunteer.
Fig. 6. Blood pressure pulse signal (a) and Doppler spectrogram (b) from a volunteer during a 30-second measurement [19].
Among the possible applications of OFI in the field of chemical engineering, the particle characterization is of major interest. Zakian [21, 22] has shown the possibility to perform particle sizing (using polystyrene monodisperse nanospheres in watery dilute suspensions) at low particle concentration (less than 0.5% in volume). The measurement method was based in diffusion-broadening effect, where the spectral distribution of the scattered light is related to the sphere diameter so that for larger ones the spectral broadening is smaller, while bigger for smaller ones. This effect is explained by the quasi-elastic light-scattering theory, which represents the process of incident frequency broadening due to diffusional dynamic light scattering by small particles; and the spectral line shape is well described by a Lorentzian function with half-width at half-maximum (HWHM) inversely proportional to the radius of the sphere undergoing Brownian motion. In that way, experiments for characterization of the particles size were successfully performed in a diameter range from 20 to 202 nm (Fig. 7).
Fig. 7. Collection of Lorentzian fits from spectra (normalized photodiode voltage) of experimental results for different particle diameters. (o 20 nm, × 58 nm, ♦70 nm, + 113 nm, and ☐ 202 nm). [21]
Zakian has also performed experiments to measure the maximum flow in a circular tube through layers of scattering media using several spectral signal
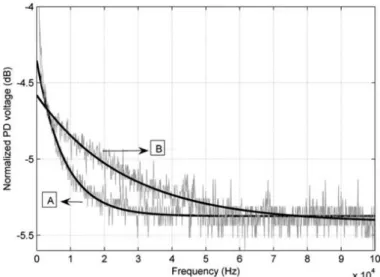
processing methods based on moments and curve fittings [23]. Milk was used as a phantom model to human blood, due to its high scattering coefficient and low absorption. The purpose was to model the cutaneous microcirculation evaluating the best approach considering the effect of static scattering from skin phantom layers surrounding a 1.5 mm diameter capillary tube. Regarding the signal processing, the result was that an exponential curve fitting in semi-logarithm scale describes well the line shape of the spectrum (Fig. 8). The frequency decay constant of the curve (f0) was used as a flow parameter, as it revealed to be the best to monitor flow under layers up to 1.1 mm in thickness.
Fig. 8. Example of two spectra sensed with 0.42 mm thick scattering layer at a position showing no flow (graph A) and at a position showing maximum flow (graph B) corresponding to the 50 ml/h. In bold lines we have exponential curves fitted to the graphs. [24]
Following that, he presented a work [24] where the whole OFI sensing system was mounted in a motor driven 2D scanning system in order to image and evaluate the flow map obtained in different flow rates for three types of phantoms in different thicknesses. The Fig. 9 shows the experimental setup.
Fig. 9. Experimental setup from [24]. L1: collimating lens, L2: focusing lens, LD: laser diode, PD: photodiode in package.
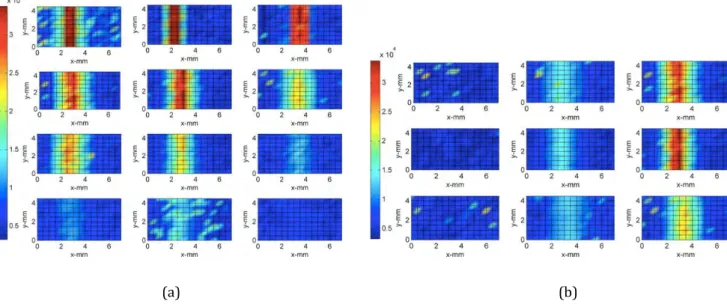
This was the first published work revealing 2D images of in-vitro flow intensity based on OFI system, as it is shown in the Fig. 10.
(a) (b)
Fig. 10. Flow map (f0 color coded) for three different kinds (columns) of phantom tissue layers (a) with, from top to bottom rows: no layer employed; 0.42 mm; 0.70 mm; and 1.19 mm thick layers. (b) under, from left to right: no flow; 25ml/h and 50ml/h flow rates, with 0.42mm thick layer.
Although the ability to employ OFI sensing scheme for 2D Doppler imaging was demonstrated, the scanning time was considerably long. Even if the acquisitions for each pixel took around 180 ms, the time to change from one position to the next one was around 10s. So wider the scanning area and higher the image resolution, bigger will be the number of pixels and consequently the total scanning time.
With the advent of vertical-cavity surface-emitting laser (VCSEL), the team from the University of Queensland was the first to use a single 850-nm VCSEL laser in a single lens configuration to measure the liquid flow rate utilizing the variation in junction voltage of the laser due to optical feedback interference, as presented by Tucker et al. [25]. Despite exhibiting a lower signal-to-noise ratio as compared to the flow rate measurements using an integrated photodiode (PD), both detection methods produced comparable results (Fig. 11b) using the cut-off frequency technique (the empirical criterion of -3dB threshold regarding the plateau is depicted in Fig. 11a, for the PD spectrum at a slow flow rate). This is an empirical technique, that can be used in spectra which line shape presents a plateau, to estimate the maximum Doppler frequency corresponding theoretically to the maximum flow velocity (𝑉max) according:
𝑓3dB =2𝑛𝑉max𝜆cos𝜃, (1.6)
where θ is the angle between the laser beam axis and the scatter velocity vector; n is the refractive index of the fluid; and λ is the wavelength of the laser.
(a) (b)
Fig. 11. (a) Frequency spectra obtained for both schemes at a slow and a fast flow rates: by the junction voltage of the laser diode (LDV) and by the photodetector’s current through a transimpedance amplifier (PD). (b) Curves corresponding to the maximum Doppler frequency estimated by the -3 dB cut-off frequency from the spectra for both schemes at different flow rates (2-9 ml/min). [adapted from 25]
As the wide active area of the monitoring photodiode in a VCSEL (Fig. 12) makes it vulnerable to optical crosstalk, what is undesired for a proper OFI sensing, this new approach of detection by the laser junction voltage could benefit OFI applications based on VCSEL arrays, becoming cost effectively to manufacture a monolithic array of lasers [26].
(a) (b)
Fig. 12. (a) Microscope image of VCSEL and PD inside the TO-46 package. (b) component layout of the TO-46 package. [26]
In order to design an imaging system to obtain the velocity flow profile of a flow channel, Tucker et al. used eight individual 850-nm VCSELs with integrated PD arranged in a linear array. For each one, a single-lens configuration was provided by a block holding eight aspheric lens (Fig. 13a). Each VCSEL in the array was operated intermittently, and the first weighted moment method (with 1 = 75 Hz, which was above the low frequency noise; and 2 = 1.45 kHz, which is the
point where the spectrum decays to 3 dB above the noise floor for the smallest measured velocity) was used to compute the average flow velocity from the output power spectra.
(a) (b)
Fig. 13. (a) Prototype of the linear array of eight VCSELs individually mounted in single lens configuration. (b) photograph of the custom-made diverging-converging planar flow channel used for the experimental setup. [26]
The beams were aligned along the centerline of the flow channel (Fig. 13b) starting from the entrance of the diverging section to the exit of the converging section. The dimensions of the channel allowed for six beams to be aligned along the centerline of the flow channel. Figure 14a shows the calibration relating the first weighted moment measurement from a single VCSEL in the array at different inlet flow rates. Figure 14b reveals the measured centerline velocity profile for the flow channel.
(a) (b)
Fig. 14. (a) First weighted moment (squares) for a single channel of the VCSEL array at different inlet flow rates fitted to a quadratic function. (b) Actual (solid curve), computed by 2D flow simulation with FLUENT software, versus measured (squares) centerline velocity profile for flow channel. [26]
Although this implementation requires a switching or multiplexing circuitry for a horizontal scanning, it represents an improvement on frame rate compared to a single point scanning. For a 2D profile of the channel, it requires still a translation stage to shift vertically the channel’s position.
Lim et al. [27], also member of the team from the University of Queensland, has shown a fluid-flow imaging system based on a monolithic linear array of twelve 850-nm VCSELs that uses the laser junction voltage detection technique, also including a 2D velocity profile of the flow channel (the same one used by Tucker,
Fig. 15b) obtained in a single sweep.
He has set a double-lens optical configuration to increase the imaging resolution. As the laser pitch of the array is now much smaller (250 m, versus 5.08 mm for Tucker’s one), then, instead of using individual small lens, he has used only two lenses with active area big enough to cover whole laser array (Fig. 15a).
(a) (b)
Fig. 15. (a) Schematic diagram of the flow-channel measurement system. (b) Mechanical drawing of the custom-made flow channel (56 x 19.75 mm). The scanning distance corresponded to 43 mm across the centerline. [27]
A watery suspension made with very diluted milk (2%) was pumped into the flow channel. As the computed spectra presented always a Doppler peak corresponding to the maximum velocity (𝑉max), a curve fitting was performed to
extract the peak frequency. Then, the velocity corresponding to each pixel could be calculated by
𝑉max =2𝑛𝑓m𝜆cos𝜃, (1.7)
where θ is the angle between the laser beam axis and the scatter velocity vector (80°, for this experimental setup); λ is the wavelength of the laser (850 nm); n is the refractive index of the fluid (1.33 for 2% milk at 850 nm); and 𝑓m is the Doppler frequency peak extracted from the fitted curve of the spectrum.
Figure 16 shows the image of velocity distribution within the flow channel with an inlet flow of 15ml/min. The total image height of the 12-channel array projected onto the flow channel is 5.5 mm and the height of the flow channel window is 17.6 mm. Therefore, three consecutive horizontal scans were carried out to acquire the velocity distribution image. The horizontal step-size in the translating stage was of 1 mm.
Fig. 16. 2D distribution of the flow velocity profile across the flow channel for an inlet flow of 15ml/min. The velocities were calculated from the measured Doppler peak frequency by Eq. 1.7. Pseudo colors ranging from zero (deep blue) to 3.5 cm/s (deep red). [27]
In order to propose the combination of a VCSEL array with a motorized translating stage offering the potential to enhance the rapidity of the scanning system while obtaining a 2D Doppler image for microfluidics applications, Kliese et
al. [28], another member of the team at Queensland University, has validated his
idea using a 665-nm VCSEL in a single lens configuration to obtain with the laser junction voltage technique an image of the flow (Fig. 17) in a 100μm square cross section channel. A watery suspension made with 10% diluted milk was pumped at a constant flow rate of 5 μL/min. The Doppler angle was of 80°, formed between the laser axis and the microchannel.
(a) (b)
Fig. 17. (a) Microfluidic channel pattern. (b) Spectrogram obtained from the OFI signal as the laser was scanned at a rate of 1 mm/s over the centerline of the right portion of the microchannel (the broken lines indicate the channel positions). [28]
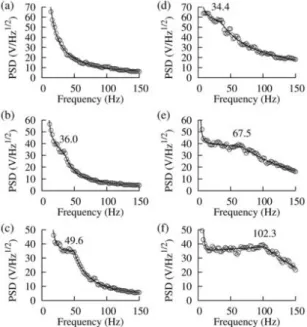
Taking advantage, for the first time, of the blue emitting (GaN 405 nm) laser diode for OFI sensing, Kliese [29] had also shown that although the blue laser has poorer noise performances than the near-IR laser, its shorter wavelength enables to accurately measure very low flow rates down to 26 μm/s in a 1.81mm diameter tube, while pumping a watery suspension made of 3.06 μm polystyrene microspheres at so low particle concentration that the refractive index of the medium was equivalent to the one of the water. The Doppler angle was of 75° between the laser axis and the flow tube.
Figure 18 indicates that the 783-nm IR laser was unable to measure the lowest flow rate of 25.9 μm/s.
Fig. 18. Averaged OFI spectra for the flow experiments. Results (a)–(c) are for the IR laser, and results (d)–(f) are for the blue laser. The corner frequency for each of the signals is indicated. The maximum flow rate for the results in (a) and (d) was 25.9 μm/s, the rate for (b) and (e) was 51.8 μm/s, and the rate for (c) and (f) was 77.7 μm/s. [29]
On the context of the way forward the OFI sensing integration into the microfluidics system for flowmetry applications, Nikolić et al. [30], from the same team at the University of Queensland, integrated an optical fiber directly into a polydimethylsiloxane (PDMS) microfluidic circuit to couple the laser into a 720-μm
microchannel (Fig. 19), instead of using bulk free-space optics. The laser light source (850nm VCSEL) was coupled into the distal end of the fiber embedded in the optofluidic circuit. Obtaining the OFI signal directly from the junction voltage of the VCSEL, this flow sensor has shown to exhibit feasibility over a range of fluid velocities from 0.5 to 60 mm/s for four bovine milk concentrations: 100%; and 10% w/w, 1% w/w, and 0.2% w/w diluted in water.
Fig. 19. Device manufacture showing (a) top view with inset showing photograph of the finished device and (b) front view. An optical fiber was stripped and cleaved at one end and glued into a 25G dispensing needle tip for rigidity. This needle tip and a 22G tip were arranged in a Petri dish with standoffs and PDMS was poured to cover both needles. After PDMS curing, the hatched section of PDMS was removed and the 22G tip was pulled out, leaving a microchannel. The angle between the fiber and the channel, θ, was approximately 74°. [30]
1.1.2. Velocity flow profile
Nikolić et al. [31], in partnership with Campagnolo et al. from the LAAS-OSE
team of the University of Toulouse, has also used the 665-nm VCSEL (with the laser junction voltage detection method) associated to a computer-controlled 3-axis motorized translation stage to place the center of the microchannel in the focal plane, and move it across the laser sensing volume for scanning. For that, they had improved the spatial sensing resolution by using a double lens configuration (Fig.
20a) what reduces the sensing volume, to accurately reconstruct, by the first time,
the velocity profile (Fig. 20b) of a laminar flow in a 320μm diameter microchannel with less than 2% of standard deviation.
(a) (b)
Fig. 20. (a) Diagram of the experimental setup. (b) Theoretical (by Eq. 1.7, with =76°) and experimental (10μm step resolution) flow profiles. [31]
Considering the context of potential biomedical application for OFI flowmetry in microvascular research, Campagnolo et al. [32], using the same VCSEL setup (now, with the optical head mounted in the translation stage, instead of the flow channel) demonstrated the feasibility of OFI flowmetry in a small rectangular polydimethylsiloxane (PDMS) microchannel of only 20 μm height, 100 μm wide (Fig. 21a). The measured flow profile was validated by the profile measured using a dual-slit (DS) technique (Fig. 21b). The fluid used was a 0.1% particle suspension of 4 μm latex microsphere, pumped at a low flow rate of 0.1 to 1 μL/min. The maximal flow velocity was measured by the 3dB cut-off frequency method.
(a) (b)
Fig. 21. (a) Diagram of the experimental setups: OFI (left) and DS (right). (b) Normalized profiles of maximal velocity measured in a rectangular PDMS channel (100 x 20 μm), using OFI (blue dashed curve) and DS (red plotted curve. The theoretical curve (solid green) is added for reference. [32]
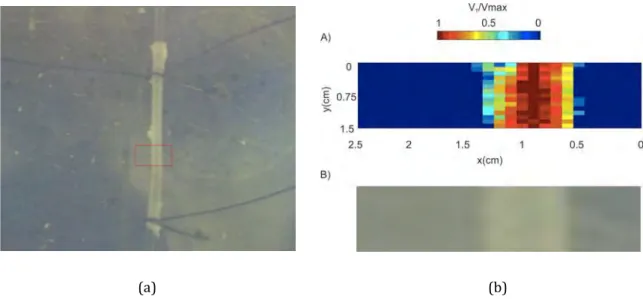
Quotb [33] has demonstrated the feasibility to use an OFI sensor (a 785nm laser diode in a single-lens configuration) for flow characterization inside ex-vivo rat aorta (diameter: ≈850μm). The OFI signal was exploited from the built-in photodiode’s (PD) current through a transimpedance amplifier. In validation, a fluid composed by a ratio of 10:1 of phosphate buffered solution and milk was pumped in constant flow rate, and a raster 2D Doppler image (25x15, with a pixel resolution of 100 μm) was obtained as illustrated in Fig. 22.
(a) (b)
Fig. 22. (a) Cannulated rat aorta: red rectangle corresponds to OFI scanned area. (b) Rat aorta imaged: A) 2D raster Doppler image of the flow velocity (VT) normalized by the maximum flow velocity Vmax, captured by the
OFI sensor in a 3-axis translation stage. The pixel intensity corresponds to the maximum Doppler peak. B) raw image of the scanning zone captured by a camera. [33]
Ramirez Miquet [34] has presented an OFI flowmetry sensing using a 785nm laser diode with built-in PD (mounted with single-lens) in a millifluidic configuration for real-time assessment and characterization of non-steady flows, with in-situ calculation of the zeroth order moment of the OFI signal obtained from the PD, allowing to easily evaluate the related periodicity of non-steady flows of a peristaltic pump. This calculation consists on the integration of the amplitude differences in the spectrum (in dB) of a set of OFI signals with and without flow. This process is expressed by
𝑀𝑓 = ∑ |𝑂𝐹𝐼𝑓𝑙𝑜𝑤− 𝑂𝐹𝐼𝑛𝑜 𝑓𝑙𝑜𝑤| 𝑓𝑚𝑎𝑥=𝐹𝑠/2
𝑓𝑚𝑖𝑛=0
where 𝑓 is the frequency in the spectrum which ranges from 0 to half the sampling frequency (𝐹𝑠) of the acquisition system, 𝑂𝐹𝐼𝑛𝑜 𝑓𝑙𝑜𝑤 is the obtained spectrum when the fluid does not move, 𝑂𝐹𝐼𝑓𝑙𝑜𝑤 is the spectrum when the fluid is moving and Mf is a parameter related to the flow variations. Figure 23 reveals the linear trend of relationship between the flow rate and 𝑀𝑓.
(A) (B)
Fig. 23. (A) Overview of proposed method performing over a continuously acquired time domain OFI signal (a). Spectrums of 𝑂𝐹𝐼𝑓𝑙𝑜𝑤 and 𝑂𝐹𝐼𝑛𝑜 𝑓𝑙𝑜𝑤 (b) and their difference (c). (B) Linear relationship of Flow rate
versus 𝑀𝑓. [34]
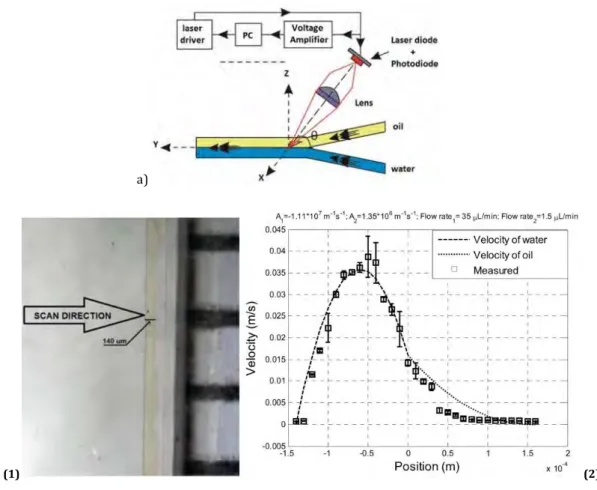
Ramirez Miquet [35], using the 785 nm laser diode (with built-in PD) in a single-lens configuration (Fig. 24a), has also demonstrated measurement of the flow profile of two viscous immiscible fluids (oil-water) in good agreement with the expected theoretical profile (Fig. 24b). This represents a step forward for the OFI sensing in the field of interface flow characterization at complex phase interactions, like on the hydrodynamics of droplets or dispersed flows.
a)
b) (1) (2)
Fig. 24. a) Experimental setup (optical head mounted over a computer-driven 3D-stage) with =80°. b) (1) Volume occupied by each fluid (oil-water). Betadine was added in water to enhance the contrast between both fluids. (2) Both measured (squares with error bars for three measured maximal velocity profiles) and simulated (dashed and dotted lines) reconstructed profiles. [35]
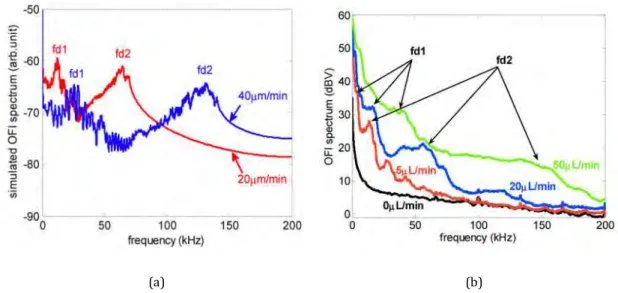
Zhao [36] has presented a new numerical modeling based in Monte Carlo ray-tracing simulation for OFI flowmetry spectrum reproduction, in order to study the optical effect on the OFI signal due to the micro-scale geometry of the channel. This model has permitted the prediction of a second Doppler peak in the spectra for a 100 μm square cross section SU-8 channel, while using a 670nm VCSEL with double-lens configuration. At experimental level, the OFI signal acquired from the built-in photodiode presented a second Doppler peak (Fig. 25), as predicted by the model, due to the reflection of the forward scattering by the rear interface of the micro-rector. The experimental validations were performed using a polystyrene spheres suspension at low concentration (5 x 10⁶ spheres per mL) pumped at constant flow rate (from 5 μL/min to 50 μL/min).
(a) (b)
Fig. 25. a) Simulated OFI power spectra obtained for different flow rates (Q = 20 μL/min in red and 40 μL/min in blue). Two Doppler peaks (fd) are well denoted, where fd1 arises from the forward scattered light reflection on the rear interface, and fd2 corresponds to the maximum velocity. b) Measured OFI spectra at following flow rates: 0 μL/min (black), 5 μL/min (red), 20 μL/min (blue) and 50μL/min (green). [36]
A. Alexandrova [37] has used an OFI sensor to measure fluid velocity of watery suspensions of 1 μm-diameter Titanium Dioxide (TiO2) spheres in order to
evaluate the effect of the seeding particle concentration and also of the fluid flow rate in the measurements. The sensor revealed an accuracy better than 10% for liquid flow speeds up to 1.5 m/s with scattering particle concentration ranging between 0.03%-0.8% w/w. While keeping the same particle concentration, it has been demonstrated that increasing the pumping speed reduces the amplitude of the spectral Doppler peak, broadening the frequency distribution as well. The Fig.
26a shows the computed spectra of the OFI signal at a constant liquid velocity of
1.2 m/s, and varying the amount of seeded particles in the pumped suspension. The
Fig. 26b reveals the related variations of the amplitude and frequency of the
spectral Doppler peak. The amplitude of the spectral Doppler peak decreases steadily with decreasing concentration.
Fig. 26. (a) Computed spectra in experiments with different particle concentrations in water: 0.8%, 0.36% ans 0.12%. (b) Experimental dependence, after subtracting the noise, of the amplitude of the spectrum peak (left axis), and the Doppler peak frequency (right axis), on the particle concentration. [37]
F. Marrazzi [38] has demonstrated that a proper conditioning of the OFI signal related to in-vivo perfusion measurements from human tissues can overcome the usual issue of quantization errors. This can be obtained by first separating the DC part from AC part of the OFI signal, then amplifying only the AC one, and finally recombining both signals before digitalization. This leads to less noisy signal with a smaller standard deviation and thus a higher sensitivity to physiological changes of the perfusion parameters. The approach was validated with in-vivo measurements over the fundus of human eye, successfully presenting a smaller standard deviation than a commercial Laser Doppler flowmeter device.
The Doppler frequency shift approach has been the mostly used, but it is not the unique way to sense flows with the OFI technology.
1.1.3. Speckle approach in OFI
As well as the Doppler approach, the time-varying speckle can be used to measure velocities by OFI, especially for measurement of line-of-sight velocities (velocity projection along the optical axis). [39, 40].
The OFI speckle velocimetry methods are based on the time domain statistics of the dynamic speckle patterns. These methods are usually whether based on counting speckle pulses (generated each time the OFI signal intensity passes above a defined threshold) over the measurement time, in order to obtain a mean speckle frequency in relation with the target velocity; or on the autocorrelation [41] of the OFI signal, as the autocorrelation time (τc) of the speckle intensity fluctuations is related to the fluid velocity.
Using a 785 nm laser diode, Ozdemir [42, 43] has shown the capability to apply the OFI speckle sensing approach in flowmetry applications to assess in-vivo blood perfusion (up to 150 mm/s) using both methods, after validations in-vitro (Fig. 27). The autocorrelation method has revealed to be better than counting method to discriminate among three blood flow conditions (normal, constricted and enhanced) for in-vivo measurements performed over the skin (along visible blood vessels of the wrist) of healthy volunteers.
Fig. 27. Results from in-vitro mesurements of 1% blood suspension perfusion in a 2-mm inner diameter transparent capillary by an OFI speckle velocimeter using counting (left graph) and autocorrelation (right graph) methods. The dotted lines represent the best linear fit with 99% correlation to the experimental data. The squares correspond to the measurements standard deviations. [43]
Figueiras [44] has applied an invasive OFI microprobe (with a pigtailed laser diode) directly over the rat brain tissue in order to measure blood perfusion variations in the hippocampus region promoted by intraperitoneal injection of sodium nitrite. The discriminations of the perfusion variations were successfully detected by four signal processing statistical methods, based on time-varying speckle (counting and autocorrelation methods) and spectral based (raw 0th and 1st order moments). The validations, were performed in different animals using two laser wavelengths (785 and 1308 nm) inside the diagnostic window range (600-1600 nm), and the results were successfully compared to a commercial laser Doppler flowmeter device.
In their study Ozdemir et al. have highlighted the fact that the OFI speckle detected signal is very dependent on the back-coupled speckle field; the beam spot size [45] on the scatterer; and on the precise adjustment and control of the distance between the laser front facet and the target scatterer, in order to properly resolve the average speckle size back into the laser facet.
Also, the relative velocity measurements based on the autocorrelation method vary accordingly the integration time (Δt) considered [43] in the time-varying speckle computation by autocorrelation. In same way, for the ones based on the counting method, the threshold setting to trigger the pulse train can induce measurement variations affecting the velocity sensing accuracy.
It’s pertinent to mention that the modulation of the laser light by the retro-injected backscattered light from external artefacts and from the target surfaces can induce intensity fluctuations in the speckle signal leading to an offset value in both methods, even at no flow condition, and that such offset varies accordingly to the scattering properties of these artefacts [41].
For these reasons the OFI speckle approach requires considerable calibration to overcome these drawbacks in order to achieve an absolute velocity measurement. But under certain conditions, like for most in-vivo situations, calibrations are unfeasible.
Still on the sensing context of the speckle approach, we should highlight that there is also a strong dependence on the angle (θ) between the laser beam and the vector velocity of the moving target under measurement. The mechanical setup must be set to impose ideally θ = 90° to obtain the best of the speckle effect. When θ ≅ 90°, the intensity fluctuations induced by the speckle effect are predominant, while the Doppler shift tends to zero. In that way, the speckle effect will dominate the dynamics of the laser diode under optical feedback, and the output power modulation will become random [41]. Such random variations in the OFI signal (exploited from the built-in photodiode’s current) will be detected as speckle signal, and a time-varying speckle signal can be acquired and computed by autocorrelation while a target moves across the laser sensing volume to measure the related target’s velocity.
Although the laser speckle has been studied since the sixties together with the advent of the laser itself, it’s only since a few years that the speckle sensing potential has started to be explored on laser diodes under optical feedback. Much of the speckle statistical properties still needs to be understood, especially in the fluidics field. For example, to the best of our knowledge, there isn’t yet published work on the evaluation of the impact of the scatterer concentration, with the known signal processing methods.
1.2. The scattering regimes
In the context of a diode laser under optical feedback due to the interaction of the laser beam with flowing particles embedded in the a fluid, the particle concentration is an important element that affects the laser behavior.
When the particle concentration is low enough in a way that adjacent particles are sufficiently away from each other, a single or independent scattering can occur. Then, each photon is scattered by only one translating particle at the time. In other words, such photon suffers a unique Doppler shift before re-entering the laser cavity. In that
way, each particle owing a unique velocity is considered as an elementary scattering unit in a macroscopic medium composed of randomly positioned discrete particles.
In order to validate the single scattering hypothesis, theoretical studies [46] have been performed in order to evaluate and identify a clear rule for the definition of the single scattering regime. According to Quirantes [47] and Sudo [48], the effect of interactions between particles near to each other is mostly dependent on the particle size and concentration, showing that the single scattering regime is achieved as long as an interparticle separation equal to four times the particle radii for Quirantes, while for Sudo, the effect of particle interactions becomes significant when the solid volume fraction in a particle suspension is greater than 5%, or the average inter-particle spacing is smaller than the laser wavelength.
In the case of high densities of flowing particles, the photons may be scattered (and thus Doppler shifted) several times by different scatterers before the retro-injection in the laser cavity. This condition is known as the multiple scattering regime, and the resulting OFI output power signal corresponds to a distribution of Doppler shifts, correlated to the backscattering from a plurality of scatterers with multiple Doppler shifts at different relative velocities and different incident angles.
1.3. Laser Diode OFI theory for a multiplicity of single scatterers
Considering the context of a diode laser under optical feedback due to the interaction of the laser beam with flowing particles embedded in a fluid, we recall here the established equations that model the laser diode operation behavior under the feedback condition caused by mutiple scatters.
There are two classical ways to describe the laser diode behavior under optical feedback: the 3-mirror cavity model and the Lang-Kobayash model [49].
In the first one, where the target works as the third mirror, a 2-mirror equivalent cavity can be obtained, from which the laser rate equations can be deduced. So under single scattering regime, summing up all the back-scatterred
contributions from each particle as target, we can finally obtain the laser power output under optical feedback.
In the second approach, the optical feedback can be seen as a perturbation of the free running laser mode, and so an extra term can be directly added to the electrical field or photon rate equation representing the contribution of the back-scattered light.
A comparison between both approaches has been considered [50], and it has been demonstrated that although the cavity method is a more exact description, the Lang-Kobayashi model is well suited for low feedback levels and quasi-steady state analysis of the phenomenon.
In the case of microfluidic sensing from particle suspensions in single scattering regime the feedback level is always very low, what justify the use of Lang-Kobayashi method, as proposed by Zakian [51, 52], later reviewed and validated by R. Miquet [53], as we follow here.
The Lang-Kobayashi rate equation of the electric field E propagating inside the laser cavity and that is subject to an external perturbation is here used as base for the modeling approach:
𝑑
𝑑𝑡[𝐸(𝑡) exp(𝑗𝜔𝑡)] = [𝑗𝜔𝑁+
1
2 Γ𝐺(𝑁 − 𝑁tr)] 𝐸(𝑡) exp(𝑗𝜔𝑡) + 𝐸𝑓(𝑡) (1.8)
where 𝜔 is the laser mode angular frequency; 𝜔𝑁 is the cavity mode angular
frequency (𝜔𝑁 = kπc/𝑛𝑐𝐿𝑐 with 𝑘 an integer; 𝐿𝑐 the laser cavity length and 𝑛𝑐 the
refractive index); Γ stands for the laser mode confinement factor; 𝐺 is the stimulated emission gain; 𝑁 is the carrier density; 𝑁tr is the carrier density at transparency; and 𝐸𝑓(𝑡) is the external feedback induced perturbation term.
contribution from each one retro-injected into the laser cavity as:
𝐸𝑓(𝑡) = ∑ 𝐸𝑖 𝑓𝑖(𝑡) (1.9)
where each 𝐸𝑓𝑖(𝑡) corresponds to:
𝐸𝑓𝑖(𝑡) = 𝑘𝑖
𝜏𝐶𝐸(𝑡 − 𝜏𝑖)exp [𝑗(𝜔 + 𝜔𝐷𝑖)(𝑡 − 𝜏𝑖)
(1.10)
where 𝜏𝐶 is the laser cavity round-trip time of flight (𝜏𝐶 = 2𝑛𝐶𝐿𝐶/𝑐, where 𝑐 is speed of light); 𝜏𝑖 is the external cavity round-trip time of flight (𝜏𝑖 = 2𝑛ext𝑖𝐿ext𝑖/𝑐) for each flowing particle characterized by its own reflectivity (𝑛ext𝑖), located at a particular distance (𝐿ext𝑖), and tracking a specific velocity 𝑉𝑖 accordingly the flow
profile, which induces a Doppler shift (𝑓𝐷𝑖 = 𝜔𝐷𝑖/2𝜋) corresponding to the line-of-sight velocity (particle velocity projection along the optical axis) as 𝜔𝐷𝑖 = 𝜔2𝑉𝑖/(𝑐 + 𝑉𝑖); and 𝑘𝑖 is the feedback coupling coefficient for each particle, defined
as:
𝑘𝑖 = (1 − 𝑟22)𝑟ext𝑖𝑟2 (1.11)
with 𝑟2 the reflectivity of the laser front facet mirror and 𝑟ext𝑖 the ratio of the
back-scattered power actually retro-injected into the laser cavity over the laser emitted power.
Now considering the approximations of the quasi-steady state regime [E(t − τ)~E(t)] , which are feasible due to the fact that the Doppler shift corresponds to a very low frequency regarding to the laser optical frequency, then:
𝑑𝐸(𝑡) 𝑑𝑡 = 1 2Γ𝐺(𝑁 − 𝑁tr)𝐸(𝑡) + ∑ 𝑘𝑖 𝜏𝐶𝐸(𝑡)cos (𝜔𝐷𝑖𝑡 + 𝜙𝑖) 𝑖 , (1.12)
𝑑Φ(𝑡) 𝑑𝑡 = 1 2αΓ𝐺(𝑁 − 𝑁tr) + ∑ 𝑘𝑖 𝜏𝐶𝑠𝑖 𝑛(𝜔𝐷𝑖𝑡 + 𝜙𝑖) , 𝑖 (1.13) 𝑑𝑁(𝑡) 𝑑𝑡 = 𝐼 𝑞𝑉𝑎− 𝐺(𝑁 − 𝑁tr)𝑆 − 𝑁 𝜏𝑁, (1.14)
where 𝜙𝑖 is a random phase; Φ is the phase term of the electric field 𝐸; α is the
linewidth enhancement factor; 𝑞 is the elementary charge; 𝑉𝑎 is the laser active volume; 𝜏𝑁 is the carrier lifetime and 𝑆 is the photon density which is linked to the electric field amplitude by S ∝ E ∙ E∗, which allows Eq. (1.12) be rewritten as:
𝑑𝑆(𝑡) 𝑑𝑡 = 𝐺(𝑁 − 𝑁th)𝑆(𝑡) − 𝑆(𝑡) 𝜏𝑆 + ∑ 𝑘𝑖 𝜏𝐶𝑆(𝑡)cos (𝜔𝐷𝑖𝑡 + 𝜙𝑖) 𝑖 , (1.15)
where 𝑁th is the carrier density at threshold, and 𝜏𝑆 is the photon lifetime. Following the very same methodologies as [50, 54] to solve the set of Eq. (1.12)-(1.15) for the quasi-steady state, leads to:
𝜔𝐹− 𝜔0 = √1 + 𝛼2+ ∑𝑖𝜏𝑘𝐶𝑖𝑠𝑖𝑛 [𝜔𝐷𝑖𝑡 + 𝜙𝑖 + atan(𝛼)], (1.16)
𝑆𝐹 = 𝑆0[1 + ∑𝑖2𝜏𝜏𝐶𝑠𝑘𝑖cos (𝜔𝐷𝑖𝑡 + 𝜙𝑖)], (1.17)
where 𝜔𝐹 and 𝜔0 are the laser angular frequency with and without feedback respectively, and 𝑆𝐹 and 𝑆0 are the photon densities under similar conditions. So as the laser emitted power variations are proportional to the photon density, we can re-write from Eq. (1.17):
𝑃𝐹 = 𝑃0[1 + ∑ 𝑚𝑖 𝑖cos (𝜔𝐷𝑖𝑡 + 𝜙𝑖)], (1.18)
where 𝑚𝑖 corresponds to the modulation index regarding the ith particle, as
It pertinent to mention that despite the Doppler shift 𝜔𝐷𝑖 is function of 𝜔𝐹,
for fluids where the optical feedback is very weak, the fluctuations in the laser frequency can be ignored for the calculation of the optical power variations.
1.4. Motivations of the present thesis
The Doppler OFI technology based in laser diodes has been extensively developed, demonstrating its recent potential to be applied in several fluidics sensing applications. The constant progress of these applications at micrometric scale opens high resolution 2D Doppler imaging for biological and chemical flows, and the capability of single particle detection and velocimetry as well.
That type of compact and embedded sensors is still very promising for a research and industrial field –microfluidics – that is itself a growing domain of activities, at the frontiers of the physics, the chemical science, the biology and the biomedical. The sensors that have been proposed so far are not able to provide further information on the nature of the particles flowing, so the capability of particle characterisation is a major challenge.
Our present research is focused on the implementation, validation and evaluation of the sensing performances of the OFI technology in both chemichal and biomedical fields of applications. The object of the present thesis is the elaboration of a new generation of sensors, that will provide both a high spatial resolution for imaging laminar flows as well as to give further information on the flowing particles concentrations and dimensions, opening a new domain of OFI research in the field of micro and nanoparticles characterizations.
We have chosen the Doppler approach with the evaluation and improvement of the signal processing methods in the spectral domain. Beyond the reasons, drawbacks, risks and limitations already enumerated against the Speckle approach, this method would be also unfeasible to explore potential applications for particle characterization, especially for cytometry, which requires capability of single micro and nanoparticle detection.
spectral domain, and the suitable signal processing methods associated to an innovating optical configuration including a diffraction grating to accurately measure the flow velocity at single or multiple scattering regimes, especially considering the complexity of flow velocity measurements handling with different flow rates and concentrations.
We propose the design, validation and evaluation of a 2D Doppler imager based in a single 2-axis beam-steering mirror mounted on a MEMS, taking the full advantage of the compactness offered by the OFI sensing scheme. The compactness of the MEMS mirror allows the design of an embedded imaging system in a compact handheld case that provides quantitative information about the velocity of fluids. A clinical study with patients has been performed for potential application of this system in the biomedical field of skin cancer diagnosis.
The research conducted here open the path to potential applications in the field of particle characterization and cytometry with the development of an innovative technique to detect single micro and nanoparticles in a watery suspension made with polystyrene spheres at very low concentration. We investigate also, for instance, the possibility to detect bigger particles seeded at very low concentration in an aqueous suspension of smaller ones. In this case, the technique can suggest a potential application in the biomedical field for blood clot (thrombus) detection.
Beyond that, while other technologies require manipulation of the fluid, tending towards always smaller volume handling with precise flow and concentration control in order to size particles at macro or nano scale, we propose the use of the OFI technology to quantify the particle size and concentration with fluids.
![Fig. 2. OFI signal power spectra for various flow rates with 2% w/w milk dilution in water [20]](https://thumb-eu.123doks.com/thumbv2/123doknet/2961227.81470/56.892.165.730.130.457/fig-signal-power-spectra-various-rates-dilution-water.webp)
![Fig. 4. OFI signal power spectra for various flow rates with 100% milk solution [20]](https://thumb-eu.123doks.com/thumbv2/123doknet/2961227.81470/58.892.162.734.130.463/fig-ofi-signal-power-spectra-various-rates-solution.webp)
![Figure 5 displays the theoretical velocity profiles calculated according [39] (pp. 197-198, equations 335-338)](https://thumb-eu.123doks.com/thumbv2/123doknet/2961227.81470/60.892.105.769.425.970/figure-displays-theoretical-velocity-profiles-calculated-according-equations.webp)
