DOCTORAT DE L'UNIVERSITÉ DE TOULOUSE
Délivré par :Institut National Polytechnique de Toulouse (INP Toulouse) Discipline ou spécialité :
Micro-ondes, Électromagnétisme et Optoélectronique
Présentée et soutenue par :
M. EVELIO ESTEBAN RAMIREZ MIQUETle jeudi 29 septembre 2016
Titre :
Unité de recherche : Ecole doctorale :
IMPLEMENTATION OF OPTICAL FEEDBACK INTERFEROMETRY FOR
SENSING APPLICATIONS IN FLUIDIC SYSTEMS
Génie Electrique, Electronique, Télécommunications (GEET)
Laboratoire d'Analyse et d'Architecture des Systèmes (L.A.A.S.) Directeur(s) de Thèse :
M. JULIEN PERCHOUX M. OSCAR SOTOLONGO COSTA
Rapporteurs :
M. ALAIN LE DUFF, GROUPE ESEO ANGERS M. ERIC LACOT, UNIVERSITE GRENOBLE ALPES
Membre(s) du jury :
1 Mme ANNE HUMEAU-HEURTIER, UNIVERSITE D'ANGERS, Président
2 M. JULIEN PERCHOUX, INP TOULOUSE, Membre
2 Mme KARINE LOUBIERE, INP TOULOUSE, Membre
Doctorat de l’Université de Toulouse
Institut National Polytechnique de Toulouse
Implementation of optical feedback interferometry for sensing
applications in fluidic systems
Evelio Esteban RAMIREZ MIQUET
Directeurs de thèse
Dr. Julien Perchoux
Prof. Oscar Sotolongo Costa
ii
Abstract
Optical feedback interferometry is a sensing technique with relative recent implementation for the interrogation of fluidic systems. The sensing principle is based on the perturbation of the laser emission parameters induced by the reinjection in the laser cavity of light back-scattered from a distant target. The technique allows for the development of compact and non-invasive sensors that measure various parameters related to the motion of moving targets. In particular, optical feedback interferometers take advantage of the Doppler effect to measure the velocity of tracers in flowing liquids. These important features of the optical feedback interferometry technique make it well-suited for a variety of applications in chemical engineering and biomedical fields, where accurate monitoring of the flows is needed. This thesis presents the implementation of optical feedback interferometry based sensors in multiple fluidic systems where local velocity or flow rate are directly measured. We present an application-centered study of the optical feedback sensing technique used for flow measurement at the microscale with focus on the reliability of the signal processing methods for flows in the single and the multiple scattering regimes. Further, we present experimental results of ex vivo measurements where the optical feedback sensor is proposed as an alternative system for myography. In addition we present a real-time implementation for the assessment of non-steady flows in a millifluidic configuration. A semi-automatized system for single particle detection in a microchannel is proposed and demonstrated. Finally, an optical feedback based laser sensor is implemented for the characterization of the interactions between two immiscible liquid-liquid flowing at the microscale, and the measurement is compared to a theoretical model developed to describe the hydrodynamics of both fluids in a chemical microreactor. The present manuscript describes an important contribution to the implementation of optical feedback sensors for fluidic and microfluidic applications. It also presents remarkable experimental results that open new horizons to the optical feedback interferometry.
Keywords: Optical feedback interferometry; laser diodes; microfluidics, flow measurement; Doppler Effect.
iii
Résumé
L'interférométrie par réinjection optique est une technique de mesure dont l'implémentation pour l'interrogation de systèmes fluidiques est assez récente. Le principe de mesure est basé sur la perturbation des paramètres d'émission du laser induite par la réinjection dans la cavité laser de lumière rétro-diffusée par une cible distante. La technique permet le développement de capteurs compact et non-invasifs qui mesurent différents paramètres liés aux déplacements de la cible. En particulier, les interféromètres par réinjection optique prennent avantage de l'effet Doppler pour mesurer la vitesse de traceurs dans les liquides en écoulement. Cet aspect important de la technique de réinjection optique la rend adaptée à une grande variété d'applications dans les domaines du génie chimique et du biomédical où un contrôle des écoulements est requis. Cette thèse présente l'implémentation de capteurs basés sur la réinjection optique pour différents systèmes fluidiques où la vitesse locale d'écoulement ou le débit sont directement mesurés. Nous présentons une étude centrée sur les applications où la réinjection optique est utilisée pour la mesure du débit à la micro-échelle avec en particulier une analyse de la robustesse des méthodes de traitement du signal propres aux régimes de diffusion simple et de diffusion multiple. Par ailleurs, nous présentons des résultats expérimentaux de mesures ex vivo où le capteur par réinjection optique est proposé comme alternative pour la myographie. Nous présentons également une implémentation temps réel pour l’estimation du débit instantané d'écoulements dynamiques dans une configuration milli-fluidique. Un système semi-automatisé de détection de particule unique dans un micro-canal est proposé et démontré. Enfin, un capteur basé sur la réinjection optique est implémenté pour la caractérisation des interactions entre deux fluides immiscibles en écoulement à micro-échelle et les mesures réalisées sont comparées à un modèle développé afin de décrire le comportement hydrodynamique des deux fluides dans un micro-réacteur. Le manuscrit décrit une contribution importante pour l'implémentation de capteur par réinjection optique pour des applications fluidiques et en particulier micro-fluidiques. Il présente également des résultats expérimentaux remarquables qui ouvrent de nouveaux horizons pour l'interférométrie à réinjection optique.
Mots clés: Interférométrie par réinjection optique; Diode laser; Micro-fluidique; Mesure de débit; Effet Doppler
iv
Acknowledgments
I would like to express my deepest gratitude to those who contributed one way or another to the realization of the present thesis.
I thank Prof. Thierry Bosch for giving me the opportunity to join the OSE group at LAAS-CNRS. His continuous disposition and kindness will always be appreciated and remembered. I have no words to express my gratitude and respects to my supervisor Dr. Julien Perchoux. Your constant guidance and advices pave the way to finally complete this goal. I sincerely say thanks for your tuition every step of the way. Likewise, I fully thank Prof. Oscar Sotolongo Costa for accepting to supervise my thesis work and for his continuous encouragements and wise advices through the course of these years. It was indeed an honor to have you both as my supervisors.
I wanna hereby acknowledge the contributions of my colleagues and friends who collaborated in the development of the present work, particularly those with whom I had the honor to work with: Lucie Campagnolo, Bendy Tanios, Adam Quotb, Antonio Luna Arriaga, Reza Atashkhooei, Raül da Costa Moreira and Yu Zhao. I really enjoyed the time we spent together in and outside the lab! The help provided by Véronique Conédéra and Rémi Courson in the clean room is equally appreciated.
To my dear fellows, I take a chance to reflect here that you will always be remembered as part of the greatest moments in my lifetime. Thank you for all we shared together my friends Jalal Al Roumy, Laura Le Barbier, Lavinia Ciotirca, Lucas Perbet and Blaise Mulliez, Fernando Urgiles, Harris Apriyanto and Mengkoung Veng. I equally appreciate the time spent with the
stagiaires José Luis, Alejandro, Einar and Fadila as well as the research engineers Valeria,
Allaoua and Gautier.
Likewise, the valuable help and technical assistance provided by Clément Tronche and Francis Jayat is highly appreciated. Thank you both for your disposition. Likewise, I show gratitude for Emmanuelle Tronche and the assistance provided with the intensive paperwork. I also thank the rest of the members of the OSE group: Francis Bony, Olivier Bernal, Hélène Tap and Han Cheng Seat.
This thesis is a final step in the research that I conducted in the field of Optical Feedback Interferometry, a technique I learned thank to my former supervisor Prof. Luis Martí López back in 2009.
The help provided by the Centro de Aplicaciones Tecnológicas y Desarrollo Nuclear in Havana is gratefully appreciated, especially from its former director Dr. Iván Padrón and the members of the Physics Department who guided me to the conceptualization and realization of the joint co-tuition of the present thesis.
… And the support and continuous encouragements of my family, especially my mother, Marlem, my grandma, my sister and Yancy who were there for me wherever it was necessary. Thanks!
I acknowledge the financial support provided by the French Embassy in Havana that allowed the funding of the present research work.
v
Contents
Introduction ... 1
Chapter 1: Doppler systems for flow parameter measurements ... 5
1.1 Laser Doppler Velocimetry ... 6
1.1.1 History ... 6
1.1.2 Sensing principle ... 8
1.1.3 Recent developments and commercialization ... 10
1.2 Ultrasound Doppler Velocimetry ... 11
1.2.1 History ... 11
1.2.2 Sensing principle ... 13
1.2.3 Recent developments and commercialization ... 14
1.3 Optical Doppler coherence tomography ... 15
1.3.1 History ... 15
1.3.2 Sensing principle ... 16
1.3.4 Recent developments... 18
1.4 Planar Doppler velocimetry ... 19
1.4.1 History ... 19
1.4.2 Sensing principle ... 19
1.4.3 Recent developments and commercialization ... 22
1.5 Three Component laser two-focus velocimetry ... 23
1.5.1 Laser two-focus velocimetry ... 23
1.5.2 3C-Doppler-L2F Velocimetry ... 24
1.6 Optical feedback flowmetry ... 25
1.6.1 History ... 25
1.6.2 Sensing principle ... 26
1.6.3 Particular features of optical feedback interferometry ... 26
1.7 Comparison of the methods ... 27
1.8 Motivations of the present thesis ... 29
Chapter 2: Optical feedback interferometry for flows: theoretical fundaments .... 31
vi
2.1.1 Particular features of the interaction laser-fluid ... 32
2.1.2 Theoretical approaches for laser-particles interaction: scattering theories .... 33
2.1.3 The scattering regimes ... 36
2.2 Theory of optical feedback applied to multiple scatterers ... 39
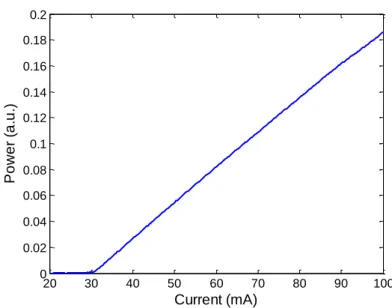
2.3 Laser characterization under weak feedback ... 44
2.3.1 Infrared laser characterization ... 46
2.3.2 Blue-violet laser characterization ... 49
Chapter 3: Optical feedback interferometry in fluid flow sensing... 53
3.1 Reliability of optical feedback interferometry ... 54
3.1.1 Processing methods ... 54
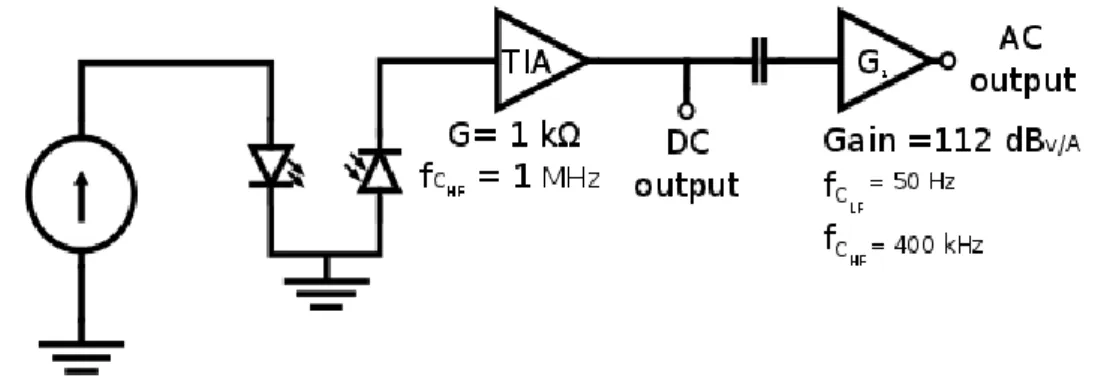
3.1.2 Sensor description ... 56
3.1.3 Channel description ... 57
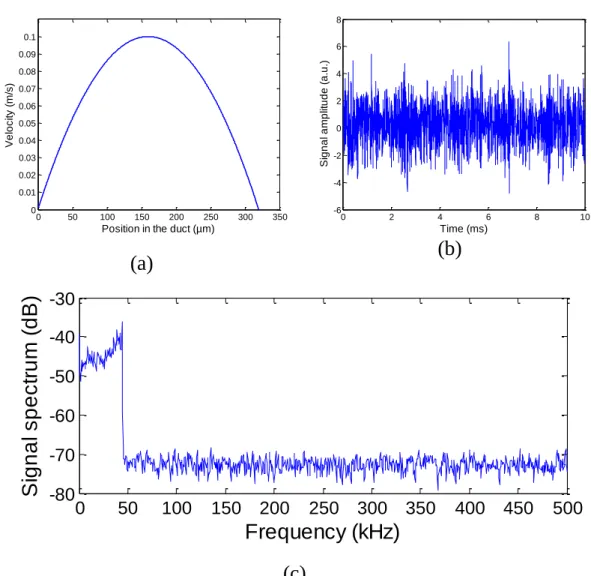
3.1.4 Velocity measurement at channel center ... 57
3.1.5 Zero order moment for various moving particle concentrations ... 65
3.1.6 Velocity profile measurement ... 67
3.2 Ex-vivo velocity profile measurement ... 69
3.2.1 OFI pressure myograph sensor ... 69
3.2.2 Experiment... 71
3.2.3 Signal processing ... 71
3.2.4 OFI flow mapping ... 72
3.3 Non-steady flow assessment ... 74
3.3.1 Signal processing ... 74
3.3.2 Real time implementation... 75
3.3.3 Experimental setup ... 76
3.3.4 Unsteady flow interrogation ... 77
3.3.5 Non-steady flow velocity measurement ... 80
3.4 Single particle characterization ... 81
3.4.1 Signal detection and processing ... 82
3.4.2 Particles, flowchannel and experiment... 83
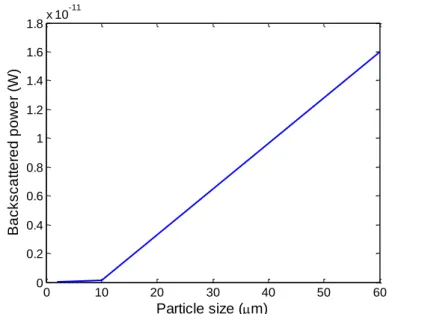
3.4.3 Theoretical sensing volume ... 84
3.4.4 Detected particles ... 84
3.5 Conclusions ... 86
Chapter 4: Application of optical feedback interferometry to the analysis of multiphase flows ... 87
vii
4.1 General context ... 87
4.2 Theoretical model for parallel liquid-liquid flows ... 90
4.3 Experiments ... 93
4.3.1 Microfluidic chip ... 93
4.3.2 Fluids ... 95
4.3.3 Signal processing ... 95
4.3.4 Optoelectronic configurations ... 96
4.3.4.1 Single lens configuration ... 96
4.3.4.2 Measured profile for single lens configuration ... 97
4.3.4.3 Dual lens configuration ... 99
4.3.4.4 Measured profile for dual lens configuration and infrared laser ... 100
4.3.4.5 Measured profile for dual lens configuration and blue-violet laser ... 102
4.4 Perspectives ... 108
Conclusions ... 109
List of publications ... 113
References ... 114
- 1 -
Introduction
Optics and photonics are present in everyday’s life, in many technological devices recently introduced in worldwide markets. In addition, optical and photonic systems are still generating new discoveries, such as the relatively recent invention of the blue Light Emitting Diode, which led to three researchers to be awarded the Nobel Prize in Physics in 2014 as their discovery allowed the beginning of a new era in lighting applications. Last year was recognized by the United Nations as the International Year of Light and Light-based Technologies in a clear effort for emphasizing the top tanked role of optics, lasers and related disciplines in globalized world under continuous development.
With no doubt, the scientific community has found in optical sciences and photonic technologies a powerful tool to address cross-disciplinary research enabling the study, generation and development of new knowledge and applications in biomedicine, micro-nanotechnology and the environment.
Optical sensing and inspection has gained considerable attention over the last decades. Optical sensors are attractive for being precise and having non-contact nature. These elements make optics-based devices suitable for measuring physical parameters in non-destructive testing, where many other invasive techniques cannot be used or only with great difficulties. Optical techniques experienced a significant burst when lasers became available in the scene. The powerful
- 2 -
coherent light paved the way to the development of multiple interferometric and photonics related techniques that are employed today in diverse sensing applications. In this regard, the optical metrology took benefit from the particular features of lasers and their contribution to the development of multiple interferometric techniques that became part of routinely testing protocols in current manufacturing processes and worldwide production and maintenance. In addition, the considerable size reduction of components and its combination with light technologies opens new promising perspectives for advanced imaging systems that can explore areas that where impossible to access before. This is the case of the tiny microscope developed recently and represents a major boost in non-invasive optical imaging of the brain [Kim, 2014].
Optical sensing techniques take benefit from the fact that they use light and non-destructive interaction with the inspected objects and therefore, they are well-suited as compared to many other electrical, mechanical, nuclear and chemical sensors with invasive measurements associated [Baldini, 2006].
Instrumentation and, in particular, optical instrumentation has been extensively projected as a tool in both laboratory environment and industry for addressing the measurement of flows. The need for accurate quantitative information of flows is recognized in the industrial world and laboratory environments.
Fluid flow measurements in microchannels and larger pipes and ducts are important in multiple processes in industry: chemical engineering, oil production, water treatment, but also in the biomedical field. To mention a few examples, microcirculation and blood perfusion in skin is closely related to anomalies in tissues and may be used as an indicator of potential malignant skin cancers such as melanomas. Blood flow monitoring in veins and arteries is used for the assessment of the circulatory system and angiography in human subjects as it may be used to prevent cardiac arrest. In chemical engineering, there is a vast use of flows for mixture, solution and transport. The use of flows in multiple applications in both macro and microscale was followed by the need of providing accurate velocity measurement in diverse scenarios. In this regard, several interferometric and image-correlation techniques exist which are widely used for quantitative and qualitative measurement of flows: speckle patterns, dual-slit, ultrasonics, particle image velocimetry, laser Doppler velocimetry and others are well-known and largely implemented techniques in fluid flow assessment.
The merge of optics and microfluidics is known as the cross-disciplinary field of optofluidics [Psaltis, 2007]. This rather recent denomination obeys to the fact that many groups dedicated to research on optical measurement technique achieve outstanding results to understand the behavior of flows at the microscale. Thus, the terminology optofluidics is nowadays referred to as the field of microfluidic technology assessed by optical means. Optofluidics has gained considerable
- 3 -
attention over the last years and has become a highly active area supported by a huge number of publications and developments that have revolutionized a wide range of applications in sensing and imaging [Fainman, 2009].
Although there is a vast amount of detection methods in microfluidics, including optical, electrical and mass spectrometry methods, the emerging field of microfluidic sensing has experienced a true fusion with optical measurement methods, which have become predominant in the field since its earliest developments [Wu, 2011]. Optical sensing comprise the direct detection of the flow in microfluidic devices by monitoring the light properties modulation due to the interaction light-flow.
Throughout this thesis, we propose to deploy optical feedback interferometry sensors for multiple sensing applications in fluidic systems, with strong emphasis in microfluidics. The experimental demonstrations presented in the frame of this manuscript accentuate the potential of this technique as an alternative optofluidic implementation system. We thereby utilize the capabilities of this technique for the interrogation of fluid flows with focus on the applicability in the chemical and biomedical field.
Several demonstrations of the potential applications of optical feedback effect and its use in optical sensing are provided and discussed in the present manuscript. The document is organized as follows:
Chapter 1 presents a review of the Doppler methods used for the analysis of flows. The main fundaments of the Doppler Effect are presented and the techniques using it explained in the frame of historical aspects, sensing system, recent developments associated and commercialization. We identified several largely used techniques and outline the relative aspects for every technique. The chapter presents Laser Doppler velocimetry, ultrasound Doppler velocimetry, optical Doppler coherence tomography, planar Doppler velocimetry, three-components laser two-focus velocimetry and finally optical feedback flowmetry. In the end of the chapter, a comparison of the techniques is provided as well as the main motivations of the present thesis manuscript are exposed.
The second chapter presents the sensing mechanism on which optical feedback interferometry is based. The chapter presents first the basics of the scattering theories and then the fundaments of the optical feedback effect. In the final part of the chapter, a section is dedicated to a detailed description of the characterization of the lasers used in this thesis.
Chapter 3 presents a huge portion of the experimental results obtained during the development of the present thesis. We describe the main processing methods used to quantify the flow velocity with optical feedback interferometry and present a complete analysis of the reliability of the flow measurement with this technique. The chapter continues with a demonstration of an ex-vivo flow mapping. Then, a
- 4 -
real-time system allowing the assessment of non-steady flows is presented and validated experimentally. The final section of the chapter presents a portion of an ongoing research work on single particle detection in microfluidic devices, which is proposed as a quality control system consisting on the inspection of fluids that should be free of particles.
The final chapter presents the implementation of the optical feedback interferometry sensing technique for the analysis of immiscible multiphase flows. A theoretical model based developed from the Couette flow approximation is proposed. The model is further validated with experimental measurements fluid velocity profile in microfluidic reactors.
- 5 -
Chapter 1
Doppler methods for flow measurements
In this chapter, some of the well-established techniques based on the Doppler Effect for flow measurements are reviewed and compared. In what follows, Laser Doppler Velocimetry, Ultrasonic Doppler Velocimetry, Optical Doppler Coherence Tomography, Planar Doppler Velocimetry, Three component laser-two-focus velocimetry and finally, Optical Feedback Flowmetry are reviewed to provide a general understanding of the historical and technological aspects that were developed to be part of the widely spread techniques allowing fluid flow assessment using the Doppler Effect.
The Doppler Effect
The Doppler Effect is defined as a change in the frequency of a wave when the reference observer moves towards or away from the source. It was named after
- 6 -
Christian Doppler, an Austrian scientist who proposed the first explanation of the phenomenon in 1842 in the frame of a meeting of the Natural Sciences Section of the Royal Bohemian Society of Sciences in Prague. Doppler’s paper entitled “On the colored light of the double stars and certain other stars in heavens” was published in 1843 in the proceedings of the society [Doppler, 1843].
To provide a simple approach to the physics behind the Doppler Effect, let’s consider a stationary light source emitting with a given wavelength λ and frequency 𝑓. The wave train with length λ needs a time 𝑇 = 1 𝑓⁄ to pass a stationary observer. If the observer moves away from the light source the distance between them increases, and the waves would need more time (𝑇′ > 𝑇) to reach
the observer. As the distance is modified, an equation describing this parameter can be set. The total distance 𝑐𝑇′ separating the observer and the source will be composed of the length λ plus the distance moved 𝑣𝑇′, where 𝑐 is the speed of light and 𝑣 is the velocity of the observer. The equation giving the distance is:
𝑐𝑇′ = 𝜆 + 𝑣𝑇′ (1.1)
which leads to
𝜆 = (𝑐 − 𝑣)𝑇′ (1.2)
Knowing that the new period is the inverse of the wave’s frequency resulting from the displacement of the observer 𝑇′ = 1 𝑓⁄ ′, 𝜆 = 𝑐 𝑓⁄ and substituting into
equation 1.2, the relation between the orginal frequency and the one perceived by the observer is:
𝑓′ = [1 −𝑣
𝑐] 𝑓 (1.3)
From expression 1.3 follows that if the observer moves away from the source (𝑣 > 0) the new frequency is shifted to smaller values. If, on the contrary, the observer moves towards the source, the frequency shift increases.
1.1 Laser Doppler Velocimetry
The Laser Doppler Velocimetry (LDV) also referred to as Laser Doppler Anemometry was the first mature technique for flow measurement to be available for implementation. Since the sixties, soon after the laser appeared as a solution looking for problems, the LDV has been used in numerous applications ranging from aeronautics and turbomachinery to ophthalmology and other biomedical fields [Menn, 2004]. The main purpose of the technique lies in measuring the velocity and/or the length of moving surfaces.
1.1.1 History
Back in 1964, two scientists working on Rayleigh scattering modified a spectrometer with the idea of using the Doppler Effect to measure the velocity of particles flowing in a liquid. At that time, LDV was introduced by Yeh and
- 7 -
Cummins [1964]. In this work, the coherent light source was a He-Ne gas laser. Using optical elements, they split a laser beam and used one beam as a reference while the other was directed to illuminate a volume full of polystyrene spheres in water. After this interaction with the particles, the two beams were combined in a photomultiplier and the frequency shift was retrieved by processing the beat signal.
The original set-up employed by Yeh and Cumins is shown in Fig. 1.1. Using this system and pointing to the center of a cylindrical tube with 10 cm of diameter, they were able to measure part of the laminar velocity profile of particles in water. Also, they demonstrated the linear relation of flow rate with respect to the bear frequency, a validation used today in many fluidics applications. Since this first demonstration, the feasibility of LDV for flow measurements was evident and widely considered as a potential technique in the field.
Fig. 1.1. Original Laser Doppler velocimeter set-up proposed by Yeh and Cumins in 1964.
Only one year after the original work presenting LDV was published, Foreman [Foreman, 1965] used the same technique for measuring gas flow using smoke as scattering particles, thus extending the potential application of LDV to measure the velocity of particles with random size and shape. In 1966, Foreman revised the configuration employed by Yeh and Cummins to develop a new version of the laser Doppler velocimeter [Foreman, 1966], where it was highlighted the potential use of LDV as an alternative to less powerful techniques available at the time for fluid flow measurements: the pitot tubes and hot-wire anemometers. Fig. 1.2 shows the set-up that allowed to cover 90% of the velocity profile in a circular tube with 1.1 cm internal radius.
- 8 -
Fig. 1.2. LDV set-up employed by Foreman [1966] to measure gas flow (a). Measured velocity
profile using this optical configuration (b).
1.1.2 Sensing principle
In LDV, small particles are immersed into the fluid to guarantee that they are subject to the hydrodynamic conditions of the carrier flow so that it is understood that they are tracers. Then, a laser beam is split into two identical parts using optical elements such as mirrors and both beams are directed together into a sensing volume, the so-called probe volume.
Fig. 1.3 provides a simple view of the principles on which the sensing scheme is based. As both beams illuminate a common area, an interference pattern is produced and dark and bright fringes become apparent in the probe volume.
Fig. 1.3. Interference occurring in a probe volume in LDV. Scheme extracted from [Menn, 2004].
Fringes of the interference pattern are equally spaced and spacing 𝛿 is ruled by the angle θ so that:
𝛿 = 𝜆
2 𝑠𝑖𝑛𝜃 (1.4)
where 𝜆 is the laser wavelength and θ is half the angle between the two split beams.
- 9 -
When a particle moves through the probe volume with velocity 𝑣𝑝, it crosses dark and bright fringes so that the intensity of the scattered light varies with a frequency 𝑓𝑝:
𝑓𝑝 =𝑣𝑝
𝛿 (1.5)
Photodetected signals contain information on the frequency, and the velocity of the particles in the probe volume is determined by:
𝑣𝑝 = 𝜆
2 𝑠𝑖𝑛𝜃𝑓𝑝 (1.6)
This detection system was first proposed by Rudd back in 1969 [Rudd, 1969]. Multiple optical arrangements of LDV systems were proposed. Some of them were review in detail by Wang [Wang, 1988]. In this paper, some of the possible configurations to collect the light scattered by particles in fluid are outlined: the so-called local oscillator heterodyne arrangement (shown in Fig. 1.4), the differential heterodyne arrangement depicted in Fig. 1.5 and the symmetric heterodyne arrangement represented in Fig. 1.6.
All these configurations are equivalent when measuring flows, but each of them has particular features in the way scattered light is collected. In the heterodyne system shown in Fig. 1.4, light is detected with narrow collection angle as only light scattered in the direction of the photodetector contributes to the signal. The scheme makes this configuration more suitable to detect the signal of highly reflective particles that may saturate the detection component.
Fig. 1.4. Representation of the local oscillator heterodyne LDV arrangement. Figure is taken from
Wang [1988].
In the differential heterodyne arrangement represented in Fig. 1.5, light coming with two different wave vectors is scattered from particles in the flow and collected with a large solid angle in a photodetector. This is of particular importance in the sense that low reflective particles acting as a non-cooperative target may be detected.
- 10 -
Fig. 1.5. Representation of the differential heterodyne LDV arrangement. Figure is taken from
Wang [1988].
Finally, the symmetric heterodyne configuration depicted in Fig. 1.6 is an arrangement for which the probe volume does not result from the intersection of two beams. Light is scattered at the focus point, collected by a simple optics from two different directions and mixed in the photodetector. The interference pattern is generated in front of the photodetection device, thus imaging a moving fringe pattern. In other words, interferometric fringes move across the photodetector [Wang, 1974; Penner, 1970]. The signal to noise ratio is higher with this configurations and it is well suited for flow measurement in sub-millimetric channels.
Fig. 1.6. Representation of the symmetric heterodyne LDV arrangement. Figure is taken from
Wang [1988].
1.1.3 Recent developments and commercialization
Recent approaches use modified versions of different optical systems. That is the case of the configurations proposed by Voigt [2008] and König [2010], who used the LDV with convergent and divergent fringe patterns instead of using parallel fringes. This set-up increased the temporal and spatial resolution of previous LDV systems. It is reported that high resolution (4 μm) in one of the velocity components of the flow was achieved. The highest resolution for a LDV system was reported by Büttnerin 2010, who achieved a spatial resolution of 1.2 μm with associated uncertainty in the measurements of 0.25%.
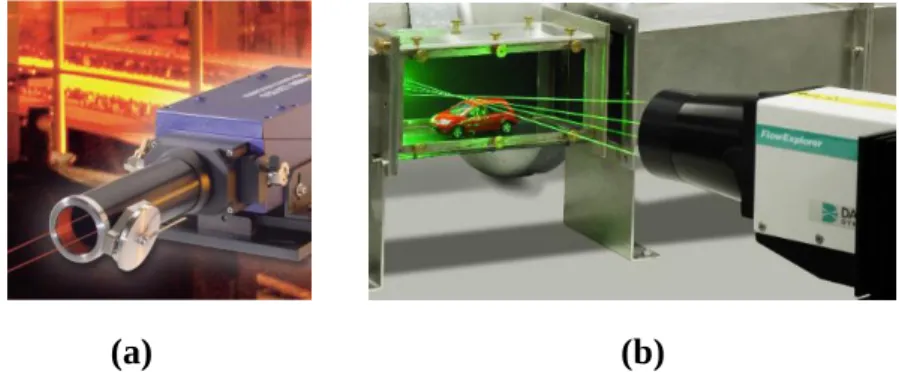
Laser Doppler velocimetry is today a mature enough technology so that commercialization of industrial solutions are available from manufacturers from all over the world. Just to mention an example, Polytec developed a series of laser
- 11 -
Doppler velocimeters such as the LSV-6000. This velocimeter, depicted in Fig. 1.7a, uses an optical head incorporating an LDV system which enables non-contact measurement velocity of moving targets in real time with accuracy of 0.05 % and repeatability of 0.02 % with respect to the measurement value. Other LDV systems are used for continuous monitoring of flows using this technology. The FlowExplorer DPSS shown in Fig. 1.7b measures flow travelling at velocities as high as 600 m/s and measures with uncertainly as low as 0.067% of the detected speed. With more than fifty years since this invention was created, LDV is available to provide robust, accurate and reliable solutions for the scientific and technological developments and for sensing applications using laser light. However, in spite of its unquestionable advantages, the equipment using this technique is expensive and bulky for some specific applications where flow velocity measurement is a need. In addition, the LDV optical arrangements require multiple components acting as the interferometer, thus alignments of mirrors and beam splitters is necessary.
(a) (b)
Fig. 1.7. Polytec (a) and FlowExplorer DPSS (b) LDV commercially available products used
currently in flow sensing.
1.2 Ultrasound Doppler Velocimetry
The Ultrasonic Doppler technique is a well-known and largely implemented method for non-contact measurement of flow velocity with accuracy. When used for this purpose, it is recognized as Ultrasound Doppler Velocimetry (UDV) [Takeda, 1999]. It presents the advantage that the carrier wave does not need to be transmitted only through a transparent or semitransparent pipe, so this technique can be used where light based Doppler techniques, such as Laser Doppler Velocimetry cannot be applied.
1.2.1 History
Ultrasound Doppler velocimetry had its early developments in Japan and the United States. The Institute of Scientific and Industrial Research of Osaka University developed the first Doppler ultrasound device for medical diagnosis [Satomura, 1957]. Using the promising results published in 1957 and based on this own experience, Satomura projected the utilization of the Doppler ultrasonography for exploring blood flow in percutaneous tissue. Together with
- 12 -
Kaneko, he reported the first ultrasonic flowmeter in 1960 [Satomura, 1960]. Parallel developments were performed at the University of Washington in Seattle, where a group headed by Rushmer and Franklin conceived and developed a continuous-wave prototype device using backscattered ultrasound frequency shift for blood flow measurement [Franklin, 1959]. The original system and methodology developed by the Seattle group is shown in Fig. 1.8 A refined version of this device was employed in clinical trials by Eugene Strandness [Strandness, 1967] during the mid-sixties, who could use a portable ultrasonic Doppler flowmeter for assessment of vascular diseases as part of his training as a vascular surgeon.
Fig. 1.8. Ultrasonic system using continuous-wave pulsing developed at University of Washington
for blood flow measurements using the Doppler Effect. Picture extracted from [Franklin, 1959]. Pulsed-wave Doppler equipment was developed simultaneously by the Seattle group from 1966 on, and also by other groups in the United Kingdom and France [Baker, 1970; Wells, 1969; Peronneau, 1969]. A major advancement in the technique was obtained by the Seattle group when the duplex Doppler was invented. The duplex Doppler instrument contained a mechanical scanning head that enabled the ultrasound operator to determine the target of Doppler insonation. This development was revolutionary as it allowed the interrogation of deep-lying circulation in the human body. In terms of applicability to fluid flows assessment, this invention opened the possibility of using ultrasonic signals for the interrogation of corporeal circulators.
Continuous-wave Doppler ultrasonography characterized the implementation of Ultrasound Doppler in obstetrics, where it became a standard technique for fetal heart diagnosis. This is perhaps the most extended use of Doppler ultrasonography in medicine, where it has established as a major clinical diagnostic tool. Fully implemented Doppler velocimetry in obstetrics was first reported by FritzGerard and Drumm [FritzGerard, 1977], who published the first article in the field. Also,
- 13 -
McCallum and colleagues, who at the time were part of the Seattle group at University of Washington, pioneered the real time implementation of this technique [McCallum, 1977].
1.2.2 Sensing principle
Ultrasonic Doppler flowmeters operate using the frequency shift that a sound wave experiences due to the Doppler Effect. Usually, a transducer is employed to transmit a wave through a medium, and the moving components in the medium generate a shift in the carrier signal. The motion is measured after comparing frequency shift between the ultrasonic frequency source, the receiver and the fluid carrier.
The sound wave emitted by the transducer in the ultrasonic Doppler device travels from the face of the sensor to the flow stream. When the wave intercepts a moving particle merged in the flow, its frequency is shifted and consequently it differs from the original source frequency. Due to the Doppler Effect, if particles move toward the transducer, the Doppler-shifted wave will contain higher frequencies than the transmitted wave. In terms of mathematical representation, this process is described by the Doppler equation:
𝑣 =𝑣𝑚(𝑓𝑟−𝑓𝑡)
2𝑓𝑡𝑐𝑜𝑠(𝜑) (1.7) where 𝑣𝑚 is the velocity of the sound wave in the medium is, 𝑓𝑡 is the transmitted wave frequency, 𝑓𝑟 is the received wave frequency and 𝜑 is the angle between the transmitted ultrasound beam and the flow velocity vector. Equation 1.7 implicates that the angle 𝜑 should be precisely determined to obtain an accurate measurement of velocity.
Further developments included miniature sensors to measure the blood flow in animal aortas [Nakamura, 1986]. The system conceived a practical approach to
in-vivo measurement of blood flow in small vessels that enabled the detection of
induced heart failures. The schematic diagram used for the implantation is depicted in Fig. 1.9. Subsequent improvements in the technique were presented by Tamura and colleagues to overcome the dependence of the velocity measurement of the Doppler angle [Tamura, 1988; Tamura, 1987; Tamura, 1990].
- 14 -
Fig. 1.9. Implanted Ultrasonic Doppler Flowmeter proposed by Nakamura et al. for in-vivo
measurement of blood flow.
In 1986, Takeda presented an ultrasonic blood flowmeter capable of measuring the entire flow profile of millimetric channels with a spatial resolution of 0.7 mm. Akamatsu developed an Ultrasound Doppler catheter insensitive to the angle of incidence of the source wave [Akamatsu, 1996]. Instead of using the classical expression represented in Eq. 1.6, they proposed a methodology considering a measurement at two different angles (α and α+Ω) thus obtaining a new expression for calculation of the flow velocity: 𝑣 = (𝑣12 + 𝑣
22)1/2 which becomes:
𝑣 =𝑣𝑚
2𝑓𝑡(∆𝑓1
2 + ∆𝑓
22)1/2 (1.8)
While the theoretical fundaments were correct, the method has not been implemented, the main obstacle being that two separated beams need to be emitted to a common point with different Doppler angles.
1.2.3 Recent developments and commercialization
Other challenges related to UDV for flow assessment include the capability of measuring flow velocities higher than the maximum detectable velocity imposed in the Nyquist theorem. As the physical principle of supporting this technology depends on the velocity of propagation of the carrier ultrasonic wave, aliasing may arise as fast flows are measured.
Murakawa recently addressed this technical limitation. They proposed a method with dual-pulsed repetition frequency for ultrasonic flow measurements [Murakawa, 2015]. The method is aimed at overcoming the aliasing in the velocity detection, thus providing a way to extend the applicability of UDV to sense flow travelling at high velocities. In addition, the spatial resolution of the UDV sensing system achieved with this configuration ranges in between 0.74 and 2.96 mm.
Utrasound Doppler Flowmeters are accurate, non-contact liquid flow measuring devices. These devices are commercially available to satisfy the demands of the industry, where flows can be measured non-destructively even in adverse scenarios.
- 15 -
Research on UDV made possible that knowledge generated around the technique facilitated its implementation in commercial products available since many years. One can mention, for example, the Hitachi EUD-3B professional ultrasonic velocimeter capable to measuring flows [Nakamura, 1986]. Other technological UDV solutions are found in large water storage facilities, as for example the ISCO 4150 Doppler velocimeter which continuously measures the flow stream profile and automatically detects changes in the velocity distribution. Today, the technique is supported by a vast state of the art that enabled the extended use of UDV in laboratories, industry and as a valuable tool in in-field flow assessment.
1.3 Optical Doppler Coherence Tomography
Doppler Optical Coherence Tomography is a relatively recent technique using low-coherent light combined with the Doppler Effect to visualize and quantify mostly blood flow. Since early nineties, many studies have been performed to extract information on pathological structures and angiographic components in living subjects, where the utilization of this technique has provided the specialists with valuable data allowing diagnosis and assessment of morphology of tissue and microcirculation without any invasiveness. Thereby, implementation of this technique in medical studies opened promising perspectives in ophthalmology and angiography [Leitgeb, 2014] as well as in gastroenterology [Osiac, 2011].
1.3.1 History
The history of Optical Coherence Tomography (OCT) dates back to the early nineties, when it found its bases upon the development of low coherence interferometry. A group headed by professor Fujimoto from the Massachusetts Institute of Technology pioneered the first developments in the technique [Huang, 1991; Swanson, 1993]. OCT shares some similarities with ultrasound and both techniques are usually compared in experimental work reported in the literature. However, OCT is capable of providing high resolution cross sectional images allowing 3D mapping of samples. In early nineties, there was little availability for alternative imaging systems working at higher resolutions than the one allowed by high-frequency ultrasound and greater penetration depth than that of confocal microscopy [Drexel, 2004; Rajadhyaksha, 1999]. First applications included the study of tissue structure and targeted OCT’s direct implementation in diverse medical domains, predominantly in ophthalmology.
Doppler OCT, also referred to as Optical Doppler Tomography (ODT) combines the fundamental principles of low coherence tomography and the Doppler Effect. It is an extension of classical OCT, aiming at outlining the morphology of tissue and providing values for the underlying microcirculation in this tissue. Moreover, ODT possesses a unique capability to be implemented for qualitative investigation of tissue shape and localization of vessels and arteries within living structures and
- 16 -
at the same time, it allows quantitative study of blood velocity associated with the circulatory system.
It should be noted, that most of research on OCT lies at the intersection of biomedical research and clinical diagnosis. As compared to other methods, OCT uses light in the visible and infrared region, so photons are less energetic than photons used in X-ray and gamma-ray systems widely used in medical imaging which have the inconvenient that they could damage biological samples [Boppart, 2004; Sun, 2013]. This makes OCT based diagnosis more suitable in clinical inspection and cancer diagnosis.
1.3.2 Sensing principle
ODT is non-invasive in nature as it uses low coherent light for inspection of the sample. The first set-up reported used a fiber Michelson interferometer associated to an automated translation stage for producing a three-dimensional image of tissue microstructures. This set-up is depicted in Fig. 1.10. Light emitted form a superluminescent diode (SLD) is partially directed into a reference arm in the interferometer and the other part is headed to the sample arm. The reference arm contains a mirror coupled to a longitudinal displacement mechanism and the sample arm allows displacement in the sense of the desired scan direction of the sample.
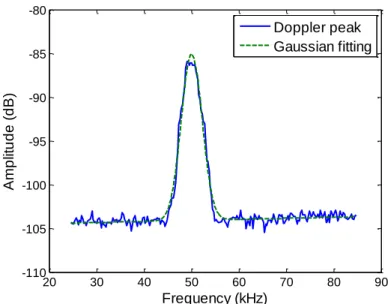
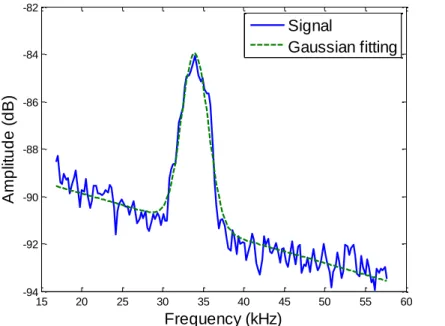
The sensing purpose of this technique lies in scanning the reference mirror arm and recording the amplitude of the interference pattern generated by the waves with similar path length. As stated above, ODT uses a combination of OCT with the information extracted from the Doppler Effect. Its first application in 2D imaging dates back to 1997, when the technique extended the use of OCT for obtaining quantitative values of blood flow velocity [Chen, 1997]. Light backscattered from moving elements (or particles) interferes with the light taken as a reference and its frequency is Doppler shifted in the interference pattern intensity. This shift is characterized by an amount given by [Chen, 1997]:
𝑓𝐷 = 1
2𝜋(𝒌𝒔− 𝒌𝒊)𝒗 (1.9)
where 𝑘𝑖 and 𝑘𝑠 are wave vectors of incoming and scattered light respectively, and 𝑣 is the velocity of moving particles.
- 17 - Fig. 1.10. DOCT system reported by Chen [1997].
The analysis of Doppler frequency extraction from OCT is straightforward. Light reflected by the sample is transmitted via the optic fiber in the reverse direction of the incident light and consequently 𝑘𝑠 = −𝑘𝑖. Then, Eq. 1.9 can be rewritten as [Wu, 2004]:
𝑓𝐷 = −2𝑘𝑖𝑣
2𝜋 = −
2𝑛𝑣 𝑐𝑜𝑠𝜃
𝜆 (1.10)
where 𝑛 is the refractive index of the medium surrounding the particles, 𝜆 is the light wavelength and 𝜃 is the angles of the Doppler shift, thus the angle between 𝑘𝑖 and 𝑣. Equation 1.9 is the general form for light Doppler shift and expression 1.10 is identical to the general equation ruling Doppler detection systems as represented in the expression 1.6.
Using successive scans of the sample it is possible to generate a three-dimensional map describing the morphology of biological tissues and the velocity of flowing flows associated to the microcirculation undergoing in the biological sample. The values of velocity allow for the localization of vessels and arteries and their differentiation. Moreover, ODT is useful for in vivo flow profiling with micrometric resolution. Fig. 1.11 shows an OCT structural imaging of tissues surrounding a vessel, and the information of velocity associated to the flow inside it. The flow profile measured using ODT demonstrates the capabilities of this technique in measuring simultaneously parameters allowing clinical diagnosis with high resolution and accuracy.
- 18 -
Fig. 1.11. Structural ODT imaging of biological tissue (a). Velocity of a vessel inside the tissue
(b). Flow profile inside the vessel (c). Pictures correspond to Chen [1997].
1.3.3 Recent developments
Most of the technological advances and implementations of Optical Doppler Tomography have taken place in the biomedical field. Recently, a review by Leitgeb [2014] outlined the main promising introduction of ODT in quantifying blood flow. Wang [2011] used the technique in assessment of reduction of blood flow in retina in the presence of diabetes. Also, in the same work, ODT capabilities were employed to correlate the visual field loss with the reduction of the blood flow for patients with glaucoma.
In microfluidics, the intrinsic high resolution of ODT enabled a step forward in the analysis of mixtures as it allowed the study of secondary flows in microfluidic devices with a spatial resolution ranging from 2 to 10 μm [Ahn, 2008].
Application centered ODT has experienced a significant burst over the last years, and literature has references coming from a wide range of specific applications. The particular use of the Doppler effect combined with OCT has facilitated the recent advances experienced in medical diagnosis. In the last years, huge progress has witnessed the biomedical optical community as reviewed by Leitgeb [2014]. Most of the experimental work associated to ODT is subject of current research on biomedical optics, thus this technique has become a yardstick in routinely medical procedures with excellent spatial resolutions reported in the order of 1-10 μm [Raghunathan, 2016]. Blood flow is used as an indicator in clinical diagnosis due to its connection with neural activation in a phenomenon called neurovascular
- 19 -
coupling [Attwell, 2010]. Also, this technique provided sensitive quantitative data for the study of retinopathy and the influence of diabetes in it [Wang, 2009]. 1.4 Planar Doppler velocimetry
The experience generated with the advent of the laser and its use in flow measurements pioneered by Yeh and Cummins [Yeh, 1964] pave the way to further developments integrating the Doppler Effect with optics and laser technology and its potential utilization in measuring flow velocity. Planar Doppler Velocimetry (PDV), also known as Doppler Global Velocimetry is another optical technique with relative recent presence in the analysis of flows. This technique uses a planar imaging configuration of the light emitted by a laser that illuminates a medium with particles. The scattering produced by these particles is used for the measurement of a Doppler frequency shift of backscattered light to further turn it into an intensity distribution.
1.4.1 History
In 1991, Komine and Brosnan developed the original Global Doppler Velocimeter using a molecular filter to identify the Doppler shift in scattered light generated by particles in a flow illuminated with a laser [Komine, 1991]. The idea is based on the concept of the filtered scattering produced by small particles and molecules in the flow [Miles, 1990]. The technique was rapidly introduced in the analysis of mixing [Elliot, 1992] and flows travelling at high velocities [Elliot, 1994].
McKenzie explored PDV in flow assessment using a pulsed laser [McKenzie, 1996] and presented the capabilities of the technique in measuring slow flows [McKenzie, 1997]. Several groups accelerated the implementation of PDV to visualize fast processes in fluid, including velocity measurements of supersonic jets [Clancy, 1997; Clancy, 1999]. During the development and consolidation of the technique, authors started to denominate it as Planar Doppler Velocimetry, that was found to be more precise than Doppler Global Velocimetry, but any of these terms is found in the current literature.
1.4.2 Sensing system
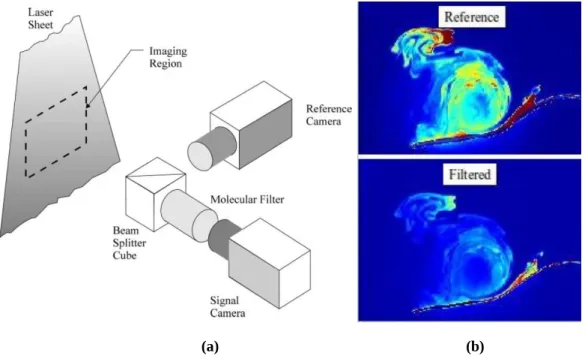
The global idea of this technique lies in the measurement of the scattered light produced by particles in a fluid when a laser illuminates them using a sheet forming optics. The word planar refers to an illuminated interrogation region that is monitored by a full-field visualization device. Then, backscattered light is transmitted through a beam splitter and two 50 % components of the laser beam are redirected towards a camera. A graphical representation of the system is depicted in Figure 1.12a. The purpose is to divide the light beams and to propagate one of them into an iodine filter with known transmission function. The laser is tuned to produce Doppler shift in the region close to a midpoint between the transmission and the absorption of the molecular filter. In this way, the
- 20 -
variations of the intensity of light are proportional to the Doppler shift produced by the scattering centers of the flow. Both intensity images obtained with the cameras are compared and by normalizing the intensity values the variations of the flow velocity can be quantified.
(a) (b)
Fig. 1.12. PDV system for flow measurements using a reference camera and a signal (filtered)
camera (a). Measured qualitative velocity (b).
In its simplest configuration, this set-up can be used for quantifying complex flows fields using the rate capabilities of a visualization device such as cameras [Meyers, 1992]. Since the early introduction of this technique, it has been considered as a step forward towards full-field flow measurements beyond single point measuring scheme. Is this particularly useful in the qualitative visualization of vortex trajectories and other features of complex flow that are difficult to measure [Samimy, 2000; Elliott, 1999]. The Doppler shift of scattered light is then measured using the expression 1.6.
- 21 -
Fig. 1.13. PVD systems based on a single visualization system. Image belongs to reference
[Samimy, 2000].
However, it should be pointed out, that measuring the Doppler shift is necessary in the implementation of the technique but not fully sufficient for measuring the desired velocity of the flow. The set-up described in Figure 1.13 is sensitive to obtain velocities components in the direction
s u . In order to measure all
possible components of flow velocity the detection system needs to be modified so that the scattering produced by particles is observed from three different directions. This configuration was explored by Clancy [1999]. Another setup proposal was explored by Roehle [1998]. This design consisted in bringing the laser sheet from three different directions and observing the scattering components with the configuration shown in Figure 1.14. Generally, the system configuration used by Clancy is considered to be simpler in spite of requiring multiple visualization devices. The schematic representation of Clancy’s configuration is presented in Fig. 1.14.
- 22 -
Fig. 1.14. PVD system proposed by Clancy in 1999. The PDV setup consisted of multiple cameras
for retrieving the velocity components of the flow. Image belongs to reference [Samimy, 2000].
1.4.3 Recent developments and commercialization
Planar Doppler Velocimetry is used nowadays as an alternative sensing technique to Particle Image Velocimetry, a well-established technique widely employed in flow measurement and instrumentation while huge progresses are demonstrated in the frame of application-centered research. Recently, an improved frequency modulated PDV system was proposed to measure non-steady spray flows [Fischer, 2014]. In addition, a cross correlation processing of the signals generated from a PDV setup allowed the measurements of fast flow stream, with mean velocities measured in the order of 600 m/s, with significant reduction of uncertainty in the measurements [Cadel, 2015].
The PDV setup is complex to assemble and manipulate. Therefore, rather than widely commercialized equipment, technological facilities offering precise and accurate velocity measurements are established as for example The Virginia Tech Doppler Global Velocimeter [Jones, 2001]. Also, German automotive engineering services providers such as IAV, established PDV services to measure turbomachine flows and developed the software DGV Evaluator for the analysis
- 23 -
of the three components of the flow fields. According to Harald Müller from PTB in Germany, PDV “has become a promising flow field diagnostic tool for research and development tasks in aerospace and car industry”.
1.5 Three-Component-Doppler-Laser two-focus Velocimetry
1.5.1 Laser two-focus velocimetry
The Laser two-focus (L2F) velocimetry is another method to measure flow velocity, also known in literature as Laser Transit Anemometry. It shares some elements with Laser Doppler Velocimetry and Planar Doppler Velocimetry such as the use of particles merged in the flow and its use in applications with fast flows.
This method was demonstrated for the first time in 1968, when Thompson introduced the original idea outlining the fundamental principle behind this technique [Thompson, 1968]. In this seminal paper, the author highlighted the potential of Laser Doppler Velocimetry and presented some drawbacks inherent to this technique. Based upon those elements, he proposed the original Laser two-focus velocimeter, depicted in Fig. 1.15 and conceived it for measuring dust particles in a turbine flow.
Fig. 1.15. First Laser two-focus system proposed by Thompson [Thompson, 1968].
L2F works with a simple principle. Tracer or suspended particles travel between two laser beams and their transit time is measured. Since the coherent beams are focused in a small volume where they are parallel and the distance separating them is perfectly known, the velocity is directly correlated to the transit time, so this interval serves as the quantitative value for determining the velocity parameter. The fact that the measurement takes place using a focused light, the intensity in the scattering is higher than in Laser Doppler Velocimetry, and this enables that particles with diameters smaller than 0.1 μm can be detected [Schold, 1980].
The capabilities of L2F have been tested in many scenarios, including wind speed, water pumps and stream flows. However, probably the most widespread
- 24 -
application is in experimental turbomachinery, where it is used in the analysis of turbulence [Kost, 1997] and vorticity in highly complex flows [Ball, 1988].
However, there are some specific applications where the optical access to flow is hard and applying L2F to measure three component of velocity is cumbersome or simple impossible. For those cases, a combination with other techniques is a reliable solution.
1.5.2 3C-Doppler-L2F Velocimetry
L2F is itself a non-Doppler technique. It became part of the Doppler methods for flow measurement when it was first combined with the Planar Doppler Velocimetry in what it now known as Three Component Laser two-focus Doppler Velocimetry [Förster, 2002]. By merging the features of PDV and L2F, the sensing system developed by Förster is capable of measuring every component of velocity. Two velocity components of the in-plane movement orthogonal to the laser propagation axis are measured with the optically setup of L2F. The third component is measured from the analysis of the Doppler-shifted backscattered light as used in PDV systems [Roehle, 1999]. This system was originally conceived and developed in the Institute of Propulsion Technology in Germany as part of the research in Aerospace Engineering.
In spite of the number of optical elements, this technique is relatively simple as the contribution of PDV necessitates only one single visualization system, so the overall need for measuring three-components of velocity is fully satisfied with this combination of two subsystems working in their simplest configurations. A graphical representation of the system is depicted in Fig. 1.16.
- 25 -
1.6 Optical feedback flowmetry
Optical feedback interferometry (OFI) is an interferometric technique with recent implementation in fluidics and flow measurements. It uses a laser as a sensing device with minimal optical components. OFI’s physical principle is based on the interferences generated by the back-scattered light inside the laser’s resonant cavity to extract information on the sensed object. When used for sensing purposes in fluidics applications, it is denominated Optical Feedback Flowmetry.
1.6.1 History
The history of optical feedback started almost immediately after the invention of the laser. In most cases optical feedback, or the self-mixing of an electromagnetic waves in the laser cavity after being back-scattered by an external object, was considered as a parasitic effect affecting both laser’s frequency and amplitude. The first demonstration of the potential capabilities of the technique in sensing applications started in 1963 with the work of King and Steward [King, 1963; Hilsum, 1963]. Their articles demonstrated the feasibility of optical feedback to measure displacement even though as little as 0.1 % of scattered light from an object distant up to 10 m entered back inside the lasing cavity. In a clear attempt to extend the utility of the phenomenon of optical feedback in lasers in the general field of metrology, King and Steward filed a patent application in 1968 that introduced a general discussion on the potential of optical feedback interferometry for measuring physical parameters [King, 1968].
During the sixties, optical arrangements where designed and mounted in order to avoid the effect of external feedback entering back in the resonant cavity of the laser [Servagent, 1998]. The first application in velocimetry was reported as early as 1968 when Rudd proposed the first Doppler velocimeter using self-mixing effect in He-Ne gas laser [Rudd, 1968].
Gas laser were continuously used in the seventies. In 1972, Honeycutt and Otto reported the utilization of a CO2 laser for range finding [Honeycutt, 1972]. A few
years later, a feedback-induced device was reportedly employed in reading a compact disc [Seko, 1975]. A self-mixing displacement sensor was proposed by Donati in 1978 using a combination of analog circuitry with an He-Ne laser [Donati, 1978].
It was in the eighties when OFI started to be employed in sensors incorporating semiconductor lasers, thanks to the advent of laser diodes. In 1980, Lang and Kobayashi [Lang, 1980] conducted a study on the phenomenon of external feedback in laser diodes and developed the equations ruling the behavior of lasers while subjected to optical feedback effect. Later on, Shinohara used laser diodes for velocity measurements [Shinohara, 1986].
- 26 -
For many years, optical feedback has been used in diverse scenarios as an alternative tool allowing precise measurements of vibration, absolute distance and velocity. OFI’s ability to measure velocity led to its implementation for sensing purposes in diverse fluidic applications. Koelink and de Mul proposed and demonstrated the first self-mixing flowmeter in 1992 [Koelink, 1992; de Mul, 1992]. The first optical feedback flow sensor accurately measured the flow velocity and these measurements were validated with a linear relationship obtained between flow rate and measured velocity. Since then, OFI sensors have been tested and implemented in flow assessment in fluidics, microfluidics and general flowmetry with interest in chemical and biomedical engineering. It has been employed in the past for measuring blood flow over skin [Özdemir, 2008], blood perfusion in tissue [de Mul, 1993; Figueiras, 2013] and drop measurements [Norgia, 2015]. Moreover, this technique is currently being actively employed for the study of flows in small channels [Campagnolo, 2013] with direct implementation as an optofluidic alternative sensing technique [Nicolić, 2013].
1.6.2 Sensing principle
Optical feedback interferometry uses a reinjection scheme. Light emitted by a laser impinges in a moving target and a part of the scattered light is fed back inside the laser cavity. This reinjection causes variations in the laser emission power and junction voltage that can be employed to obtain information on the target and describe kinematic features of the external object such as its velocity or vibration frequency.
In Optical Feedback Flowmetry, the external feedback is generated by particles flowing in a fluid. Light scattered by those tracer particles enters back in the laser and modulate its lasing properties. As in Laser Doppler Velocimetry, this Doppler frequency 𝑓𝐷 is related to the particle’s velocity as explained in expression 1.6.
The fundamental aspects of OFI’s sensing scheme will be exposed throughout this thesis. Thereby, it will be provided the basics of the phenomenon behind this technique as well as applications in sensing and interrogation of fluid flows.
1.6.3 Particular features of optical feedback interferometry
In OFI based sensing systems, a laser is used as the light source, interferometer and receiver and for many applications very few optical components are needed. This makes OFI sensors generally compact when compared to other sensing devices. Other advantages include its self-alignment, thus avoiding complex alignments required by classical interferometry. In addition, taking advantages from the light amplification in the laser cavity where the interferences take place, OFI is sensitive to very low levels of back-scattered optical power.
OFI can be considered as a consolidated and mature interferometric technique in mechatronics, typically for velocity, vibration and displacement measurements
- 27 -
[Atashkhooei, 2014; Arriaga, 2016] and as an alternative method for multiple biomedical studies [Donati, 2014; Bakar, 2013]. A recent review summarizes most of the known applications [Taimre, 2015]. Moreover, current trends in OFI’s implementation for multiple biomedical applications are described in a recent publication [Perchoux, 2016].
1.7 Comparison of the methods and key features
The main features of the techniques presented in this chapter are outlined in Table 1. Key parameters inherent to the measurement scheme utilized by the detection system are detailed in terms of technical and economic relevance. To this end, this table provides a general overview of the advantages and constraints relative to the Doppler measurement techniques used in fluid flow assessment and quantification.
LDV and ODT perform accurate velocity measurements with high resolution. This is particularly interesting as this resolution is comparable to the typical resolution that optical feedback interferometry sensors hold for many applications in fluid flow measurements, which is utmost important for sensing at the microscale. However, both LDV and ODT require complex optical arrangements resulting in bulky equipment that makes complicated its direct implementation for microscale fluid measurements.
Ultrasound Doppler flowmetry measures flow velocity in channels and pipes without direct dependence on the transparency of the flowchannel, thus it can perform valid measurements where the rest of the optical methods exposed in this chapter may not. However, this technique has the drawback that it does not offer high resolution in the measurements when compared to the characteristic resolution of the optical Doppler methods reviewed here.
Finally, PDV and 3C-L2F velocimetry are complicated to be implemented, difficult to mount and require many optical and visualization components. However, these techniques are capable or measuring with good accuracy and resolutions comparable to that of OFI systems.
- 28 -
Table 1.1. Comparison of the Doppler methods for flow measurements Technique Spatial
Resolution
Costs Simplicity Published In-vivo Implementation
Type of Target Laser Doppler
Velocimetry
1 μm Expensive No, many
components are necessary and requires complex alignments Yes Solid/Fluid Ultrasound Doppler Velocimetry
740 μm Expensive No Yes Fluid
Doppler Optical Coherence Tomography
5 μm Expensive No, it requires optical alignments
and components
Yes Tissue/Fluid
Planar Doppler Velocimetry
100 μm Expensive Easy mounted No Fluid
Three-Component Laser-2-Focus
Velocimetry
10 μm Expensive No, it requires the synchronization of two independent measurement techniques No Solid/Fluid Optical Feedback
![Fig. 1.13. PVD systems based on a single visualization system. Image belongs to reference [Samimy, 2000]](https://thumb-eu.123doks.com/thumbv2/123doknet/3135665.89262/30.892.274.655.122.470/systems-based-single-visualization-image-belongs-reference-samimy.webp)