HAL Id: tel-02310664
https://pastel.archives-ouvertes.fr/tel-02310664
Submitted on 10 Oct 2019HAL is a multi-disciplinary open access archive for the deposit and dissemination of sci-entific research documents, whether they are pub-lished or not. The documents may come from teaching and research institutions in France or abroad, or from public or private research centers.
L’archive ouverte pluridisciplinaire HAL, est destinée au dépôt et à la diffusion de documents scientifiques de niveau recherche, publiés ou non, émanant des établissements d’enseignement et de recherche français ou étrangers, des laboratoires publics ou privés.
Peng Xiao
To cite this version:
Peng Xiao. Adaptive optics in full-field spatially incoherent interferometry and its retinal imaging. Hu-man health and pathology. Université Paris sciences et lettres, 2017. English. �NNT : 2017PSLET015�. �tel-02310664�
THÈSE DE DOCTORAT
de
l’Université de recherche Paris Sciences et Lettres
PSL Research University
Préparée à École Supérieure de Physique et de Chimie
Industrielles de la Ville de Paris
ADAPTIVE OPTICS IN FULL-FIELD SPATIALLY INCOHERENT
INTERFEROMETRY AND ITS RETINAL IMAGING
COMPOSITION DU JURY :
M. ROUSSET Gérard
Université Paris-Diderot, Rapporteur
Mme. LEVEQUE-FORT Sandrine
Université Paris-Sud, Rapporteur
Mme. MAITRE Agnès
UPMC, Présidente du jury
M. PAQUES Michel
UPMC, Membre du jury
M. MEIMON Serge
ONERA, Membre du jury
M. FINK Mathias
ESPCI, Directeur de thèse
M. BOCCARA Claude
ESPCI, Co-Directeur de thèse
Soutenue par P
ENGXIAO
le 16 Novembre 2017
h
Ecole doctorale
n°
564École Doctorale Physique en Île-de-France
Spécialité
Physique
Dirigée par Mathias FINK
THÈSE DE DOCTORAT
de l’université de recherche Paris Sciences et Lettres
PSL Research University
Spécialité
Optique Physique
(ED 564 - Physique en Île-de-France)
Préparée à l’Institut Langevin - Ondes et Images
École Supérieure de Physique et de Chimie Industrielles de la Ville de Paris
Présentée par
Peng XIAO
sous la direction deMathias FINK et A. Claude BOCCARA
Pour obtenir le grade de
DOCTEUR de l’UNIVERSITÉ DE RECHERCHE PARIS SCIENCES ET LETTRES
Sujet de la thèse :
Adaptive optics in full-field spatially incoherent
interferometry and its retinal imaging
Soutenue le 16 Novembre 2017
devant le jury composé de :
M. ROUSSET Gérard Rapporteur
Mme. LEVEQUE-FORT Sandrine Rapporteur
Mme. MAITRE Agnès Présidente du jury
M. PAQUES Michel Examinateur
M. MEIMON Serge Examinateur
M. FINK Mathias Directeur de thèse M. BOCCARA Claude Co-Directeur de thèse
Acknowledgements
Firstly, I would like to offer my sincere appreciation to my thesis advisors Prof. Mathias FINK and Prof. A. Claude BOCCARA for giving me this great opportunity to work with and learn from them. I could not have imagined having better advisors and mentors for my PhD study. Their guidance as well as the independence they have given to me are indispensable and crucial for me to tackle every obstacle during my PhD training. Their passion and attitude toward research and life have motivated me greatly to become a good researcher as well as a good person. I am immensely grateful to Claude for his trust and comfort during my hardest period when I first arrived in France. I could have not come to this step without his support.
Besides my advisors, I would also like to thank the rest of my honorable jury members for their valuable time to review my thesis and participate in my thesis defense. Thanks to Prof. Gérard ROUSSET, Serge MEIMON and Sandrine LEVEQUE-FORT for writing the thesis reports with their professional suggestions and comments. Thanks to Prof. Michel PAQUES for his insightful comments from the point of view as a medical doctor and thanks to Prof. Agnès MAITRE for being the president of the jury and writing the defense report for me.
My gratitude also goes to the former and current FFOCT group members: Olivier, Clément, Slava, Egidijus, Jules, Amir, Thu-mai and Daria, with whom I have shared the lab, experiment components, research ideas and problems, stimulating discussions as well as conference trips together. I am also grateful to our cooperators: Prof. Jose-alain SAHEL, Kate GRIEVE, Kristina IRSCH and Romain in Institut de la Vision for their discussions and suggestions.
My time in Institut Langevin was enjoyable in large part due to my fellow office-mates and friends: Slava, Léo, Olivier, Marion, Clément, Aurélien, Vincent, Jean-Baptiste, Yann, Baptiste, Kammel, Florian and Sander. Thanks for sharing those coffee breaks, drinks, parties, as well as the KTV and HOT POT night. All are unforgeable memories for my life in France. There are much more than a thank-you I would like to say to my closest friends in Paris. We have shared innumerable memorable moments in France with both joys and sorrows. And I am also thankful to all my best friends in China for their continuous support. All of them are true friendships that I will treasure for a lifetime.
Last but not least, I would like to give my biggest appreciation and gratitude to my family for their unconditional love and support in all my endeavours.
Abstract (English)
This thesis follows the study and development of an adaptive optics full-field optical coherence tomography (AO-FFOCT) system, aiming for high resolution en face human retinal imaging. During the quantification of the effects of geometrical aberrations on the FFOCT system per-formance, it is shown that, with spatially incoherent illumination, the lateral resolution of FFOCT is insensitive to aberrations, which only cause the FFOCT signal reduction. Since low order aberrations like myopia and astigmatism dominate in human eye, a non-conjugate AO configuration by using transmissive wavefront corrector is suggested and applied for low order aberrations correction to simplify the AO-FFOCT system. Wavefront corrections are done with a wavefront sensorless method by using FFOCT signal level as the metric. Experiments with scattering samples and artificial eye model are conducted to demonstrate the feasibility of the customized AO-FFOCT system for aberration correction. In order to resolve the eye motion effects and employ real-time matching of the optical path lengths of the two interferomet-ric arms in FFOCT, a system combination of traditional spectral-domain OCT with FFOCT is adopted. With this combined system, high resolution FFOCT cellular retinal imaging is achieved in human eye in vivo for the first time.
Keywords:
Full-field optical coherence tomography, Adaptive optics, Spatial coherence, High resolution, Retinal imaging, Ophthalmology
Résumé (Français)
Cette thèse traite de l’étude et du développement d’un système d’optique adaptative pour la tomographie par cohérence optique plein champ (AO-FFOCT en anglais) appliquée à l’imagerie haute résolution de la rétine. L’analyse de l’effet des aberrations géométriques sur les perfor-mances en FFOCT a montré que pour une illumination spatialement incohérente, la résolution transverse est insensible aux aberrations et ne fait que diminuer le niveau du signal. Comme ce sont des aberrations de bas ordres comme la myopie et l’astigmatisme qui prédominent pour l’œil humain, une méthode d’optique adaptative avec une configuration sans conjugaison qui utilise une correction de front d’onde en transmission est suggérée, puis appliquée à la correction de ces ordres afin de simplifier le système d’AO-FFOCT. Des corrections de front d’onde sont effectuées sans analyseur de surface d’onde, en utilisant le niveau du signal de FFOCT comme métrique. Des expériences avec des échantillons diffusants et un œil artificiel sont menées pour démontrer la faisabilité d’un système d’AO-FFOCT conçu pour la correction d’aberration. Afin de résoudre les problèmes posés par les mouvements oculaires et de compenser en temps réel la différence de chemin optique entre les deux bras de l’interféromètre, l’instrument de FFOCT est couplé à un système d’OCT spectral. Avec cette combinaison de systèmes, l’imagerie FFOCT
in vivo cellulaire de la rétine à haute résolution a été réalisée pour la première fois sur l’œil
humain. Mots clés:
Tomographie par cohérence optique plein champ, Optique adaptative, Cohérence spatiale, Haute résolution, Imagerie de la rétine, Ophtalmologie
Contents
Introduction 1
I Optical Coherence Tomography and Adaptive Optics in
Reti-nal Imaging
5
1 Optical coherence tomography (OCT) 7
1.1 Imaging in scattering media . . . 8
1.2 Introduction of OCT . . . 9
1.3 Low coherence interferometry (LCI) . . . 11
1.4 OCT performances . . . 13 1.4.1 Axial resolution . . . 13 1.4.2 Lateral resolution . . . 13 1.4.3 Field of view . . . 14 1.4.4 Sensitivity . . . 15 1.5 OCT techniques . . . 15 1.5.1 Scanning OCT . . . 15 1.5.2 Parallel OCT . . . 17
2 Wavefront correction with adaptive optics 19 2.1 Wavefront aberration . . . 20
2.2 Aberration representation with Zernike polynomials . . . 20
2.3 Strehl ratio . . . 22
2.4 Adaptive optics (AO) . . . 23
2.4.1 Introduction of AO . . . 23
2.4.2 Wavefront corrector . . . 24
2.4.3 Direct wavefront sensing . . . 27
2.4.4 Indirect wavefront measurement based on image analysis . . . 27
2.5 Computational adaptive optics . . . 30
3 The human eye and retinal imaging 31 3.1 Imaging properties of human eye . . . 32
3.1.1 The structure and geometry of human eye . . . 32
3.1.2 Eye aberrations . . . 34
3.1.3 Eye movements . . . 36
3.2 Retinal imaging . . . 37
3.2.1 Flood illuminated fundus camera . . . 37
3.2.3 OCT retinal imaging . . . 39
II Full-field Optical Coherence Tomography and its Adaptive
Optics
45
4 Full-field optical coherence tomography (FFOCT) 47 4.1 Introduction . . . 484.2 Basic principles of FFOCT . . . 48
4.2.1 Basic layout . . . 48 4.2.2 Image acquisition . . . 50 4.3 FFOCT performances . . . 52 4.3.1 Resolution . . . 52 4.3.2 Field of view . . . 52 4.3.3 Sensitivity . . . 52
4.3.4 Comparison of FFOCT with other OCT techniques . . . 53
4.4 LightCT scanner . . . 53
4.5 FFOCT applications . . . 55
4.5.1 Histological evaluation of ex vivo tissues . . . 55
4.5.2 Dynamic FFOCT imaging . . . 56
4.5.3 Inner fingerprint imaging . . . 57
5 FFOCT resolution insensitive to aberrations 59 5.1 Aberration fuzziness and PSF . . . 60
5.2 The unexpected PSF determination using nanoparticles in FFOCT . . . 61
5.3 Optical coherence . . . 61
5.3.1 Temporal coherence . . . 63
5.3.2 Spatial coherence . . . 63
5.4 Theoretical system PSF analysis in various OCTs . . . 65
5.4.1 Scanning OCT with spatially coherent illumination . . . 66
5.4.2 WFOCT with spatially coherent illumination . . . 66
5.4.3 FFOCT with spatially incoherent illumination . . . 68
5.5 Experimental confirmation with extended object . . . 71
5.5.1 USAF imaging with defocus . . . 71
5.5.2 UASF imaging with random aberration . . . 72
6 Adaptive optics FFOCT (AO-FFOCT) 75 6.1 Simplifying AO for low order aberrations in FFOCT . . . 76
6.1.1 Plane conjugation in AO induce system complexity . . . 76
6.1.2 Non-conjugate AO for eye’s low order aberration correction . . . 77
6.1.3 Wavefront sensorless method further simplify the system . . . 77
6.2 The compact AO-FFOCT setup . . . 78
6.3 Aberration correction algorithm . . . 79
6.4 LCSLM-induced aberration correction . . . 80
6.4.1 Non-conjugate AO . . . 80
Table of contents ix
6.5 Sample induced aberration correction . . . 83
6.5.1 Ficus leaf experiment: weak aberration correction . . . 83
6.5.2 Mouse brain slice: strong aberration correction . . . 84
6.6 AO-FFOCT retinal imaging of artificial eye model . . . 86
III In vivo Human Retinal Imaging with FFOCT
89
7 Combing FFOCT with SDOCT for in vivo human retinal imaging 91 7.1 Introduction . . . 927.2 Combining FFOCT with SDOCT . . . 93
7.3 Eye safety analysis . . . 96
7.4 System performance validation with artificial eye model . . . 99
7.5 In vivo human retinal imaging . . . 100
7.5.1 FFOCT retinal imaging of the fovea . . . 100
7.5.2 FFOCT retinal imaging of retinal near periphery . . . 103
Conclusions and perspectives 105
Publications 109
List of abbreviations
• AMD: Age-related Macular Degener-ation
• AO: Adaptive Optics • CA: Coherence Area
• DME: Diabetic Macular Edema • FDOCT: Fourier-domain Optical
Co-herence Tomography
• FFT: Fast Fourier Transform
• FFOCT: Full-field Optical Coherence Tomography
• FOV: Field of View
• FTIR: Frustrated Total Internal Re-flection
• FWHM: Full Width at Half Maxi-mum
• IS/OS: Inner/Outer Segment • LCI: Low Coherence Interferometry • LCSLM: Liquid Crystal Spatial Light
Modulator
• LED: Light-emitting Diode
• MRI: Magnetic Resonance Imaging • NA: Numerical Aperture
• NIR: Near-Infrared Light
• OCT: Optical Coherence Tomography • OCM: Optical Coherence Microscopy • OPL: Optical Path Length
• PSF: Point Spread Function • PZT: Piezoelectric Transducer • RMS: Root Mean Square
• RNFL: Retinal Nerve Fibre Layer • RPE: Retinal Pigment Epithelium • SDOCT: Spectral-domain Optical
Co-herence Tomography
• SLD: Super-luminescent Diode • SLM: Spatial Light Modulator
• SLO: Scanning Laser Ophthalmoscope • SNR: Signal-to-Noise Ratio
• SSOCT: Swept-source Optical Coher-ence Tomography
• TDOCT: Time-domain Optical Co-herence Tomography
• UHR: Ultrahigh-resolution
• WFOCT: Wide-field Optical Coher-ence Tomography
Introduction
After about 25 years of development, optical coherence tomography (OCT) has become a pow-erful imaging modality [1, 2]. Similar to ultrasound technique but using light illumination, optical coherence tomography (OCT) has been broadly used in biomedical imaging due to its high resolution, high sensitivity and non-contact advantages. By measuring the echoes of backscattered light that indicates the structures inside biological samples with light interfer-ometry, cross-sectional images are usually formed. OCT techniques have proved important and successful applications in ophthalmology, especially in retinal imaging. The cross-sectional depth exploration of the retinal layers offers important information of pathologies for early di-agnosis of retinal diseases and tracing disease evolutions. Nevertheless, due to the habitual use of imaging devices like fundus camera or scanning laser ophthalmoscope (SLO), ophthalmolo-gists often ask for en face images of OCT. Thanks to the speed improvement of OCT systems, en face retinal images can be obtained by real-time 3-dimension imaging. But because of the requirement of large depth of focus, low numerical aperture (NA) objectives are typically used in traditional OCTs results in relatively lower spatial resolution compared with microscopes that use high NA objectives.
Developed in ESPCI Paris, Full-field OCT (FFOCT) is a kind of parallel OCT techniques that use full-filed illumination and an array detector to acquire en face images perpendicular to the optical axis without lateral scanning [3, 4]. By utilising high NA microscope objectives in a Linnik interferometer configuration, FFOCT is able to achieve standard microscope spatial resolution. Since its introduction, FFOCT has been applied in various researches and medical studies like rapid histological evaluation of ex vivo tissue samples, human breast and brain tissue characterization, human inner fingerprint detection, non-destructive material evaluation and also ex vivo ophthalmology studies to provide morphological characterization of the ocular tissues. While FFOCT system is able to achieve micron resolution in 3-dimension with micro-scope objectives and broadband light source to select ballistic photons from scattering light, aberration needs to be considered when apply it to in-depth imaging into biological samples or eye imaging.
Aberrations present in the eye are typically induced by the curvature irregularities of cornea and crystalline lens, tear film or some eye diseases. It is one of the main limitations that degrade the imaging performance of variety of optical instrumentations for eye imaging, espe-cially for retinal examination when the eye works as an optical element of the imaging
sys-tem. Adaptive optics (AO), which is originally developed for astronomical imaging to correct atmosphere-induced wavefront distortion, are broadly used to measure and correct eye aberra-tions in retinal imaging in combination with different imaging modalities like flood-illuminated ophthalmoscope, SLO and OCT. Typically, with AO added, the spatial resolution and signal to noise ration (SNR) of these systems are increased result in better visualization of the retinal structures.
As a part of the ERC HELMHOLTZ synergy program whose aim is to explore the holistic evaluation of light and multi-wave techniques in ophthalmic studies, the work expound in this thesis belongs to a sub-project aiming to apply FFOCT system for high resolution en face human retinal imaging. To apply FFOCT for in vivo retinal imaging, eye aberration is the first important thing that needs to be considered. This thesis therefore is concerned with the effects of aberrations on the performance of FFOCT and the development of an AO-FFOCT for aberration correction. Then the subsequent work is to adapt FFOCT to in vivo human retinal imaging.
The thesis is divided into three main parts:
The first part focuses on OCT and AO as well as their applications in human retinal imaging. In chapter 1, the backgrounds and basic principles of OCT is introduced. The definition of various parameters such as resolution, field of view and sensitivity indicating OCT performances are detailed. Various OCT techniques are briefly discussed based on their imaging formation methods. In chapter 2, the causes of wavefront aberrations are discussed. The representation of aberrations by Zernike polynomials and aberration quantification by Strehl ratio are presented. What’s more, the concept of AO and its basic components are illustrated. Different wavefront correctors and wavefront sensing methods are presented as well as the pros and cons and their potential applications. Chapter 3 aims to introducing the imaging properties of human eye, including its structural and geometrical formation, especially on the human retina structures and functions. Also, current retinal imaging modalities such as fundus camera, SLO and OCT are presented and compared. The combination of these retinal imaging techniques with AO are also discussed.
The second part of the thesis focus on FFOCT and its adaptive optics. Chapter 4 intro-duces the basic layout of FFOCT system and its imaging acquisition methods. The FFOCT performance parameters are presented and the comparison its main features with the other OCT techniques are shown. It also includes the applications of FFOCT together with some newly developed FFOCT techniques such as dynamic FFOCT for intra-cellular motion detec-tion and FFOCT for inner fingerprint imaging. Chapter 5 focuses on the work on quantifying the FFOCT resolution performance in presence of aberrations. Both theoretical analysis and experimental results are presented to show that in FFOCT system with a spatially incoherent illumination, its lateral resolution is insensitive to geometrical aberrations with only signal level reduction, while it is not the case in the other OCT techniques with spatially coherent illu-minations. This surprising finding supports FFOCT for human retinal imaging even without AO when aberration is not too large. In chapter 6, a simplified AO-FFOCT system is intro-duced with non-conjugate AO by using an transmissive liquid crystal spatial light modulator (LCSLM) for low order aberration correction. A wavefront sensorless method is applied that further simplified the system with the image intensity as the metric since aberration affects only the signal level in FFOCT. Non-conjugate AO is compared with conjugate-AO experimentally.
Introduction 3
And the system is applied for sample induced aberration correction in a ficus leaf and also mouse brain tissue slice. At last, the AO-FFOCT retinal imaging is demonstrated with an artificial eye model to improve signal level by correcting low order aberrations.
The third part of the thesis mainly shows the application of FFOCT for in vivo human retinal imaging. In chapter 7, in order to resolve the problem of optical path length (OPL) matching in FFOCT for in vivo, the FFOCT is combined with a SDOCT system to realise real-time matching of the OPL for FFOCT. The evaluation of the illumination on eye safety is calculated. The combined system performance is validated by doing artificial eye model retinal imaging. Finally, in vivo human retinal imaging are performed with the combined system and the results are presented. En face high resolution FFOCT images of different retinal layers are acquired showing cellular level retinal structures like nerve fibres, blood vessels as well as retinal photoreceptors.
In the end of this thesis, a conclusion sums all the achievements of this thesis work and the current stage of FFOCT system in human retinal imaging. Also the perspectives and challenges of FFOCT for in vivo human retinal imaging and eye examination are discussed.
Part I
Optical Coherence Tomography and
Adaptive Optics in Retinal Imaging
CHAPTER
1
Optical coherence tomography (OCT)
Table of contents
1.1 Imaging in scattering media . . . 8 1.2 Introduction of OCT . . . 9 1.3 Low coherence interferometry (LCI) . . . 11 1.4 OCT performances . . . 13 1.4.1 Axial resolution . . . 13 1.4.2 Lateral resolution . . . 13 1.4.3 Field of view . . . 14 1.4.4 Sensitivity . . . 15 1.5 OCT techniques . . . 15 1.5.1 Scanning OCT . . . 15 1.5.2 Parallel OCT . . . 17
1.1 Imaging in scattering media
With the rapid development of science and technology, many optical imaging techniques have been greatly improved. Optical imaging techniques refreshed our understanding of the world with tremendous performances, particularly in biology studies which have benefited a lot with the advances of optical microscopies. But in medical imaging, methods like ultrasound, com-puted tomography and magnetic resonance are still more preferred compared to optical modal-ities. This is due to the fact that the optical imaging window is considered to be from visible to near-infrared (NIR) spectrum (400-1350 nm)as light in this spectrum range suffers low absorp-tion by biological tissues (figure 1.1(a)), while the heterogeneous structures in biological tissues are mostly in this range of optical wavelengths and strongly scatter light (figure 1.1(b)).This prevents optical instruments from in-depth imaging and has made optical imaging being a complementary method in many applications in medical imaging.
Figure 1.1 – Absorption and scattering in biological tissue [5]. (a)Absorption coefficient versus optical wavelength in the range of 0.1 − 12um. (b) Ratio of the reduced scattering coefficient to the absorption coefficient versus optical wavelength in the range of 400 − 1800nm, scattering outside of this range is not characterized since it is dominant by absorption.
When doing optical imaging in scattering tissue, due to small variations of refractive index between biological structure, only extremely weak light would be backscattered and most of the light would be scattered by the surrounding structures. According to the Lambert-Beer law, the intensity of backscattered light, more precisely ballistic light, which contains the most useful information of the sample structures, decreases exponentially with the imaging depth. The multiply scattered signals would degrade the contrast, the resolution as well as the imaging
1.2. Introduction of OCT 9
depth. So, to perform better optical imaging, the main challenge is to extract these low ballistic signals while rejecting the multiply scattered light.
To accomplish this challenge, different methods like spatial filtering [6], time reversal [7,8] or coherence detection [9] have been exploited. For example, the widely used confocal microscope is based on spatial filtering of out-of-focus light with a optically conjugated pinhole in front of the detector. The multiply scattered light rejection in confocal microscope has been both theoretically discussed and experimentally demonstrated in [10]. By combining the spatial filtering and coherence detection, imaging through scattering to produce high contrast images from very weak signals can also be achieved in optical coherence tomography (OCT) [1, 11], which is explained in details in the following sections.
1.2 Introduction of OCT
The OCT technique was first invented in the early 1990s in MIT [1]. Based on low coherence in-terferometry, OCT is now a well-established imaging modality by measuring the magnitude and echo time delay of backscattered light. It can provide cross-sectional (B-scan) and 3-dimensional volumetric internal sample structures with resolutions of 1 − 15um by laterally scanning the optical beam and performing axial measurements of echo time delay (A-scan)(figure 1.2). Com-pared with other imaging methods, its non-invasiveness, high resolution, high sensitivity, low cost and easy to use advantages make OCT a powerful imaging modality with applications across many clinical fields as well as fundamental scientific and biological researches.
Figure 1.2 – OCT cross-sectional or 3-dimentional image formation [12]. Measurements of the backscattered light versus imaging depth forms axial scans(A-scan). By scanning the op-tical beam in transverse direction, a series of A-scans forms a cross-sectional OCT image (B-scan). Multiple B-scans would generate 3-dimensional OCT data sets by raster scanning.
OCT holds the features of both ultrasound and microscopy. Figure 1.3 shows the comparison of these imaging techniques in parameters as resolution and imaging depth. The clinical ultra-sound uses acoustic waves with frequencies raging between 3 − 40MHz and gives a resolution of 0.1 − 1mm [13]. Sound waves at these frequencies are transmitted with minimal absorption
in biological tissues so that deep imaging is possible in ultrasound. Although with higher fre-quency ultrasound (up to 100MHz), imaging resolution of 15 − 20um could be achieved, the imaging depths would be limited to only a few millimetres as high frequencies sound waves are strongly attenuated in biological tissues. On the other hand, microscopy and confocal mi-croscopy have high lateral resolutions up to 1um. However, imaging depth is limited because image signal and contrast are significantly degraded by optical scattering. Imaging can be performed to only a few hundred micrometers in most of the tissues.
OCT just fills the gap between ultrasound and microscopy. With current technology, imaging resolution of 1−15um and a penetration depth of 2−3mm can be achieved. The high resolution of OCT imaging enables the visualization of tissue architectural morphology. The fact that OCT itself is also an optical imaging technique makes its imaging depth limited by the effects of absorption and scattering within the biological samples. The axial resolution of OCT is determined by the bandwidth of the light source. Better axial resolution can be achieved with broader bandwidth.
Figure 1.3 – Comparison of resolution and imaging depth for ultrasound, OCT and confocal mi-croscopy [12].
After its invention, OCT has found successful application in ophthalmology imaging and has become a clinical standard in this field, especially in retinal imaging [14]. High resolution and non-contact imaging of anterior segment as well as retina is possible with OCT as the trans-parency of the eye offers easy access of the OCT beam to these eye structures with minimal optical attenuations and scattering. OCT performs non-invasive optical biopsy of living retina
1.3. Low coherence interferometry (LCI) 11
which was only possible in ex vivo histology before. The high resolution cross-sectional section-ing of retina layers offers great potential for not only pathologies detection such as macular hole and retinal detachment (figure 1.4) [15,16], but also early diagnosis of common eye disease like glaucoma [17] with the cell morphology and vascular structures revealed in individual retinal layers.
Figure 1.4 – OCT human retinal images indicating macular hole and detachment [15]. (a)OCT image shows a macular hole on the retina.(b) OCT image demonstrates detachment of the neurosensory retina.
The development of new light sources, high performance computers, different illumination geometries, and image construction methods is pushing OCT to achieve higher resolution and signal to noise (SNR) levels, faster imaging speed, lager imaging depth, and better image in-terpretation. Besides its application in ophthalmology field, OCT have also been utilised in many diverse areas such as oncology [18–20], dermatology [21–26], dentistry [27,28], etc. Many alternative OCT techniques have also emerged based on the original OCT with endoscopic imaging probes giving access to internal organs [29–31], or signal orientations to explore various biological sample properties. Optical coherence elastography measures sample elastic proper-ties [32–36], polarization sensitive OCT detects tissue birefringence information [25, 26, 37–39], phase-sensitive OCT reveals cellular morphology and dynamics [40–42], angiography OCT forms vascular maps [43–45] while Doppler OCT could offer functional information of blood flow [46–49]. Combination of difference OCT techniques and also complementary imaging modalities have also been demonstrate to do multifunctional imaging [50–53].
1.3 Low coherence interferometry (LCI)
Interferometry is an important method for the measurement of small optical path length changes, from which small displacements, refractive index changes or surface irregularities can be extracted. As mentioned before, OCT is based on a so called low coherence interferometry (figure 1.5(a)) to detect the magnitude and echo time delay of the backscattered light for sample structure reconstructions. Interferometry measures the electric field of the optical beam rather than its intensity. The function form of the electric field in a light wave is
E(t) = E0cos(2πνt −
2π
As show in figure 1.5a, the most commonly used interferometer in LCI is Michelson inter-ferometer. Light Ei(t) from the source is directed into the beamsplitter that splits the beam into the reference arm and a sample arm. The sample arm beam incident on the tissue and undergoes partial reflection whenever it encounters a structure or surface within the tissue. Thus the sample reflected beam Es(t) contains multiple echoes from the interfaces within the tissue. The reference arm beam is directed to a reference mirror and reflected Er(t). Both beams travel back toward the beamsplitter, recombined and interfered, result in the output beam, which is the sum of the electromagnetic fields of both arms
Eo(t) ∼ Es(t) + Er(t). (1.2)
As the detector measures the output intensity which is proportional to the square of the electromagnetic field, it can be written as
Io(t) ∼ 1 4|Es|2+ 1 4|Er|2+ 1 2EsErcos(2 2π λ ∆l) (1.3)
in which ∆l is the path length difference between the sample arm and reference arm. Varying the position of the reference mirror changes the value of ∆l will cause the two beams to interference constructively or destructively. The intensity will oscillate between maximum and minimum each time the path length between reference arm and sample arm changes by one optical wavelength.
Figure 1.5 – Intereference in low coherence interferometry. (a) A classic Michelson interferometer in which the backscattered or backreflected light is interfered with a scanning reference mirror. (b) If the light source is coherent, interference fringes will be observed for a wide range of path length difference. (c) If low coherence length light is used, interference occurs only when the optical path lengths of the two arms are matched within the coherence length lc.
As it is shown in figure 1.5(b), if the light beam is coherent, interference patterns will be observed for a wide range of relative path length differences of the reference and sample arms.
1.4. OCT performances 13
However, in optical imaging, it is crucial to know the precise position of the structures within the sample, thus light with a low temporal coherence length (broad bandwidth) should be used. Low temporal coherence light is characterized by the temporal coherence length lc,which is inversely proportional to the frequency bandwith. It is also the spatial width of the field autocorrelation produced by the interferometer. With low temporal coherence length light (figure 1.5(c)), interference could only be seen when the paths travelled by the reference and sample arm beams are nearly equal. If the paths are mismatched by more than the coherence length of the light, the two electromagnetic fields from the two beams are not correlated, thus no interference effects are observed.
1.4 OCT performances
The OCT system performances are typically defined by several important parameters such as resolution, field of view and sensitivity. Figure 1.6 illustrate the basic sample arm geometrics of typical OCT systems.
1.4.1 Axial resolution
The dependence of the interference range on the temporal coherence length lc of the broadband source in LCI, as explained in section 1.3, distinguishs OCT from traditional microscopy tech-niques, in which both axial and lateral resolution is dependent on the numerical aperture (NA) of the objectives. In OCT techniques, the determination of the axial resolution is independent of the beam focusing, given by the width of the electromagnetic field autocorrelation function. With a Gaussian-shaped spectrum, the OCT axial resolution is calculated as
∆z = 2ln2
π · λ2
∆λ (1.4)
in which λ is the center wavelength of the light source and ∆λ is the full-width-half-maximum (FWHM) of the spectrum.
1.4.2 Lateral resolution
The lateral resolution of OCT is determined by the diffraction limited spot size on the focus plan that is proportional to wavelength and inversely proportional to the NA or the focusing angle of the beam. This could be calculated as
∆x = ∆y = 4λ
π · f
d (1.5)
in which λ is the center wavelength, d is the size of the incident beam on the objective lens and f is the focal length [12]. So better lateral resolution could be obtained with large NA objective to form smaller spot size.
In fact in fiber-based OCT systems, the single mode fiber end works as a pinhole aperture in a reflection mode confocal microscopy to reject out-of-focus light and scattered photons, while explained later in full-field OCT (FFOCT) with spatially incoherent illumination the
spatial coherence area works as pinholes. In this way, the lateral resolution is actually slightly improved, calculated as
∆x = ∆y = 0.37 · λ
NA (1.6)
in which λ is the center wavelength and NA is the effective numerical aperture of the system [12].
1.4.3 Field of view
Here, we define the depth of focus (depth of field)of OCT as the axial field of view. OCT imaging is usually performed with low NA focusing. As in microscopy, the axial field of view in OCT is related to the transverse resolution, defined as
F OVaxial =
π∆x2
2λ , (1.7)
and the lateral field of view is typically determined by the scanning angle and can be calculated as
F OVlateral = 2 · f · θmax (1.8)
in which f is the focal length of the objective and θmaxis the maximum one-side scanning angle. As discussed later, FFOCT achieves 3-dimensional imaging by doing en face imaging with depth scanning. The axial field of view is then limited by sample scattering and the lateral field of view is depend on the detector array size and system magnification.
Figure 1.6 – Schematic of OCT sample arm optical geometrics. Formulas for calculating resolution and field of view of typical OCT systems are provided.
1.5. OCT techniques 15
1.4.4 Sensitivity
OCT is able to measure very weak signal due to the fact that it detects the amplitude instead of the intensity with interferometry that is equivalent to optical heterodyne detection. The weak electric field of the sample beam from the tissue is multiplied by the large amplitude field form the reference arm, thus amplified the interference signal amplitude.
The most well-known expression for signal-to-noise ration (SNR) calculation is
SNR= 10log( ηP
2hνBdetection), (1.9) in which η is the detector responsivity, hν is the photon energy, P is the signal power from the sample arm and Bdetection is the electronic detection bandwidth. As Bdetection is related with A-scan depth and time, higher optical power would be needed to achieve the same SNR for higher imaging speed or resolution. Detailed calculation of the sensitivity for various modes of OCT could be found in section 2.9 in reference [12]. Based on the optical design and acquisition requirements, current OCT systems could reach sensitivities up to around −110dB [54].
1.5 OCT techniques
Based on the image generation geometries, point-by-point scanning or en face plane-by-plane imaging, OCT techniques can be briefly divided into scanning OCT or parallel OCT.
1.5.1 Scanning OCT
In scanning OCT systems, spatially coherent illumination like super-luminescent diode (SLD) or frequency-swept laser are typically used.
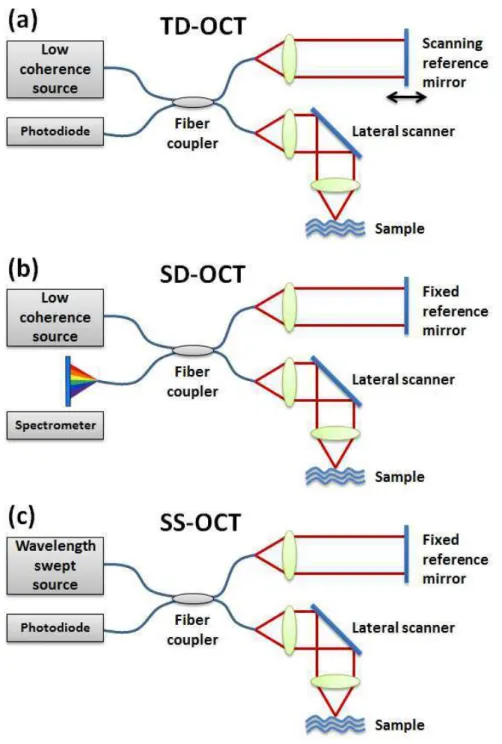
In early developed OCT systems, a scanning reference arm is implemented in a time-domain LCI with lateral scanning sample arm. In such systems, an A-scan is acquired by axially scanning the reference mirror to detect axial positions of the light re-emitting sites in samples. A series of A-sans at different lateral positions are performed using the lateral OCT beam scanner to addresses laterally adjacent sample positions in order to generate two-dimensional cross-sectional images (B-can). Such type of OCT modality in which the depth profile in the sample is obtained sequentially in time by scanning the reference mirror with a constant speed is called time-domian OCT (TD-OCT) as shown in figure1.7(a) [1]. en face scanning TD-OCT technique named optical coherence microscopy (OCM) has also been developed to achieve higher lateral resolution with higher NA objectives [55]. In OCM, instead of acquiring A-lines by scanning the reference mirror, en face image is obtained first by fast modulation of the lateral scanners. 3-dimensional image is then acquired by doing depth scanning with reference mirror.
Since the needs for mechanical scanning to obtain A-scans in TD-OCT limits the acquisition speed and SNR, soon after the report of TD-OCT, Fourier-domain OCT (FD-OCT) techniques was developed with increased imaging speed and system sensitivity [56–59], in which the depth profile is resolved in Fourier space as a function of the frequency. A-scans then be acquired by a Fourier transform of the frequency encoded profiles. Two methods are developed to record
Figure 1.7 – Schematic of different scanning OCT techniques. (a)Time-domain OCT with scanning reference mirror, (b)Spectral-domain OCT with spectrometer amd (c)Swept-source OCT with wavelength swept source.
the frequency spectrum of the interference signal. One uses a diffraction gating and a high speed line-scan camera to form a spectrometer, in which the spectrum frequency is associated with the depth location of the backscattering features with in the sample. This technique is called spectral-domain OCT (SD-OCT) [59–61] as shown in figure 1.7(b). The other method of FD-OCT is using an narrow-bandwidth, frequency-swept light source and a photodiode as detector is called swept-source OCT (SS-OCT) (figure 1.7(c)) [62–64], in which the frequency profile is obtained by rapidly swept the emission wavelength of the light source and record the instantaneous interferometric signal with the photodetector as a function of time.
1.5. OCT techniques 17
no need for the scanning of reference arm. With the same imaging speed of TD-OCT and FD-OCT, FD-OCT techniques will offer considerably better sensitivity.
1.5.2 Parallel OCT
Figure 1.8 – Schematic of parallel OCT techniques. (a)Wide-field OCT with spatially coherent illu-mination like SLD [65]. (b)Full-filed OCT with spatially incoherent illuillu-mination like halogen lamp [4].
Parallel OCT system takes en face images without lateral scanning. Unlike OCM technique, in which lateral scanning works with photodiode to to form an en face image, parallel OCT enables non-scanning en face imaging with the planes that are perpendicular to optical axis with specific detectors and methods and achieves high pixel density images over the wide fields of view. Parallel OCT could be achieved with either spatially coherent illumination or spatially incoherent illumination. Parallel OCT system with spatially coherent light source like SLD or femtosecond laser is called wide-field OCT (WFOCT) [65–69], while the system with spatially incoherent light source like halogen lamp or LED is called full-field OCT (FFOCT) [4].
In WFOCT systems as shown in figure 1.8(a), as spatially coherent illumination is used, optical beams are usually broadened with lens to form parallel illumination on both sample the reference mirror. En face images of large field could be achieved without scanning. With powerful laser sources or SLDs, WFOCT has high sensitivity. But due to the fact that spatially coherent light is used, WFOCT usually suffers strong cross-talks generated by the multiply scattered light collected by parallel detection [70–72].
The details of FFOCT system would be introduced in chapter 4, briefly speaking, as shown in figure 1.8(b), FFOCT uses spatially incoherent source in a Linnik interferometer, in which microscope objectives are used in both arms to achieve high spatial resolution. As demonstrated in [70], the cross-talks are severely reduced in FFOCT with spatially incoherent light sources. Also, due to the spatial incoherence of illumination, the spatial resolution of FFOCT is found to be insensitive to geometric aberrations, which is well established in chapter 5.
CHAPTER
2
Wavefront correction with adaptive optics
Table of contents
2.1 Wavefront aberration . . . 20 2.2 Aberration representation with Zernike polynomials . . . 20 2.3 Strehl ratio . . . 22 2.4 Adaptive optics (AO) . . . 23 2.4.1 Introduction of AO . . . 23 2.4.2 Wavefront corrector . . . 24 Deformable mirror . . . 24 Liquid crystal spatial light modulator . . . 25 Adaptive liquid lens . . . 25 2.4.3 Direct wavefront sensing . . . 27 Shack-Hartmann wavefront sensor . . . 27 2.4.4 Indirect wavefront measurement based on image analysis . . . 27 Metric-based sensorless algorithms . . . 28 Phase diversity . . . 29 Pupil segmentation . . . 30 2.5 Computational adaptive optics . . . 30
2.1 Wavefront aberration
Optical wavefront is an imaginary surface that connecting all the wave points with identical phase, or geometrically points with identical optical path length (OPL) from one point of the source. In a perfect optical imaging system, when the light from one point of the object could direct into a corresponding single point on the detection plan after passing through all the optics, it is usually called a diffraction-limited imaging system in which flat wavefront are formed in the pupil plan. But in realistic imaging systems, due to the imperfection of optical elements or the inhomogeneity of light propagating medium, optical wavefront could be distorted, resulting in blurring of the image. These causes of the departure of the optical wavefront from the predictions of paraxial optics is called optical aberrations or wavefront aberrations.
Technical developments have helped to remove most of the optical element-induced aberra-tions in imaging systems. Multi-element objectives are used to remove both monochromatic and chromatic aberrations in microscopy. Non-planar folding of the off-axis spherical mirror [73], toroidal mirror [74] or off-plane design of reflective optics [75] has also been implemented in retinal imaging systems to reduce system induced aberrations. But sample-induced wavefront aberration is still another challenge for optical imaging. Wavefront distortions could be induced by the atmosphere turbulence in telescope imaging, the structure heterogeneity of biological sample in deep tissue imaging, the curvature irregularities of the cornea and lens or eye diseases in human eye imaging, etc.
2.2 Aberration representation with Zernike
polynomi-als
It is needed to mathematically represent wavefront aberrations in order to evaluate their effects on imaging. Due to the complicity of a wavefront surface, polynomials are typically used to simplify the description. And the commonality of circular apertures in telescopes and lens makes treatment in polar coordinates more preferable. Zernike polynomials is one of the most commonly used orthonormal polynomials over circular pupils that have been widely used in astronomy and in vision for wavefront aberration representation [76–79].
Any wavefront aberration function could be decomposed into a linear combination Zernike polynomials as W(r, θ) = W (Rρ, θ) = ∞ X i=0 ciZi(ρ, θ) (2.1)
2.2. Aberration representation with Zernike polynomials 21
in which W (r, θ) is the wavefront aberration with circle pupil size of R, ρ is the normalized pupil radius ρ = r/R, Zi(ρ, θ) are a set of Zernike polynomials and ci are the ith Zernike coefficient which determine the weight of each Zernike mode in the overall wavefront structure. Owing to the orthonormality, ci could be calculated by
ci = 1 π Z 2π 0 Z 1 0 W(Rρ, θ)Zi(ρ, θ)ρdρdθ. (2.2)
The orthonormality of Zernike polynomials is defined as 1 π Z 2π 0 Z 1 0 Zi(ρ, θ)Zj(ρ, θ)dρdθ = δij (2.3)
in which δij is the Kronecker delta. δij = 1 when i = j; otherwise, δij = 0.
Figure 2.1 shows the first 15 Zernike circle polynomials, as shown in the formulas of different Zernike polynomials, higher-order polynomials is balanced with lower-order polynomials so that each Zernike polynomials gives a minimum variance. And the orthonormality of ensures that we can truncate the Zernike modes to lower orders without affecting the remaining Zernike coefficients. All the Zernike modes except for piston have a mean of zero.
To quantify the similarity of the aberrated wavefront to a reference flat wavefront, the wave-front error σ (or root mean square (RMS))of the wavewave-front aberration for a circular pupil is used and can be expressed as
σ2 = 1 π Z 2π 0 Z 1 0 (W (Rρ, θ) − W0(Rρ, θ)) 2ρdρdθ. (2.4)
Since the reference is considered to be flat and equal to zero, and if the aberrated wavefront is decomposed by Zernike polynomials, according to equation 2.1 and 2.2, the wavefront error could be calculated as σ2 = 1 π Z 2π 0 Z 1 0 ( ∞ X i=0 ciZi(ρ, θ))2ρdρdθ= ∞ X i=0 c2i. (2.5)
This equation is commonly used to give a parameter for the image quality with a given wavefront aberration, especially for ocular aberrations. And typically the coefficients for piston and tilt (i = 0, 1, 2) are ignored as this do not change the image quality.
2.3 Strehl ratio
Beside of the wavefront error σ, Strehl ratio is another parameter that gives information about the degradation of image quality of wavefront aberrations. Strehl ratio S is defined as the the ratio of the "best focus" image intensity from a point source in the presence of aberrations compared to its maximum diffraction-limited intensity using an ideal optical system without aberrations. Thus the Strehl ratio has a value between 0 and 1, and mathematically can be expressed as S = 1 π2| Z 2π 0 Z 1 0 e i2π∆W (ρ,θ) ρdρdθ|2 (2.6) in which ∆W is the wavefront aberration relative to the reference wavefront. An estimation formula is also widely used for simple approximation of the Strehl ratio down to 0.1 expressed as:
S ≈ e−σ2
(2.7) in which σ is the wavefront error defined by equation 2.4. Based on the Maréchal criterion [81], system could be considered as aberration-free when the Strehl ration is bigger than 0.8, which corresponding to a wavefront error 6 λ/14.
2.4. Adaptive optics (AO) 23
2.4 Adaptive optics (AO)
2.4.1 Introduction of AO
Adaptive optics (AO) is a kind of technology, rather than an imaging system, that can be used in combination with imaging modalities to dynamically sensing and compensating the wavefront aberrations induced by systems or samples to improve the optical image quality. Based on the general definition, AO is actually far more common in our daily life, for example, the human eye itself is an adaptive system that could alter the pupil size and lens curvature to form good images on the retina, or the autofocus function in every cellphone camera with internal control loops. The concept of AO was first proposed in 1953 by Horace W. Babcock [82] and originally applied to astronomical telescopes [83] for correcting wavefront distortions induced by atmosphere turbulence due to the variations of refractive index in different layers. Compared with sending imaging systems to outer space to get rid of the aberration effects, AO coupled telescopes are more cost-efficient and can also achieve resolution close to diffraction-limit.
Figure 2.2 – Simplified schematic of a basic adaptive optics system in an optical imaging system [84].
Beside of its indispensable application in astronomical imaging, AO has actually played a significant role in various biological imaging areas to improve image quality. Although the modern optical systems could be almost perfect, aberrations could still come from the imperfect assembly of customized systems, the inhomogeneity of imaging medium and also the sample
itself. Particularly in retina imaging, as optical wavefront need to pass the anterior part of the eye, from where most of the ocular aberration is induced, AO is essential in many in vivo retinal imaging modalities like fundus camera [85], scanning laser ophthalmoscopy (SLO) [86] and OCT, which will be discussed in section3.1.2, to achieve better resolution.
Figure 2.2 shows a simplified schematic of the AO part for an optical imaging system. The incoming light is aberrated with distorted wavefront. Reflected by an adaptive mirror (de-formable mirror), the light is then split by a beamsplitter with part of it going to the wavefront sensor and the rest to the high resolution camera. The wavefront aberration is measured by the sensor and through the control system the measured aberration is inversely applied to the adaptive mirror to correct the distorted wavefront. Thus the corrected wavefront would go to the imaging system to form high resolution images. The main part of an AO system is the wavefront corrector for aberration correction and the wavefront sensor for aberration determi-nation. Of course many wavefront sensorless methods have also been developed, which will also be discussed.
2.4.2 Wavefront corrector
As a key part of an AO system, wavefront corrector works by altering the OPL to delay the leading parts of the aberrated wavefront so that the trailing parts could catch up to form a flat wavefront. Based on the way of changing the OPL, wavefront correctors can be briefly divided into two catalogues: changing the physical shape of the reflective surface like deformable mirrors; and altering the refractive index by transmissive devices like liquid crystal spatial light modulators or adaptive liquid lens. Depends on the nature of aberrations being corrected, imaging system requirements and correction accuracy, different wavefront correctors have their own pros and cons.
Deformable mirror
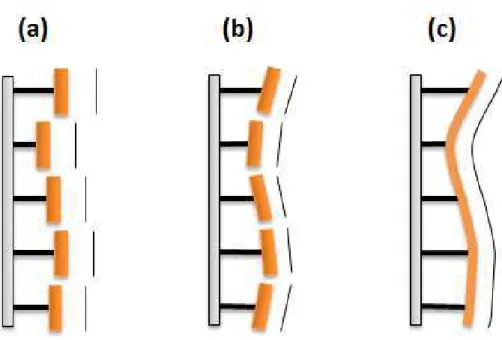
Up to today, many kinds of deformable mirrors have been developed and used in AO systems. The earliest implementation is segmented mirror [87] that are made by a number of closely assembled small mirrors with square, hexagonal or circular shapes. Each segment is controlled separately with actuators that are able to perform piston-only (figure 2.3(a)) or piston with tip and tilt (figure 2.3(b)) motions. Segmented mirrors are able to approximate the wavefront correction with relatively large number of segments, but the discontinuity between segments would induce discontinuous phase correction to the incoming wavefront that will weaken the correction performance. Also the gap between different segmented mirrors would cause energy lose and light scattering due to the diffraction form the edge of the segments. These problems are solved by deformable mirrors with continuous surface (figure 2.3(c)).
Deformable mirrors with continuous surface also work with physical deformations to match the required wavefront correction shape. While the reflecting surface is continuous, the devices that perform the deformation can be either continuous like in membrane mirror [88] or bimorph mirror [89], or discrete like in edge-actuated deformable mirror [90].
2.4. Adaptive optics (AO) 25
Figure 2.3 – Simplified schematic of different deformable mirrors and the wavefront representa-tion. (a)Segmented mirror that has piston-only actuators; (b)Segmented mirror that has piston with tip and tilt actuators; and (c) Deformable mirror with continuous reflective sur-face.
Liquid crystal spatial light modulator
Liquid crystal spatial light modulators (LCSLM) are operated by altering the orientation of liquid crystals with electrostatic forces to change the refractive index of different pixels in-dependently. The phase or amplitude or both of the wavefront could be varied in either a transmissive or reflective way. As the performance of LCSLM is wavelenth and polarization dependent, its application is limited to small bandwidth polarized light. But as the pixels of LCSLM can be very small and independent, it can achieve high-order aberration corrections with large number pixels and a low control voltage. Although the phase modulation range is confined from 0 to 2π, aberration correction for larger dynamic range could be achieved by phase wrapping techniques [91].
In our work on the AO-FFOCT, we choose to use a transmissive LCSLM [92] as it fits per-fectly for our simplified AO-FFOCT system, which will be discussed in details in chaper 6. The LCSLM is a transmissive hexagonal array SLMs (figure 2.4(a)) achieves more than 90% trans-mittance with 127 pixels of anisotropic nematic liquid crystal molecules that are aligned with their long axes parallel, but with their centres randomly distributed as shown in figure 2.4(b). With no voltage applied, the liquid crystal molecules lie parallel and maximum retardation is achieved. When voltage is applied, liquid crystal molecules begin to tip perpendicular causing a reduction in the effective birefringence and hence, retardance.
Adaptive liquid lens
Adaptive liquid lenses are transimissive wavefront correctors based on the physical change of the liquid lens shape and have the advantages of intrinsic smooth continuous interface, adaptively tunable optical power, polarization insensitive and also vibration resistance with two density-matched liquids employed. Using the electrowetting [93] or dielectrophoretic [94] phenomena,
Figure 2.4 – Transmissive liquid crystal spatial light modulator [92]. (a)Hexagonal SLM pixel ge-ometry with 127 pixels; (b)Liquid crystal variable retarder construction showing molecular alignment without and with applied voltage.
the interface properties between two immiscible liquids could be altered to change the liquid lens curvature. This could also be achieved by applying a hydraulic pressure in one of the chamber to displace the liquid and bend the deformable membrane (figure 2.5), which is used to separate the two liquids. Many methods have been proposed to generate the required pressure such as thermal, electromagnetic, electrostatic, piezoelectric actuators and so on [95–98]. Adaptive liquid lenses are relatively new technology and are promising in many applications like cellphone cameras and vision sciences.
Figure 2.5 – Adaptive liquid lens couvature changes [99]. By adjusting the voltage, the hydraulic pressure is altered to bend the deformable membrane.
2.4. Adaptive optics (AO) 27
2.4.3 Direct wavefront sensing
Wavefront sensing deals with the aberration determination. Many AO systems nowadays do have a way to sense the optical wavefront directly with enough spatial resolution and speed to apply a real-time correction with wavefront correctors. There are various kinds of direct wavefront sensing techniques have been developed such as curvature sensing [100,101], pyramid wavefront sensor [102, 103], coherence-gated wavefront sensing [104, 105]. Beside these, Shack-Hartmann wavefront sensor is probably the simplest in concept and most widely used in both astronomy and ophthamology applications.
Shack-Hartmann wavefront sensor
Invented in 1971, the Shark-Hartmann wavefront sensor is an optical system derived from the Hartmann method [106] for a number of measurements like human eye aberration determina-tion, laser beam quality evaluadetermina-tion, and astronomical aberration measurement. As shown in figure 2.6 Shark-Hartmann wavefront sensor is composed of a 2D array of miniaturized lenslets that is placed in front of a detector at a distance equal to the focal length of the lenslets. Typ-ically, the lenslets array is conjugated with the pupil plane of an optical system. When there is no aberration, the wavefront arriving at the lenslets array is planar thus the incoming light is formed into many small spots onto the detector as shown in figure 2.6(a). When aberration presents, the small spots focused on the detector is shifted from the center optical axis position as shown in figure 2.6(b). These displacements of the small spots corresponding to the local slope of the wavefront arriving at the lenslets. With centroid algorithm [107] and wavefront reconstruction method [108], the wavefront within the subaperture could be estimated.
2.4.4 Indirect wavefront measurement based on image analysis
The performance of direct wavefront measurement in AO systems could be limited by many sources of errors such as the accuracy of the wavefront sensor, non-common path errors, back reflection from lens based systems, etc. Also the lack of guiding star in many situations makes wavefront measurement ambiguous as the wavefront sensor would response to all the light impinging upon it and one cannot be sure whether the measured wavefront corresponds to the aberration that are induced to the light coming from the focal plan. For these reasons, Indirect methods that rely on the optical image itself, which is formed by the light coming from the focal plan, as the source for wavefront measurement has been developed. The basic principle is to use the effects of aberrations on the image to optimize the image quality. With a wavefront corrector in the optical beam path, known aberrations are generated before images are recorded. By analysing how the additional known test aberrations changes the image quality, optimization could be achieved by various algorithms to decide the best aberration correction parameters for wavefront corrector. In contrary to the direct wavefront measurement which invariably adds extra hardware like Shack-Hartmann wavefront sensor, indirect methods needs only the wavefront corrector. Up to today, methods like metric-based sensorless algorithms, phase diversity and pupil segmentation have been developed and applied to various applications like microscopy or OCT.
Figure 2.6 – Principle of operation of a Shark-Hartmann wavefront sensor [109]. The wavefront spot patterns produced by a planar wavefront (a) and by an arbitrarily aberrated wavefront (b). The blue dotted circles represent the lenslets.
Metric-based sensorless algorithms
The concept of metric-based sensorless algorithms, or sensorless AO, is actually analogue to what people do when adjusting a microscope for focusing. While adjusting the distance between the objective and specimen, the operator is actually evaluating the imaging quality based on the intrinsic appreciation of good image, which should be sharp and reveal enough details and contrast, until the image quality is maximised. Although the process is subjective, it is still a search algorithm in which the distance change works as an input that alters the image metric until it is maximized. In sensorless AO, the variable input could be all the aberration modes like defocus, astigmatism, coma, spherical, etc. Various type of aberration modes could be applied with a wavefront corrector in the system. The image metric is defined mathematically as the contrast, total intensity, or parameters of interested image regions. The choice of different
2.4. Adaptive optics (AO) 29
optimization algorithms in sensorless AO actually leads to considerable differences in their performance. Briefly, these approaches can be divided into two categories: model-agnostic algorithms and model-based algorithms.
Model-agnostic algorithms are designed to solve problems with very little background and no theoretical model is available for describing how aberrations will affect the functional image metrics. Methods like hill-climbing [110],genetic search [111, 112],conjugate gradient methods [113], etc. have been developed and applied to microscopy and imaging. The drawback of these methods is that they require large number of measurements for optimization and still may not be able to achieve the global optimum.
Model-based algorithms have been implemented in a range of imaging techniques [114–117] since the effects of aberrations on the imaging process can be modelled using theory or through empirical observations. Still these algorithms are metric-based, but in contrast to model-agnostic algorithms, the iamging model is used here to determine an orthogonal set of test aberration modes which affects the metric independently, allowing the determination of the optimum aberration correction with few test images per modes. Zernike polynomials are the most widely used approach as the orthogonality ensures that the parameters of each modes are determined independently, leading to non-iterative operations. The metric of test images could be approximated by quadratic, Gaussian or Lorentzian functions to define the optimum parameters. Figure 2.7 shows an example of the general procedure of model-based algorithms. The algorithm we applied to our AO-FFOCT system for low order aberration correction is also a model-based wavefront sensorless algorithm which will be discussed in section 6.3.
Figure 2.7 – General procedure of model-based algorithms [118]. Three test images of speckle pat-terns(a1,b1,c1) while changing the parameters of one specific aberration mode are taken. The respective metric values are calculated (a3,b3,c3) and modelled metric curve (black solid line) allows the determination of the optimal parameter for this specific mode(d1,d3). Some procedures could be applied to the other orthogonal aberration modes.
Phase diversity
In phase diversity method, a small set of test images are recorded with different test aberrations (phase-only) added. The actual aberrations, which are coherent with all the test images, are determined with phase retrieval algorithms. Instead of relying on a single metric, the full
information content of different images is combined to find the most likely form of all the aberration modes. The exact implementation of phase diversity varies such as the heuristic approaches in electron microscopy [119] or wide-filed microscopy [120] and also a maximum likelihood approach in astronomical applications [121, 122].
Pupil segmentation
For pupil segmentation [123], instead of using a phase modulation, the test aberration is a spatial amplitude modulation. By exciting fluorescence through various subregions of the microscopy objective pupil and acquiring separate fluorescence images, the lateral shift of the signal could be acquired, which gives an estimation of the average wavefront title of that subregion. Simply speaking, it is an inverse Hartmann test. A more recent pupil segmentation method called zonal-based approach [124, 125] uses full-pupil illumination and takes total intensity as the metric while performs sequential 2D tip-tilt scans of different segments of the wavefront to determine the optimal condition.
2.5 Computational adaptive optics
Besides the AO techniques discussed in former section that wavefront shaping could be done with many hardware methods, it is also possible to do wavefront correction computationally. It has been shown that using interferometric detection, the complex optical wavefront could be measured. Thus the phase of the wavefront could be modified computationally. Analogous to what people do with a wavefront corrector, computational AO modifies the wavefront by adding different phase filters to the original data. And the similar methods to hardware AO with image metrics, wavefront sensor or guiding stars have also been performed in computaional AO using the interferometric data [126–128]. Computational AO has been applied for high-resolution human retinal imaging in different kinds of OCT systems for aberration correction [129–131]. Note that computational AO methods are mostly adapted to systems with spatially coherent illumination.
CHAPTER
3
The human eye and retinal imaging
Table of contents
3.1 Imaging properties of human eye . . . 32 3.1.1 The structure and geometry of human eye . . . 32 Human retina . . . 33 3.1.2 Eye aberrations . . . 34 3.1.3 Eye movements . . . 36 3.2 Retinal imaging . . . 37 3.2.1 Flood illuminated fundus camera . . . 37 3.2.2 Scanning laser ophthalmoscope . . . 38 3.2.3 OCT retinal imaging . . . 39 Ultrahigh-resolution OCT retinal imaging . . . 40 AO-OCT retinal imaging . . . 41
3.1 Imaging properties of human eye
The human eye,one of the most finely tuned evolutions in the animal world, is a robust and unique organ that works as a complete imaging system. It is composed of refracting optics (cornea and crystalline lens), aperture (iris) and photosensitive detector (retina). Compared with artificial imaging systems, which are often composed of complex optical parts to ensure high imaging performance, the eye is rather simple but does great job for vision. It forms high resolution images of objects from a large field of view at different distance using transparent tissue to the retina. And the detected light signal is converted into elecro-chemical impulses in neurons. The eye provides the only direct view of the central nervous system, thus it is quite interesting for early detection of retinal and possibly systemic diseases. But if we want to inversely image the retina, the optical properties of human eye impose severe constraints on how much information we can get and how well we can resolve the details. This includes the eye aberration and eye motion problems.
3.1.1 The structure and geometry of human eye
As shown in figure 3.1(a), the eye ball is a hollow and approximately spherical structure. Externally it is mostly covered by sclera, a resistant and flexible tissue that contains many collagen fibres, to protect and maintain the shape of the eye ball. While in the anterior part, it is a transparent portion that is called cornea. The cornea is avascular tissue that admits and helps to focus light when it enters the eye. Internal to the sclera, there are two layers: the choroid and the retina. The choroid lies adjacent to the sclera and contains numerous blood vessels to provide nutrients and oxygen to the other tissues. It also contains pigmented cells that absorb light and prevent it from being reflected within the eye ball. The retina, where the light is absorbed by the photoreceptors after image formation, is the neural and sensory layer of the eye ball. Structural details of human retina will be further discussed in the following section.
The light reaching the eye ball is first refracted by the transparent cornea. After the cornea, before the iris and lens, the anterior chamber is filled with a thin watery fluid called aqueous humour, that helps to maintain the shape of the front part of the eye and provides nutrients to the lens and cornea. The iris contains two types of smooth muscles, circular muscles and radial muscles, and has an opening in the centre called pupil whose size is adjustable (2 mm to 8 mm) by the muscles to control the amount of light entering the eye. The crystalline lens is a transparent, biconvex, elastic structure that works together with cornea to form images on the retina. while the cornea has a fixed optical power, the lens is an active optical component that could change its shape from time to time by ciliary body to focus objects from various
![Figure 1.2 – OCT cross-sectional or 3-dimentional image formation [12]. Measurements of the backscattered light versus imaging depth forms axial scans(A-scan)](https://thumb-eu.123doks.com/thumbv2/123doknet/2298244.24361/26.892.117.822.670.950/figure-sectional-dimentional-formation-measurements-backscattered-versus-imaging.webp)
![Figure 1.3 – Comparison of resolution and imaging depth for ultrasound, OCT and confocal mi- mi-croscopy [12].](https://thumb-eu.123doks.com/thumbv2/123doknet/2298244.24361/27.892.178.651.479.975/figure-comparison-resolution-imaging-depth-ultrasound-confocal-croscopy.webp)
![Figure 1.4 – OCT human retinal images indicating macular hole and detachment [15]. (a)OCT image shows a macular hole on the retina.(b) OCT image demonstrates detachment of the neurosensory retina.](https://thumb-eu.123doks.com/thumbv2/123doknet/2298244.24361/28.892.108.829.241.495/figure-retinal-indicating-macular-detachment-demonstrates-detachment-neurosensory.webp)
![Figure 1.8 – Schematic of parallel OCT techniques. (a)Wide-field OCT with spatially coherent illu- illu-mination like SLD [65]](https://thumb-eu.123doks.com/thumbv2/123doknet/2298244.24361/34.892.114.814.186.536/figure-schematic-parallel-techniques-wide-spatially-coherent-mination.webp)
![Figure 2.1 – First 15 Zernike circle polynomials and their surface map representations [80].](https://thumb-eu.123doks.com/thumbv2/123doknet/2298244.24361/38.892.181.759.255.1137/figure-zernike-circle-polynomials-surface-map-representations.webp)
![Figure 2.2 – Simplified schematic of a basic adaptive optics system in an optical imaging system [84].](https://thumb-eu.123doks.com/thumbv2/123doknet/2298244.24361/40.892.241.712.496.981/figure-simplified-schematic-basic-adaptive-optics-optical-imaging.webp)
![Figure 2.4 – Transmissive liquid crystal spatial light modulator [92]. (a)Hexagonal SLM pixel ge- ge-ometry with 127 pixels; (b)Liquid crystal variable retarder construction showing molecular alignment without and with applied voltage.](https://thumb-eu.123doks.com/thumbv2/123doknet/2298244.24361/43.892.98.758.106.380/transmissive-modulator-hexagonal-variable-retarder-construction-molecular-alignment.webp)
![Figure 2.6 – Principle of operation of a Shark-Hartmann wavefront sensor [109]. The wavefront spot patterns produced by a planar wavefront (a) and by an arbitrarily aberrated wavefront (b)](https://thumb-eu.123doks.com/thumbv2/123doknet/2298244.24361/45.892.188.668.103.789/principle-operation-hartmann-wavefront-wavefront-arbitrarily-aberrated-wavefront.webp)
