Physical quality of bauxite tailing after a decade of environmental
recovery
1Qualidade física de um rejeito de bauxita após uma década de recuperação ambiental
Lorena Abdalla de Oliveira Prata Guimarães2*, Luiz Eduardo Dias3, Genelício Crusoé Rocha3, Igor Rodrigues
de Assis3 and Raphael Bragança Alves Fernandes3
ABSTRACT - Tailings from bauxite washing produced in Porto Trombetas, Pará state, a Brazilian Amazon region, have
chemical and physical characteristics limiting the development of plants, which hinders to revegetate the tanks where they are deposited. This study was carried out under field conditions, and aimed to assess the physical quality of these tailings after a decade of recovery practices. Three treatments were assessed: no application of inputs and planting of seedlings (T1) and two levels of fertilization, one with lower (T2) and other with higher (T3) doses of limestone and fertilizers associated with planting tree seedlings. After ten years of experimentation, penetration resistance (PR) and substrate moisture up to 60 cm depth were assessed and the least limiting water range (LLWR), water retention curve (WRC), and pore size distribution were determined and calculated. After a decade of environmental recovery, differences in physical characteristics were observed in the tailings due to different revegetation modes. Moisture in the substrate profile, LLWR, WRC, and pore size distribution were sensitive indicators to variations in substrate physical quality. Liming, fertilization, and planting of seedlings are necessary for revegetation and improvement of the physical quality of tailings. Treatment T3 was the best intervention identified so far for tank revegetation. The absence of fertilization and planting precludes revegetation even with sources of propagules nearby.
Key words: Revegetation. Mining. Natural regeneration.
RESUMO - Os rejeitos da lavagem da bauxita produzidos em Porto Trombetas, Pará, no interior da Amazônia brasileira,
possuem características químicas e físicas limitantes ao desenvolvimento de plantas, o que dificulta a revegetação dos tanques onde são depositados. Este trabalho, realizado em condições de campo, avaliou a qualidade física desses rejeitos após uma década de práticas de recuperação. Três tratamentos foram avaliados: sem aplicação de insumos e plantio de mudas (T1) e dois níveis de fertilização, um com as menores (T2) e outro com as maiores (T3) doses de calcário e adubos associadas ao plantio de mudas de espécies arbóreas. Decorridos dez anos de experimentação, a resistência à penetração (RP) e a umidade do substrato, até 60 cm de profundidade, foram avaliadas e o Intervalo Hídrico Ótimo (IHO), curva de retenção de água (CRA) e distribuição de poros por classes de diâmetro foram determinados e calculados. Após uma década de recuperação ambiental, foi possível verificar diferenças nas características físicas do rejeito em função das diferentes formas de revegetação. A umidade no perfil do substrato, o IHO, a CRA e a distribuição de poros foram indicadores sensíveis às variações na qualidade física dos substratos. A calagem, a adubação e o plantio de mudas são necessários para a revegetação e melhoria da qualidade física do rejeito. O tratamento T3 é a melhor intervenção identificada até o momento para a revegetação dos tanques. A ausência de adubação e plantio impossibilita a revegetação, mesmo existindo fontes de propágulos nas proximidades.
Palavras-chave: Revegetação. Mineração. Regeneração natural.
DOI: 10.5935/1806-6690.20180022 *Author for correspondence
Received for publication on 11/10/2016; approved 04/07/2017
1Parte da Dissertação de Mestrado do primeiro autor; pesquisa financiada por CAPES, FAPEMIG e Mineração Rio do Norte/MRN 2Instituto Capixaba de Pesquisa, Assistência Técnica e Extensão Rural/Incaper, Vitória-ES, Brasil, lorena.prata@hotmail.com
3Programa de Pós-Graduação em Solos e Nutrição de Plantas, Departamento de Solos, Universidade Federal de Viçosa/UFV, Viçosa-MG, Brasil, ledias@ufv.br, genelicio.rocha@ufv.br, igor.assis@ufv.br, raphael@ufv.br
INTRODUCTION
Bauxite is the most important industrial ore for producing aluminum. It is not a mineral species per se, but a heterogeneous material formed by a mixture of aluminum oxyhydroxides and impurities, such as kaolinite, quartz, hematite, goethite, among others (ALMEIDA et al., 2012). The amount and composition of refinery residues of bauxite ore depend on their purity and extraction conditions and differ between refineries (WEHR; FULTON; MENZIES, 2006).
Brazil is the third world’s largest bauxite producer (SANTINI; KERR; WARREN, 2015) and the state of Pará accounts for 75% of its exploitation (PINTO et al., 2012). The region of Porto Trombetas, Oriximiná, PA, is responsible for most of the Brazilian bauxite production.
After the mining process, the ore exploited in Porto Trombetas is beneficiated by means of grain size reduction and washing, which produces an acid tailing deposited in tanks constructed in the mined areas. Approximately a year and a half after deposition, tailing is solidified and the revegetation process of tanks is started.
Technosols formed after tailing disposal (SANTINI; FEY, 2016) present chemical and physical characteristics that are inadequate for plant development, which makes the recovery process difficult. The substrate is acid and low in nutrients, with a high clay content and mineralogy composed of kaolinite and gibbsite (CAPRONI et al., 2007; REIS, 2006). Because of the kaolinitic clay, tailing sedimentation occurs in a controlled manner during drying, forming blocks very resistant to root penetration (XUE et al., 2016).
Tailings from ore processing are usually stored in areas that eventually have to be re-vegetated (WEHR; FULTON; MENZIES, 2006). However, no agronomic recommendations are available for revegetating areas or tanks where bauxite tailings are deposited. The lack of these recommendations is one of the factors that lead environmental recovery programs to fail. For this reason, revegetation experiments have been carried out for more than a decade in Porto Trombetas. The best results have been found by planting leguminous species associated with diazotrophic bacteria and mycorrhizal fungi (DIAS; FRANCO; CAMPELLO, 2007). In addition to the importance of legumes in symbiotic associations, other strategies, such as the addition of fertilizers, are used in order to favor a good establishment and growth of plants. Studies found in the literature on revegetation of bauxite tailings have been conducted for short periods (less than one year) and there is no information whether plant cover survives for longer periods (WEHR; FULTON; MENZIES, 2006). The hypothesis of this study is that the
supply of high doses of limestone and fertilizers associated with the planting of seedlings improves substrate physical quality after ten years of environmental recovery, contributing to the initial establishment and growth of plants. Thus, this study aimed to assess the physical quality of a substrate formed by the tailing disposal from bauxite washing after a decade of interventions in the area.
MATERIAL AND METHODS
Description of the study areaThe experiment was installed in 1999 in the central portion of a tailing tank at a bauxite mine on the Saracá plateau, inside the Saracá-Taquera/ICMBio National Forest, in Porto Trombetas, Oriximiná district, PA, Brazil. Regional climate is defined as Af, i.e. a tropical humid climate (ALVARES et al., 2013).
For characterization purposes, substrate (tailing) samples were collected for particle size analysis (CUNHA
et al., 2014). Sand, silt, and clay contents were 0.068,
0.280, and 0.652 kg kg-1, respectively, for treatment T1,
0.069, 0.293, and 0.638 kg kg-1, respectively, for treatment
T2, and 0.041, 0.286, and 0.673 kg kg-1, respectively, for
treatment T3. Substrates presented a very clayey texture. Description of the experiment
Three revegetation treatments were assessed. The first treatment (T1) consisted of natural regeneration, without anthropic interventions, i.e. without applying limestone and fertilizers and without planting of seedlings. The other two treatments (T2 and T3) consisted of planting seedlings of native tree species and applying different doses of limestone and fertilizers. In
T2, we applied 360, 450, 60, and 30 g pit-1 (600, 750,
100, and 50 kg ha-1) of dolomitic limestone, magnesian
thermophosphate, potassium sulfate, and FTE-BR12, respectively. The doses for T3 were 720, 1,350, 120,
and 60 g pit-1 (1,200, 2,250, 200, and 100 kg ha-1),
respectively. Magnesian thermophosphate was applied during planting of seedlings. The other fertilizers and limestone were divided into two applications. The first application corresponded to one-third of the dose, and was applied in the planting of seedlings, at the bottom of the pits. The second application was applied around the plants one year after planting. After that, the plots did not receive more fertilizers and lime.
In T2 and T3 we planted seedlings of five N-fixing species (Enterololobium maximum, Tachigali vulgaris,
Zygia caractae, Dalbergia spruciana, and Clitoria fairchildiana) and eight non-fixing species (Sizygium
jambolana, Dipterix odorata, Myrciaria dubia, Tabebuia barbata, Parkia discolor, Genipa americana, Alexandra
sp., and Tapirira guianensis). Seedlings were planted with a spacing of approximately 3 × 2 m in pits with varying dimensions made in the cracks formed during substrate drying. Pits were coated with Cecropia wood chips and filled with the topsoil of a primary forest stored less than a year. Treatments were distributed in a randomized block design
with three replications. Each experimental plot had 2,500 m2.
Assessments
Assessments were carried out in 2009, ten years after the experiment was installed. Penetration resistance (PR) and moisture in the substrate profile were both assessed in the field. In the laboratory, the least limiting water range (LLWR), water retention curve (WRC), and pore size distribution were determined and calculated.
PR was assessed by means of an impact penetrometer model IAA/Planalsucar-Stolf (BEUTLER; CENTURION; ALVARO, 2007) up to 60 cm depth, with 25 readings per plot. Simultaneously, substrate samples were collected every 10 cm up to 60 cm depth to determine the moisture in the substrate profile by the thermogravimetric method (DONAGEMMA et al., 2011), being collected five samples per plot.
For laboratory analysis, 40 undisturbed substrate samples were randomly collected by treatment in the 0-5 cm layer. This collection was performed by using 5 × 5 cm rings (height × diameter) and an Uhland sampler.
After saturation by capillarity, groups of four substrate samples were submitted to potential matrices of 4, 6, 8, and 10 kPa in a tension table and 30, -50, -70, -100, -500, and -1,500 kPa in a Richards’s extractor. After reaching equilibrium, these samples were weighed and submitted to penetration resistance tests in the laboratory. For this, a Marconi MA-933 bench electronic penetrometer was used with a constant
penetration velocity of 10 mm min-1. The determination
was performed once at the geometric center of each sample. The readings taken from the 0-1 and 4-5 cm layers of samples were discarded, and then a mean of the values from the 1-4 cm layer was calculated. Subsequently, samples were taken to a drying oven at 105 °C until constant mass for determining moisture and density of the substrate (Ds) (DONAGEMMA et al., 2011) associated with each potential.
For LLWR calculation, PR curve was fitted to the model, as Equation 1 (TORMENA; SILVA; LIBARDI, 1998):
RP = a θb Dsc (1)
Where θ is the volumetric water content of the substrate
(m3 m-3) and a, b, and c are the model parameters fitted to
the data.
Water retention curve was calculated according to Equation 2 (TORMENA; SILVA; LIBARDI, 1998): θ = е(d + eDs) Ψf (2) Where Ψ is the soil water potential (kPa) and d, e, and f is the model parameters fitted to the data.
In order to calculate LLWR, an algorithm developed
in Excel® by Leão and Silva (2004) was used. The critical
values adopted were -30 and -1,500 kPa for the water content estimated for field capacity (FC) and permanent wilt point
(PWP), respectively, 3.5 MPa for PR, and 0.10 m3 m-3
for the minimum aeration porosity (BERTIOLI JÚNIOR
et al., 2012; EHLERS et al., 1983; TORMENA et al.,
2007), which was obtained by Equation 3:
θPA = (1 - Ds/Dp) - 0,10 (3)
Where θPA is the volumetric water content of the substrate
to obtain the minimum aeration porosity (m3 m-3) and D
p is the particle density (kg dm-3).
Dpwas determined by the volumetric flask method
(DONAGEMMA et al., 2011) and its values obtained
for T1, T2, and T3 were 2.90, 2.95, and 2.89 kg dm-3,
respectively. The substrate critical density (Dsc) was determined when the upper and lower limits of LLWR were numerically equal (MOREIRA et al., 2014).
WRC was fitted to the van Genuchten (1980) model, as Equation 4:
θ = θr + {(θs - θr)/[1 + (αΨ)n]m} (4)
Where θr and θs are the volumetric water contents in the
potential of -1,500 kPa and in the saturated condition
(m3 m-3), respectively, and α, m, and n are the model
parameters. These curves were obtained by using the software Soil Water Retention Curve version 3.00, with the restriction m = 1 − 1/n (DOURADO NETO et al., 2001).
Pore size distribution was obtained from WRCs fitted to the van Genuchten (1980) model. The equivalent pore diameter was calculated by the capillary rise equation, as showed in Equation 5:
d = [4σ (cos α)] / (ρgh) (5)
Where d is the equivalent pore diameter (cm), σ is the
surface tension of water at 20 °C (72.75 × 10⁻³ N m-1), α is
the contact angle between the liquid meniscus and the tube wall (assumed to be equal to 0), ρ is the specific weight of water (1 kg dm-3), g is the acceleration of gravity (9.81 m s-2),
By deducing the equation, we have that d = 0.3/h. With this equation and WRCs, we estimated the pore volume with a diameter of less than 0.2 µm (corresponding to the water volume retained in the potential of -1,500 kPa), 10-0.2 µm (difference between the water volume retained in the potential of -30 and -1,500 kPa), 50-10 µm (difference between the water volume retained in the potential of -6 and -30 kPa), and the pore volume larger than 50 µm (difference between the total porosity and the water volume retained in the potential of -6 kPa).
Statistical analyses
The results were submitted to the Shapiro-Wilk test in order to verify the normality of the data and subsequently an analysis of variance was performed. The degrees of freedom of treatments were sliced in two orthogonal contrasts (C1 and C2) and in an additional (CA1), as follows: C1: -(T1) vs (T2+T3); C2: -(T2) vs (T3);
CA1: -(T1) vs (T3). The analyses were performed by using
the software R.
RESULTS AND DISCUSSION
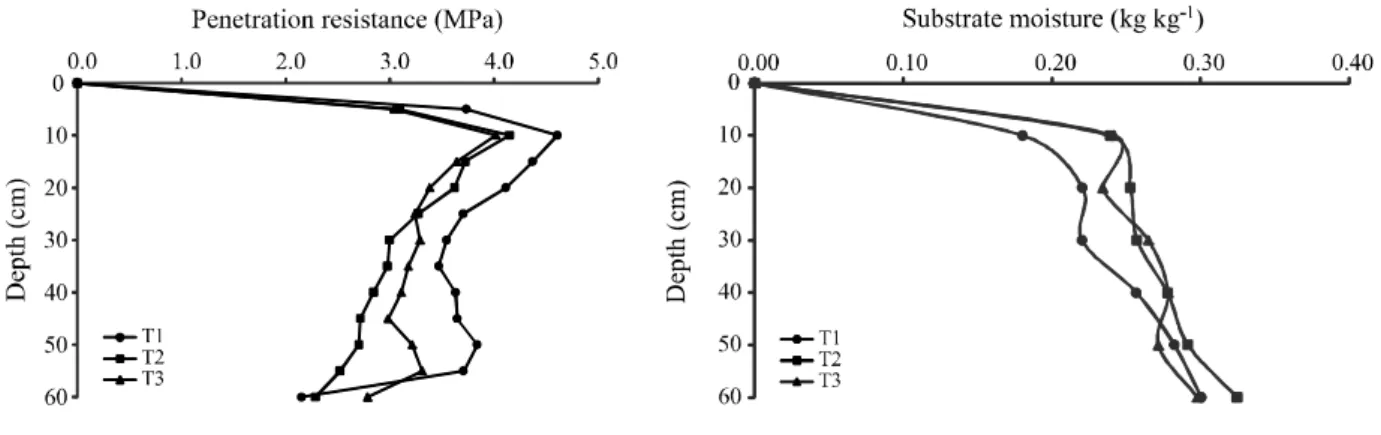
Penetration resistance and moisture in the substrate profile
PR values were higher than 2.0 MPa in all treatments (Figure 1), being classified in the classes high (2 to 4 MPa) and very high (4 to 8 MPa) regarding the impediment to root growth (ARSHAD et al., 1996). In T3, which presented a higher density of arboreal and shrub individuals (REIS, 2006), PR values ranged from 2.2 to 4.9 MPa, with an average of 3.3 MPa, but plants managed to grow even under this impediment condition. These results indicated that fertilization and planting might
have facilitated plant establishment in T2 and especially in T3, even under conditions of high resistance to root penetration.
In agronomic terms, PR values obtained in our study would be highly impeditive to root growth. However, in areas under environmental restoration with non-agricultural and rustic species, even PR values greater than 2.0 MPa may not be detrimental to revegetation success. Despite values higher than 3.0 MPa were observed up to 30 cm depth and, we verified the possibility to revegetate the substrate when fertilization and planting were performed. However, when PR is not a limiting factor, plant cover may be reached more quickly. This shows the need to better define the limiting PR for areas under environmental recovery with rustic species, which may be higher than 2.0 MPa.
Studies on PR values that impede root growth are generally associated with agricultural systems, such as in Beutler and Centurion (2003), Blainski et al. (2008) and Lima et al. (2010), being 2.0 MPa the recommended critical value for an adequate root development for most agricultural crops. However, some studies have demonstrated that plants can show root growth even at values higher than 2.0 MPa (BERTIOLI JÚNIOR et al., 2012; BEUTLER; CENTURION, 2003; CARVALHO et al., 2006; EHLERS et al., 1983; TORMENA et al., 2007).
Treatments showed significant effects on PR only in the deepest layer (55-60 cm), with the highest values obtained in T2 and T3 (Table 1). At this depth, PR was higher in T3 when compared to T2.
In addition to PR, we observed other limiting factors to plant establishment in the plots without fertilization and planting (T1). Because PR was statistically equal in the surface layer of the assessed treatments, the effects of liming and fertilization on the substrate, in addition
Figure 1 - Penetration resistance and moisture in the substrate profile for the three assessed treatments: T1) without planting of seedlings
to planting, may become more important or determinant for revegetation success. Fertilization favored seedling development and, consequently, the establishment of plants from naturally introduced seeds, as shown by Reis (2006). However, the absence of fertilization and planting caused the substrate to continue unfavorable to the establishment of plants from seeds.
Moisture in the substrate profile was influenced by the assessed treatments. Treatments T2 and T3 presented the highest moisture values up to 40 cm depth (Table 1). At greater depths (40-60 cm), the differences were not significant. The substrates of T2 and T3 had the highest values of moisture in the superficial layer, even with a higher herbaceous vegetation cover and density of arboreal and shrub individuals in these plots (REIS, 2006), which increases transpiration. A higher water retention capacity is associated with improvements in physical attributes and organic matter content of the surface layer of substrates in T2 and T3 when compared to T1 (GUIMARÃES et al., 2010), allowing a greater infiltration and storage.
Least limiting water range
A displacement was observed for LLWR to the left from T1 to T3 (Figure 2), which is due to the lowest Ds values found in T3. In ten years of revegetation, the higher biomass production in T3 contributed to improving the physical quality of the substrate.
The increased Ds led to an increase of water volume retained in FC, in accordance with Tormena, Silva, and Libardi (1998). According to these authors, a reduction in macroporosity and a redistribution in pore size are observed as Ds increases, favoring water retention. Under high matrix potentials, the higher water retention occurs at lower Ds values due to the higher pore space resulting from a better soil structural condition (TORMENA; SILVA; LIBARDI, 1998). On the other hand, under low potentials, the effect of Ds on
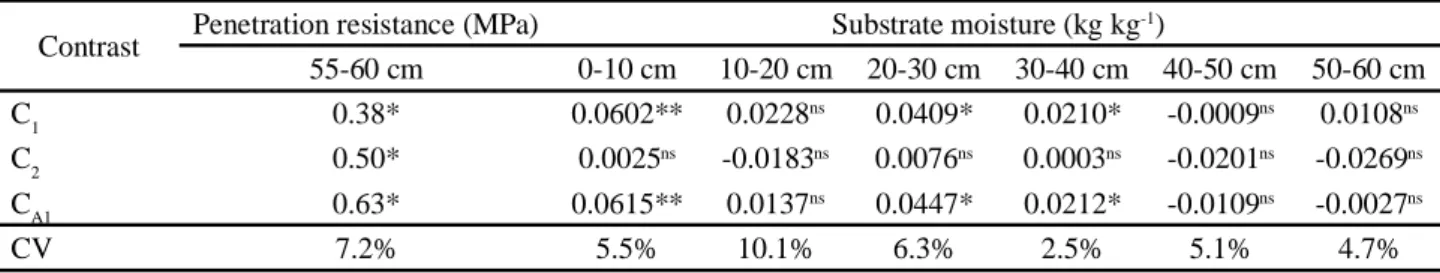
Table 1 - Average contrasts and their significance for values of substrate resistance to penetration and gravimetric moisture up to 60 cm
depth, calculated with the totals of the treatments
* and **: significant at 5 and 1%, respectively, by the F test.ns: not significant. C
1: -(T1) vs (T2+T3); C2: -(T2) vs (T3); CA1: -(T1) vs (T3). Treatments: T1) without planting of seedlings and fertilization; T2) planting of seedlings + lower level of fertilization; T3) planting of seedlings + higher level of fertilization. CV: coefficient of variation
Contrast Penetration resistance (MPa) Substrate moisture (kg kg
-1) 55-60 cm 0-10 cm 10-20 cm 20-30 cm 30-40 cm 40-50 cm 50-60 cm C1 0.38* 0.0602** 0.0228ns 0.0409* 0.0210* -0.0009ns 0.0108ns C2 0.50* 0.0025ns -0.0183ns 0.0076ns 0.0003ns -0.0201ns -0.0269ns CA1 0.63* 0.0615** 0.0137ns 0.0447* 0.0212* -0.0109ns -0.0027ns CV 7.2% 5.5% 10.1% 6.3% 2.5% 5.1% 4.7%
retention is lower since microporosity is little affected by an increase in Ds.
In addition, aeration porosity reduced as Ds increased. On the contrary, the water content in PWP and PR increased as Ds increased. The direct relationship between moisture in PWP and Ds is due to the higher mass of particles with high adsorption surface since compaction does not affect the intra-aggregate microporosity (TORMENA et al., 2007).
The upper limit of LLWR was defined by moisture in FC for the three treatments, suggesting that the substrate does not present limitations of oxygen availability to the roots (Figure 2). The lower limit was defined by moisture in PWP only at lower densities. As Ds increased, PR became more limiting to root system growth when compared to the water volume in PWP.
PR was more limiting when replacing moisture in
PWP in Ds values of 1.21, 1.25, and 1.15 kg dm-3 for T1,
T2, and T3, respectively. Considering, for example, a Ds
value of 1.15 kg dm-3 within LLWR, PR was not yet a
limiting factor to root growth on the substrates of T1 and T2 whereas in treatment T3, for that same Ds value, PR becomes a limiting value.
Dsc presented values of 1.40 kg dm-3 for the T1 and
1.42 kg dm-3 for T2 and T3. The percentage of samples that
presented a Ds value equal to or less than Dsc was 70%, 83%, and 65% for T1, T2, and T3, respectively, which shows a predominance of Ds values lower than Dsc in the three treatments. The occurrence of values of Ds higher than
Dsc indicates a soil physical degradation, making physical
conditions highly restrictive for plant development, regardless of moisture, due to either a reduced aeration or an excessive soil resistance to penetration (BLAINSKI et
al., 2009). The higher the frequency of Ds values higher
than Dsc is, the greater the risks of plants suffering from stresses due to a reduced oxygenation or high PR of soil (CAVALIERI et al., 2006).
The average Ds was 1.30 kg dm-3 for the substrate
in T1 and 1.28 kg dm-3 for T2 and T3. The average
value of Ds in T1 is closer to its respective Dsc when compared to T2 and T3. This indicates that substrate
Figure 2 - Variation of water content with substrate density
at critical levels of field capacity (FC) at -30 kPa, permanent wilting point (PWP) at -1.500 kPa, aeration porosity (AP) of 0.10 m3 m-3, and penetration resistance (PR) of 3.5 MPa. The hatched areas represent the least limiting water range. Treatments: T1) without planting of seedlings and fertilization; T2) planting of seedlings + lower level of fertilization; T3) planting of seedlings + higher level of fertilization. Dsc = substrate critical density
physical conditions in T1 are, in general, more limiting to plant growth, mainly in relation to Ds, PR, and water availability.
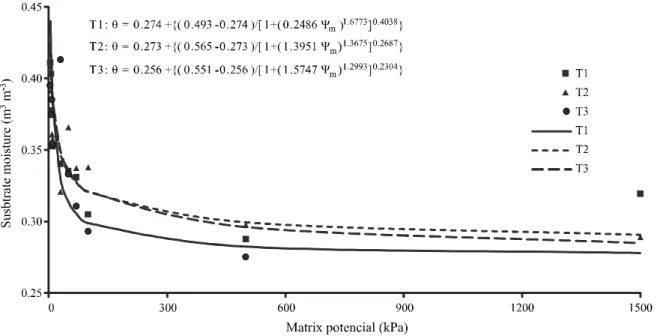
Water retention curve and pore size distribution WRC of the three treatments remained close to -10 kPa (Figure 3). From this point, with a reduction in the matrix potential or increase in the suction, WRC of the substrate for T1 distanced itself from the other WRCs, presenting lower water volumes. This behavior is a result of structural alterations that occurred in the substrates of T2 and T3 after 10 years of revegetation since soil structure influences WCR shape, especially under low suction values (HILLEL, 2004).
Water volume retained at higher matrix potentials depends on capillarity and pore size distribution and hence it is strongly affected by soil structure (HILLEL, 2004). Under the potential of -100 kPa, substrate moisture
of T1 was 0.299 m3 m-3, reaching values of 0.321 m3 m-3
in the substrates of T2 and T3. This suggests a better structuring of substrates in T2 and T3, with an increased water retention capacity at higher potentials.
Under lower values of matric potential, water retention is increasingly dependent on adsorption, being less influenced by structure and more by texture and specific surface of soil particles (HILLEL, 2004). Moisture values of the substrate in the three treatments tended to approach -1,500 kPa, but in T1, it is lower. Under intermediate values, between -100 and -500 kPa, moisture values are significantly lower in the substrate of T1, which may be related to the absence of organic residues and low organic matter contents in the substrate (GUIMARÃES et al., 2010) and, consequently, to the inexistence of aggregate formation.
A predominance of pores with diameters lower than 0.2 µm was observed in the three treatments (Figure 4). These pores are classified as cryptopores, which retain water when matrix potential is below PWP and therefore it remains unavailable to plants (RIBEIRO et al., 2007). These results suggested a restriction in water availability to plants even in the substrate of T3, which did not differ significantly from T1 (Table 2).
Macropore volume (diameter class >50 µm) of the substrate in T1 was significantly lower than the volumes calculated for the substrates of T2 and T3
(Table 2; Contrast C1). The results indicated an aeration
deficiency in the substrate of T1, considering that aeration occurs in the macropores (RIBEIRO et al., 2007) and
that macroporosity (0.076 m3 m-3) was lower than the
critical value adopted for aeration porosity in the LLWR calculation (0.10 m3 m-3).
Figure 3 - Water retention curve of the substrate fitted to the van Genuchten (1980) model for the three assessed treatments: T1) without planting
of seedlings and fertilization; T2) planting of seedlings + lower level of fertilization; T3) planting of seedlings + higher level of fertilization
Contrast Diameter class (μm) >50 50-10 10-0.2 <0.2 >50 50-10 10-0.2 <0.2 --- m3 m-3--- % ---C1 0.0732** -0.0413ns 0.0230ns 0.0101ns 11.31** -9.68ns 3.24ns -4.87ns C2 -0.0221ns 0.0054ns 0.0109ns -0.0082ns -3.30ns 1.22ns 2.22ns -0.15ns CA1 0.0621** -0.0385ns 0.0284ns 0.0060ns 9.66** -9.07ns 4.35ns -4.94ns CV (%) 8.72 43.91 29.86 5.37 9.56 46.24 32.37 5.33
Table 2 - Average contrasts and their significances for pore size distribution (pore volume per substrate volume, m3 m-3) and total porosity (%), calculated with the totals of the treatments
* and **: significant at 5 and 1%, respectively, by the F test.ns: not significant. C
1: -(T1) vs (T2+T3); C2: -(T2) vs (T3); CA1: -(T1) vs (T3). Treatments: T1) without planting of seedlings and fertilization; T2) planting of seedlings + lower level of fertilization; T3) planting of seedlings + higher level of fertilization. CV: coefficient of variation
Figure 4 - Pore size distribution estimated from the water retention curve of the substrate fitted to the van Genuchten (1980)
model for the three assessed treatments: T1) without planting of seedlings and fertilization; T2) planting of seedlings + lower level of fertilization; T3) planting of seedlings + higher level of fertilization. Pt: total porosity
Macropores are found predominantly among aggregates and regulate aeration capacity, gas diffusion, drainage, and hydraulic conductivity of soils (BORGES
et al., 2009; RIBEIRO et al., 2007). Differences in
macroporosity of materials with the same texture and mineralogy are related to differences in structuring. Because the experiment was installed on the same substrate, we can be inferred that the substrates of T2 and T3 have better structuring since they presented a higher macroporosity.
CONCLUSIONS
1. After a decade of environmental recovery, differences in the physical attributes of tailings are due to different revegetation modes. An adequate fertilization management seems to be the most important aspect for the reforestation of deposition tanks of this material; 2. The highest level of fertilization and planting of
seedlings are the best interventions identified so far for revegetation of tailing tanks when compared to the absence of fertilization and planting;
3. The absence of fertilization and planting precludes revegetation even with sources of propagules nearby, considering that the study area is located inside a National Forest.
ACKNOWLEDGEMENTS
To the Mineração Rio do Norte/MRN and FAPEMIG for the financial support. To IBAMA for the authorization to carry out this research. To CAPES for granting the scholarship.
REFERENCES
ALMEIDA, D. S. G. et al. Estudo de beneficiamento químico e físico e caracterização de bauxitas do Pará. Holos, ano 28, v. 5, p. 115-124, 2012.
ALVARES, C. A. et al. Köppen’s climate classification map for Brazil. Meteorologische Zeitschrift, v. 22, n. 6, p. 711-728, 2013.
ARSHAD, M. A. et al. Physical tests for monitoring soil quality. In: DORAN, J. W.; JONES, A. J. Methods for
assessing soil quality. Madison: Soil Science Society of
America, 1996. p. 123-141. (SSSA Special publication 49). BERTIOLI JÚNIOR, E. et al. Intervalo hídrico ótimo e grau de compactação de um latossolo vermelho após 30 anos sob plantio direto. Revista Brasileira de Ciência do Solo, v. 36, n. 3, p. 971-982, 2012.
BEUTLER, A. N.; CENTURION, J. F. Efeito do conteúdo de água e da compactação do solo na produção de soja. Pesquisa
Agropecuária Brasileira, v. 38, n. 7, p. 849-856, 2003.
BEUTLER, A. N.; CENTURION, J. F.; ALVARO, P. S. Comparação de penetrômetros na avaliação da compactação de latossolos. Engenharia Agrícola, v. 27, n. 1, p. 146-151, 2007. BLAINSKI, E. et al. Intervalo hídrico ótimo num Nitossolo Vermelho distroférrico irrigado. Revista Brasileira de Ciência
do Solo, v. 33, p. 273-281, 2009.
BLAINSKI, E. et al. Quantificação da degradação física do solo por meio da curva de resistência do solo à penetração.
Revista Brasileira de Ciência do Solo, v. 32, n. 3, p.
975-983, 2008.
BORGES, T. A. et al. Avaliação de parâmetros fisico-hídricos de Latossolo Vermelho sob pastejo e sob cerrado. Revista
Brasileira de Engenharia Agrícola e Ambiental, v. 13, n. 1,
p. 18-25, 2009.
CAPRONI, A. L. et al. Ocorrência de Fungos Micorrízicos Arbusculares em resíduo da mineração de bauxita revegetado com espécies arbóreas. Acta Botanica Brasilica, v. 21, n. 1, p. 99-106, 2007.
CARVALHO, G. J. et al. Correlação da produtividade do feijão com a resistência à penetração do solo sob plantio direto. Revista Brasileira de Engenharia Agrícola e
Ambiental, v. 10, n. 3, p. 765-771, 2006.
CAVALIERI, K. M. V. et al. Efeitos de sistemas de preparo nas propriedades físicas de um latossolo vermelho distrófico.
Revista Brasileira de Ciência do Solo, v. 33, p. 137-147,
2006.
CUNHA, J. C. et al. Comparação de dispersantes químicos na análise granulométrica de solos do estado de Pernambuco.
Revista Brasileira de Engenharia Agrícola e Ambiental, v.
18, n. 8, p. 783-789, 2014.
DIAS, L. E.; FRANCO, A. A.; CAMPELLO, E. F. C. Fertilidade do solo e seu manejo em áreas degradadas. In: NOVAIS, R. F. et al. Fertilidade do Solo. Viçosa: SBCS, 2007. p. 955-990. DONAGEMMA, G. K. et al. Manual de métodos de análises
de solo. 2. ed. Rio de Janeiro: Embrapa Solos, 2011. 230 p.
DOURADO NETO, D. et al. Soil Water Retention Curve
- SWRC, version 3.00 beta. Piracicaba: Universidade de São
Paulo, 2001.
EHLERS, W. et al. Penetration resistance and root growth of oats in tilled and untilled loess soil. Soil and Tillage Research, v. 3, n. 3, p. 261-275, 1983.
GUIMARÃES, L. A. O. P. et al. Alterações físicas e teor de matéria orgânica em um rejeito da lavagem de bauxita revegetado com diferentes níveis de adubação. In: FERTBIO, 29. 2010, Guarapari. Anais... Guarapari: Sociedade Brasileira de Ciência do Solo, 2010. CD-ROM.
HILLEL, D. Introduction to environmental soil physics. Amsterdam: Elsevier Academic Press, 2004. 494 p.
LEÃO, T. P.; SILVA, A. P. A simplified Excel® algorithm from estimating the least limiting water range of soils. Scientia
Agricola, v. 61, p. 649-654, 2004.
LIMA, C. L. R. et al. Produtividade de culturas e resistência à penetração de Argissolo Vermelho sob diferentes manejos.
Pesquisa Agropecuária Brasileira, v. 45, n. 1, p. 89-98, 2010.
MOREIRA, F. R. et al. Intervalo hídrico ótimo em um latossolo vermelho cultivado em sistema semeadura direta por 25 anos.
Revista Brasileira de Ciência do Solo, v. 38, p. 118-127, 2014.
PINTO, R. L. S. et al. Determinação do ponto de carga zero da bauxita da região nordeste do Pará. Cerâmica, v. 58, p. 465-467, 2012.
REIS, L. L. Monitoramento da recuperação ambiental de
áreas de mineração de bauxita na Floresta Nacional Saracá-Taquera, Porto Trombetas (PA). 2006. 159 f. Tese (Doutorado
em Agronomia) - Universidade Federal Rural do Rio de Janeiro, Seropédica, 2006.
RIBEIRO, K. D. et al. Propriedades físicas do solo, influenciadas pela distribuição de poros, de seis classes de solos da região de Lavras-MG. Ciência e Agrotecnologia, v. 31, n. 4, p. 1167-1175, 2007.
SANTINI, T. C.; FEY, M. V. Assessment of Technosol formation and in situ remediation in capped alkaline tailings.
Catena, v. 136, p. 17-29, 2016.
SANTINI, T. C.; KERR, J. L.; WARREN, L. A. Microbially-driven strategies for bioremediation of bauxite residue.
Journal of Hazardous Materials, v. 293, p. 131-157, 2015.
TORMENA, C. A. et al. Variação temporal do intervalo hídrico ótimo de um Latossolo Vermelho distroférrico sob sistemas de plantio direto. Revista Brasileira de Ciência do
Solo, v. 31, p. 211-219, 2007.
TORMENA, C. A.; SILVA, A. P.; LIBARDI, P. L. Caracterização do intervalo hídrico ótimo de um Latossolo Roxo sob plantio direto. Revista Brasileira de Ciência do Solo, v. 22, p. 573-581, 1998.
VAN GENUCHTEN, M. T. A closed form equation for predicting the hydraulic conductivity of unsaturated soils.
Soil Science Society of America Journal, v. 44, p. 892-898,
1980.
WEHR, J. B.; FULTON, I.; MENZIES, N. W. Revegetation strategies for bauxite refinery residue: a case study of Alcan Gove in Northern Territory, Australia. Environmental Management, v. 37, n. 3, p. 297-306, 2006.
XUE, S. et al. A review of the characterization and revegetation of bauxite residues (Red mud). Environmental
Science and Pollution Research , v. 23, n. 2, p. 1120-1132,
2016.