Maximizing economic returns for large, publicly funded road
infrastructure investments through improved economic,
engineering and construction information management
by
Cordes TOWLES
THESIS PRESENTED TO ÉCOLE DE TECHNOLOGIE SUPÉRIEURE
IN PARTIAL FULFILLEMENT FOR THE DEGREE OF
DOCTOR OF PHILOSOPHY
Ph.D.
MONTREAL, 07 JUNE 2017
ÉCOLE DE TECHNOLOGIE SUPÉRIEURE
UNIVERSITÉ DU QUÉBEC
© Copyright reserved
It is forbidden to reproduce, save or share the content of this document either in whole or in parts. The reader who wishes to print or save this document on any media must first get the permission of the author.
BOARD OF EXAMINERS THESIS PH.D. THIS THESIS HAS BEEN EVALUATED BY THE FOLLOWING BOARD OF EXAMINERS
Mr. Gabriel Assaf, Thesis Supervisor
Department of Construction Engineering at École de technologie supérieure
Mr. Kamal Al-Haddad, President of the Board of Examiners
Department of Electrical Engineering at École de technologie supérieure
Mr. Abel Francis, Member of the jury
Department of Construction Engineering at École de technologie supérieure
Mr. Claude Bruxelle, External Evaluator
Project Director at Centre d’expertise et de recherche en infrastructures urbaines (CERIU)
THIS THESIS WAS PRENSENTED AND DEFENDED
IN THE PRESENCE OF A BOARD OF EXAMINERS AND PUBLIC <DEFENCE DATE OF THE THESIS>
FOREWORD
This thesis came about after working in several developing countries over the better part of a decade and realizing that the economic benefits promised under ex-post project economic analysis were not matching up to ex-ante project economic analysis for roads projects. At first, the work was focused on reducing corruption in construction; however, after further research, it became apparent that the entire project development and implementation process needed to be addressed in order to deliver the promised economic returns ex post. More importantly, it also became apparent that part of the solution is the transfer of needed technological “know how” to developing countries so that local authorities can take ownership of the pavement asset management, including pavement evaluation, the determination of the cause of deterioration, optimal pavement design in technical, economic, and environmental terms and construction process without requiring foreign “experts.”
The intent of this thesis is to present a project development and implementation process for donor agencies to improve the delivery of roads projects in developing countries, while providing higher economic returns.
ACKNOWLEDGMENT
I wish to thank my research director, Mr. Gabriel Assaf, professor in the Department of Construction Engineering at ETS, for encouraging me to pursue the ideas that comprise this thesis; his dedication to improving the state of the art in pavement engineering is inspiring; his constant support throughout the writing of this thesis was invaluable. Thank you.
I wish to thank Mr. Yohannes Abebe, Transport and Vertical Structures Practice Lead at the Millennium Challenge Corporation (MCC), for providing support and encouragement during this entire process, as well as the opportunity to apply many of these research findings into practice. Thank you.
I wish to thank Mr. Adel Francis, professor in the Department of Construction Engineering at ETS, for accepting to be a part of the jury.
I wish to thank Mr. Kamal Al-Haddad, professor in the Department of Electrical Engineering at ETS, for accepting to be a part of the jury.
I wish to thank Mr. Claude Bruxelle, Project Director at CERIU, for accepting to be a part of the jury.
I also wish to thank MCC for the opportunity to work in such a challenging and rewarding field. MCC was created in 2004 with the express objective of reducing poverty through economic growth. The agency strives to apply innovative engineering technologies in MCC-funded projects in partner countries, while addressing environmental and social challenges, and evaluating overall investment performance. Accountability and transparency are central to the MCC model, and it is the author’s hope that this ever-improving standard of foreign aid delivery by MCC not only continues, but serves as a model in international development to help reinforce the importance of accountability, transparency and results in investment decisions.
And finally, I thank my family, notably my wife, Ann Warner, and two children, Jack and Sam, who have endured patiently while I have worked on and finalized this thesis over the last few years.
MAXIMIZING ECONOMIC RETURNS FOR LARGE, PUBLICLY FUNDED ROAD INFRASTRUCTURE INVESTMENTS THROUGH IMPROVED ECONOMIC,
ENGINEERING AND CONSTRUCTION INFORMATION MANAGEMENT Cordes TOWLES
ABSTRACT
The objective of this thesis is to develop a framework to maximize economic returns for large road infrastructure projects in developing countries. The literature has outlined many of the numerous challenges in roads projects in developing countries from corruption, poor quality work, and cost and time overruns. This is confirmed, to various degrees, by recent field experience in developing countries in the delivery of roads projects. Incentives of both the donor agency and the road agency have contributed to this underperformance, with a mix of insufficient accountability for results. Some authors question the economic efficiency of roads investments in developing countries by donor agencies, pointing to some evidence indicating that the ex post economic returns are not matching up to the ex-ante economic returns promised, to the extent an economic analysis was performed.
The framework developed under this thesis attempts to align the incentives of the donor agency and road agency, while providing a higher degree of transparency and accountability into the investment decision making process, but also the engineering design and construction phase with a focus on the longer term sustainability of the road investment through increased adaption of modern pavement asset management techniques, graphical capabilities, engineering diagnosis, and statistical analysis.
The first part of the framework is the development of a fast-track road network assessment tool in MS Excel, using the HDM-4 approach to rapidly identify the most economically lucrative investments in a country to consider for further investment. This approach also allows the donor agency to validate the ability of the road agency to properly assess two prime elements of the pavement asset management system: the International Roughness Index (IRI) and Average Annual Daily Traffic (AADT); this is an important confirmation of the road agencies’ ability to properly maintain the pavement asset post investment.
The second part of this framework is the development of a graphic-based itinerary diagram approach to identify the cause(s) of deterioration and develop appropriate engineering solutions that minimize investment costs while maximizing economic returns. This framework is also built around the HDM-4 model to show the primary engineering elements driving the economic assessment, which provide the needed justification of the economic models, but also serve as a project implementation monitoring and evaluation tool that can be used at the end of the project to determine the ex post economic analysis.
The third and final part of the framework is the development of a Bayesian approach in coordination with the itinerary diagram approach to help road agencies determine the most probable cause(s) of deterioration on their road network. This will improve overall pavement design through empirical methods, but also improve the economic prioritization of the road network.
The Bayesian method is meant to improve the accuracy of the pavement management system through adaptive learning. Through the identification of the cause of deterioration on similar road families, the pavement management system will be able to forecast the most likely cause(s) of deterioration on similar roads families, which allows the road agency the ability to intervene through a more timely and economically efficient manner through the reduction of vehicle and road agency costs.
The objective of this part is to begin the development of the needed pavement design “know how” at the road agency to improve overall long-term sustainability of the road investments, which can improve long-term economic returns.
The primary recommendations of the thesis are to continue the refinement of each of these three parts, which have already been field-tested to various degrees, to optimize each element for further use and deployment.
Keywords: road, pavement, distress, cause, diagnosis, deterioration, test, economic, financial, funding, corruption, HDM-4, developing countries, maintenance, rehabilitation, materials, soil mechanics.
MAXIMISER LES RENDEMENTS ÉCONOMIQUES POUR LES GRANDS INVESTISSEMENTS D'INFRASTRUCTURES ROUTIÈRES À FINANCEMENT
PUBLIC À TRAVERS UNE MEILLEURE GESTION DE L’INFORMATION ÉCONOMIQUE, DE L'INGÉNIERIE ET DE LA CONSTRUCTION
Cordes TOWLES
RÉSUMÉ
L'objectif de cette thèse est d'élaborer un cadre pour maximiser la rentabilité économique des grands projets d'infrastructure routière dans les pays en développement. La littérature décrit bon nombre de défis dans les projets routiers dans les pays en développement allant de la corruption, à la qualité de la conception et de la mise en œuvre, aux dépassements des coûts et du temps. Ceci est confirmé, à des degrés divers, par l'expérience récente sur le terrain dans les pays en développement dans la réalisation de projets routiers d’envergure. Le manque d’incitatifs de la part des donateurs et des bailleurs de fonds ainsi que des administrations routières ont contribué à cette sous-performance, de concert avec le mélange d'imputabilité pour des résultats. Ces éléments ont donné lieu à plusieurs travaux qui réduisent significativement, voire remettent entièrement en question la rentabilité économique des investissements routiers dans les pays en développement par les organismes donateurs ou prêteurs avec les éléments de preuve montrant que les rendements économiques ex post ne correspondent pas aux rendements économiques ex ante promis, dans la mesure où une analyse économique était effectuée.
Le cadre de référence développé dans cette thèse tente d'aligner les incitatifs de l'agence prêteuse ou donatrice aux incitatifs de l'administration routière, tout en assurant une plus grande transparence et une responsabilisation à rendre des comptes allant du processus décisionnel d’approbation d’un investissement de l’agence prêteuse ou donatrice, qui se doit a priori d’être rentable, aux phases de conception et de construction effectués sous l’égide de l’administration routière et qui visent à optimiser les coûts et les délais pour un niveau de qualité donné. Le cadre de référence traite ensuite de la durabilité de l'investissement routier grâce à une adaptation accrue des techniques modernes de gestion des actifs de chaussée, des capacités graphiques, du diagnostic technique de la cause détérioration et de l'analyse statistique de plusieurs variables simultanément.
La première partie du cadre de référence développé dans cette thèse porte sur le développement d'un outil d'évaluation rapide du réseau routier dans MS Excel en utilisant les résultats de centaines de simulations à l’aide du logiciel HDM-4 développé sous l’égide de la Banque Mondiale, afin d’identifier rapidement les investissements les plus économiquement lucratifs dans un pays où de nouveaux investissements sont envisagés.
Cette approche permet également aux bailleurs du fonds de valider la capacité de l'administration routière à évaluer correctement deux éléments principaux du système de gestion des actifs de chaussée, l'indice international de rugosité (IRI) et le trafic journalier
moyen sur une base annuelle (TJMA); Il s'agit d'une confirmation importante de la capacité des administrations routières à maintenir correctement la valeur de l'investissement afin que tous les bénéfices envisagés puissent se réaliser.
La deuxième partie de ce cadre est le développement d'une approche graphique basée sur le concept des schémas itinéraires pour d’abord compiler sur une même plateforme toutes les données pertinentes afin de faciliter l’identification de la ou des causes de la détérioration et conséquemment développer des solutions d'ingénierie appropriées qui minimisent les coûts d'investissement tout en maximisant la rentabilité économique. Ce cadre est également construit autour du modèle HDM-4 pour faire ressortir les principales données d'ingénierie qui déterminent l'évaluation économique, mais aussi servir d'outil de suivi et d'évaluation de la mise en œuvre du projet qui peut être utilisé à la fin du projet pour réaliser une analyse économique ex post.
La troisième et dernière partie du cadre de référence est le développement d'une approche bayésienne en coordination avec les schémas itinéraires pour aider les administrations routières à déterminer la ou les causes de détérioration la plus probable sur leur réseau routier afin d'optimiser le choix des interventions.
La méthode bayésienne a pour but d'améliorer la précision du volet diagnostic du système de gestion des chaussées par l'apprentissage adaptatif; En identifiant la cause de la détérioration sur des familles de routes similaires, le système de gestion des chaussées pourra prévoir la ou les causes de détérioration les plus probables sur des familles de routes similaires, ce qui permet à l'administration routière d'intervenir plus rapidement, réduisant les coûts d’exploitation des véhicules et les coûts d’entretien des agences routières.
L'objectif de cette partie est d’initier le développement d’un mécanisme d’apprentissage du savoir-faire en matière de conception/comportement des chaussées au sein de chaque administration routière pour améliorer la viabilité globale à long terme des investissements routiers, et par ricochet de leur rentabilité.
Les principales recommandations de la thèse sont de poursuivre le raffinement de chacune de ces trois parties, qui ont déjà été testées sur le terrain à divers degrés, afin d'optimiser chaque élément pour une utilisation et un déploiement plus généralisés.
Mots-clés: route, chaussée, cause, diagnostic, détérioration, test, économique, financier, financement, corruption, HDM-4, pays en développement, entretien, réhabilitation, matériaux, mécanique des sols
TABLE OF CONTENTS
Page
INTRODUCTION ...1
CHAPTER 1 LITERATURE REVIEW, JUSTIFICATION AND SCOPE OF RESEARCH ...7
Literature review ...7
1.1.1 The promise of economic returns from infrastructure investment ... 7
1.1.2 Economic returns for infrastructure investments in developing countries are not promising ... 9
1.1.3.1 Poor understanding/practice of pavement asset management fundamentals ... 12
1.1.3.2 Political decision making and limited investment transparency and accountability ... 17
1.1.4 Misaligned incentives ... 20
1.1.5 Isomorphic mimicry and premature loading ... 22
1.1.6 Corruption eats away at economic benefits ... 24
Justification and scope of research ...32
1.2.1 Part I – Fast-track network level analysis ... 33
1.2.2 Part II - Technical optimization ... 34
1.2.3 Part III – Graphical data representation dashboard ... 44
CHAPTER 2 RESEARCH OBJECTIVES AND METHODOLOGY ...53
Research objectives ...53
Research methodology ...53
2.2.1 Network level prioritization model ... 53
2.2.2 Project level design technical optimization ... 54
2.2.3 bayesian model to determine the most likely cause of deterioration ... 55
CHAPTER 3 FAST TRACK NETWORK LEVEL PRIORITIZATION MODEL ...57
Vehicle operating costs ...58
IRI ...65
3.2.1 Annual IRI deterioration ... 65
3.2.2 Collection of IRI data ... 70
Capital and maintenance costs ...72
Traffic ...74
3.4.1 Annual traffic growth rate ... 74
3.4.2 Annual average daily traffic (AADT) ... 74
CHAPTER 4 USING ITINERARY DIAGRAMS AND STATISTICAL ANALYSIS TO DETERMINE THE CAUSE OF DETERIORATION TO
PROVIDE AN OPTIMAL ENGINEERING DESIGN SOLUTION ...83
Data management, analysis and the concept of itinerary diagrams ...84
Pavement engineering fundamentals for the itinerary diagrams ...91
Data needs for the itinerary diagrams ...92
4.3.1 Traffic volume and loading levels assessment ... 93
4.3.2 Structural assessment ... 94
4.3.3 Road condition assessment ... 97
4.3.4 Road widening needs assessment ... 100
4.3.5 High-resolution imagery ... 102
4.3.6 Integration of environmental and resettlement aspects ... 104
Determining the causes of deterioration ...104
4.4.1 type i: structural deterioration (traffic based) ... 104
4.4.2 Type II: Materials deterioration (water and environment) ... 105
4.4.3 Type III: Thermal deterioration (water, temperature and fines) ... 106
4.4.4 Type IV: Mix design and placement deterioration (bitumen and aggregates) ... 107
Identification of the most likely causes of deterioration through Bayesian modeling ...109
CHAPTER 5 VALIDATION OF THE ITINERARY DIAGRAMS CONCEPT IN DETERMINING THE CAUSE OF DETERIORATION...115
Use of the itinerary diagram to determine the cause of deterioration post construction ...115
Use of the itinerary diagram to determine the cause of deterioration during project assessment ...120
CONCLUSIONS AND RECOMMENDATIONS ...123
ANNEX I MS EXCEL PROGRAM ...125
ANNEX II ANNEX II : BAYESIAN MATIX ……….126
LIST OF TABLES
Page
Table 1.1 Symptoms of corruption in the transport sector at the network and project level ...28
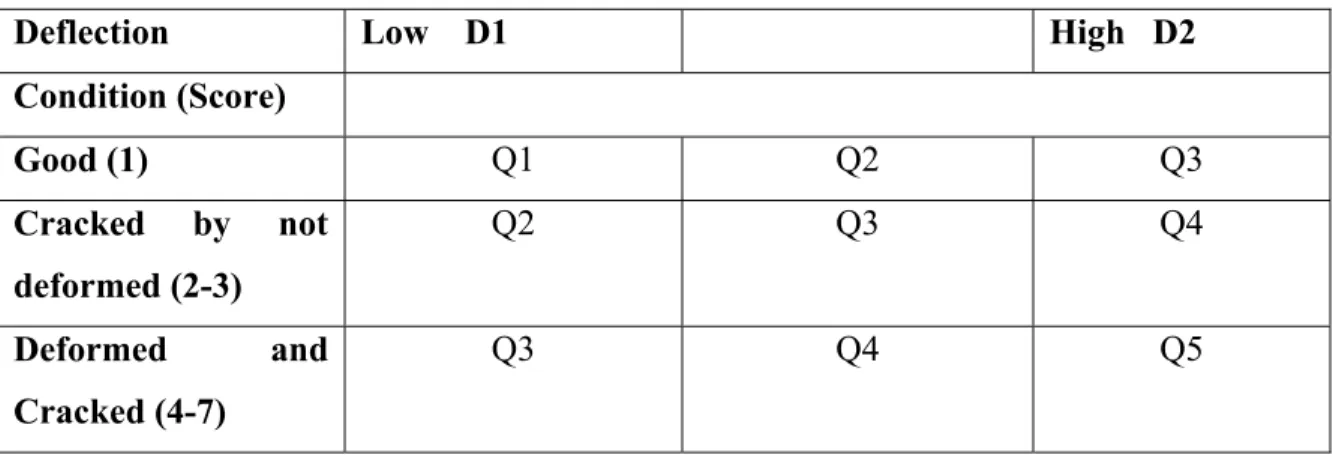
Table 2.2 Deflection assessment matrix ...37
Table 2.3 Composite score for cracking and distorsions matrix and condition assessment Adapted from Autret et al. (1985)...37
Table 2.4 Final composite score calculation ...38
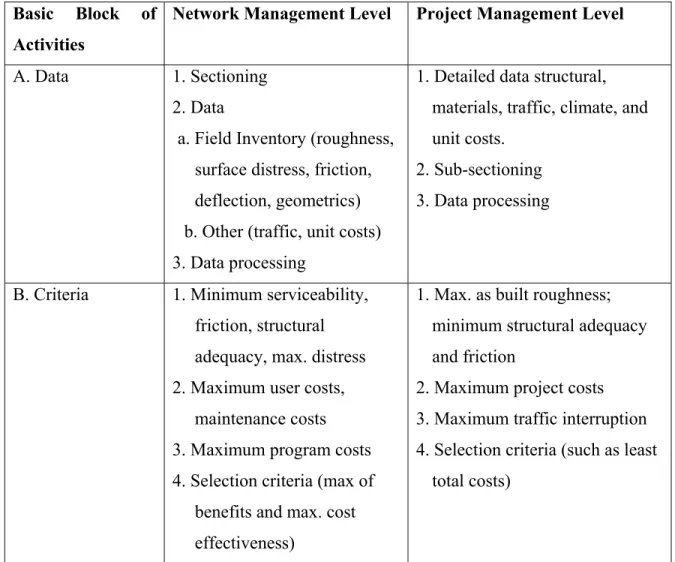
Table 2.5 Summary of activities and decisions within a PMS ...41
Table 3.1 Components of vehicle operating costs and relative contributions, ...58
Table 3.2 Average of 44 World Bank HDM-4 studies for developing ...59
Table 3.3 World Bank’s 44 country average 2015 US$ inflation adjusted ...61
Table 3.4 Average VOCs for automobiles and trucks for 44 ...63
Table 3.5 IRI pre work and post work results from LTPP Analysis ...69
Table 3.6 Summary table of annual estimated IRI linear deterioration rates ...70
Table 3.7 Maintenance costs for two lane roads in 2015 US$ (CPI) ...73
Table 3.8 World Bank road works costs per km in 2015 US$ (CPI) ...74
Table 3.9 Comparative ERR results between HDM-4 and the proposed model ...76
Table 3.10 HDM-4 adopted pavement layer coefficients the surface layer ...78
Table 4.1 Total number of tests performed on a road project in SSA ...87
Table 4.2 South African suggested values for the relative damage exponent ...94
Table 4.3 CGRA Identification of the permitted deflections for 8 ton loadings ...95
Table 4.4 CGRA determination of the “k” value ...96
Table 4.5 Cracking distress and measurement between LTPP and HDM-4 ...99
Table 4.6 Passenger Car Space Equivalents (PCSE) by road type ...101
Table 4.8 Basic Bayesian probabilities (p) matrix for 18 distresses (S) ...111 Table 4.9 Sample matrix of probabilities for 18 distresses and the 27 causes of deterioration for a sample road family ...112 Table 5.1 Average (8t) ESAL for each truck class in select SSA country ...120
LIST OF FIGURES
Page
Figure 0.1 Summary of results for public infrastructure spending in Canada ...1
Figure 0.2 Long run Impact on Real GDP by Industry ...2
Figure 0.3 Cost of infrastructure catch-up in SSA as a percent of GD ...3
Figure 1.1 Infrastructure Investment as a share of GDP ...8
Figure 1.2 Estimated Infrastructure Investments ...9
Figure 1.3 Factors affecting the efficient use of infrastructure investments ...11
Figure 1.4 Information and decision support system ...12
Figure 1.5 Indicative time scale to embed a Pavement Management System ...13
Figure 1.6 Sub-Saharan Africa road network class and condition ...14
Figure 1.7 Maintenance and rehabilitation spending relative to “norms” ...15
Figure 1.8 Causes of corruption ...24
Figure 1.9 Percentage of reported bribery and corruption by industry ...25
Figure 1.10 Corruption Perception Index 2015 ...26
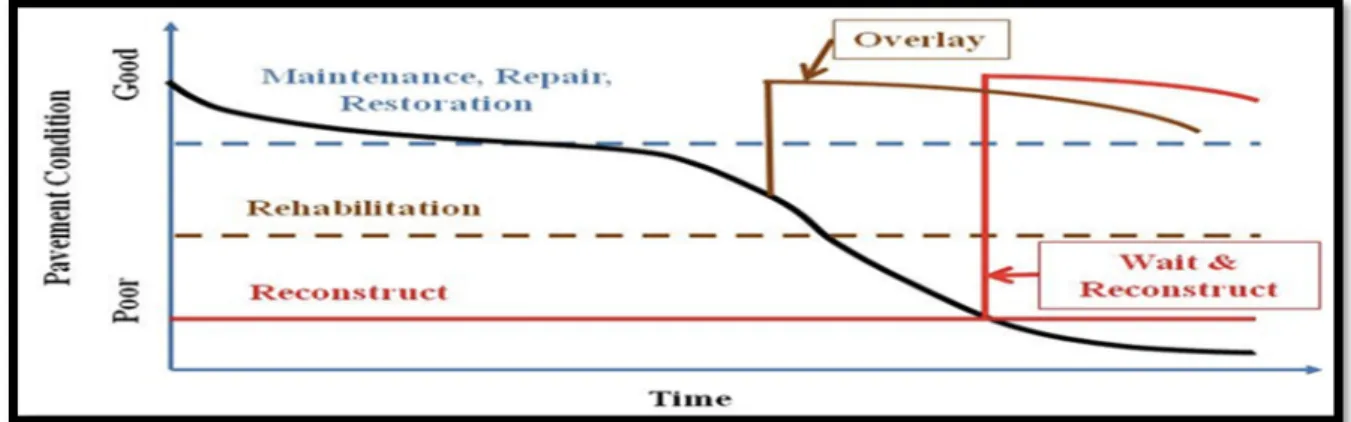
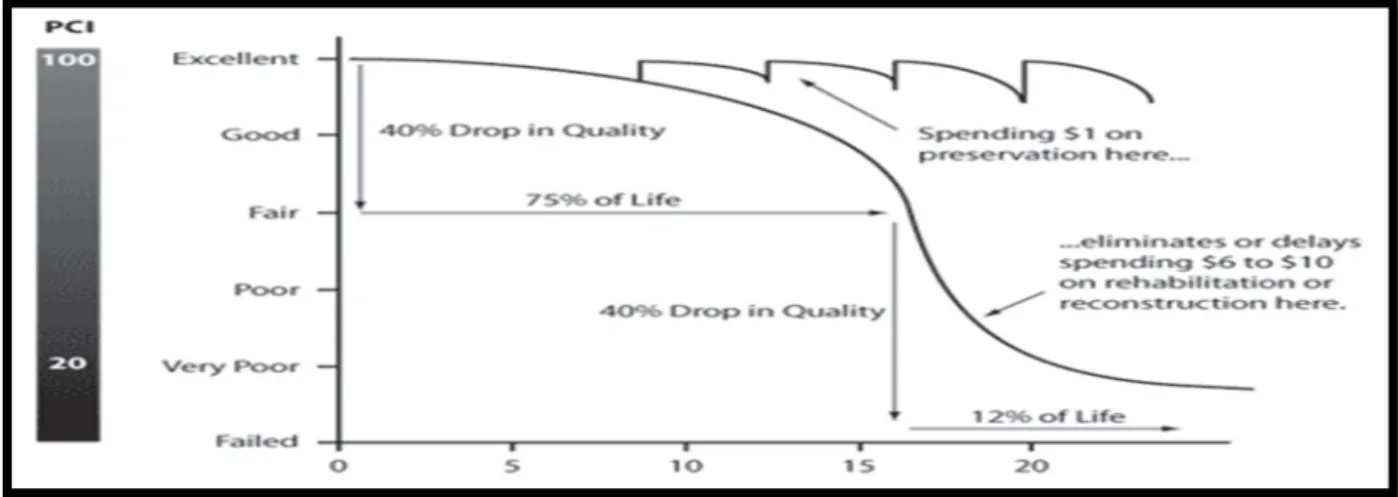
Figure 1.11 Pavement deterioration curve with levels of intervention ...35
Figure 1.12 Pavement Option Curve ...43
Figure 1.13 Sample itinerary diagram (strip map representation) from South Africa ...45
Figure 1.14 Indicative pavement family classification approach ...46
Figure 1.15 Dynamic Sectioning versus fixed sectioning approach, ...47
Figure 1.16 Implications of homogenous sectioning ...47
Figure 1.17 Graphical Representation of the Jenks Optimization ...48
Figure 1.19 Comparison between observed and non-calibrated HDM RUE models ...50
Figure 3.1 Developing countries VOC (US$/km) ...60
Figure 3.3 Average VOC for automobiles and trucks in 44 developing ...64
Figure 3.4 HDM-4 factors determining overall roughness ...66
Figure 3.5 Roughness Progression for a low traffic (YE4) ...67
Figure 3.6 Roughness Progression for a high traffic (YE4) ...67
Figure 3.7 Comparison of the age/roughness relationship ...68
Figure 3.8 IRI (m/km) as a function of pavement age ...69
Figure 3.9 Homogenous sectioning for IRI through mean analysis ...71
Figure 3.10 Comparison of 32 HDM-4 runs with the proposed MS Excel model ...77
Figure 3.11 Effect of Modified Pavement Mixes (lower, purple line) al Pavement ...79
Figure 3.12 Fatigue resistance of bitumen at two frequencies as a ratio ...80
Figure 4.1 Sample itinerary diagram output showing all engineering ...86
Figure 4.2 Characteristic Deflections for the Asphalt Concrete and Base course layers ....88
Figure 4.3 Example Itinerary Diagrams for a recent road project in Africa showing ...89
Figure 4.4 Interaction of the pavement structure with climate and loading, ...92
Figure 4.5 Permitted deflection characteristic deflection and deflection measurements ...97
Figure 4.6 HDM Speed-Volume Model ...100
Figure 4.7 Aerial imagery showing hydraulic flow directions ...103
Figure 5.1 Thickness measurements for selected road project in SSA ...116
Figure 5.2 Deflection measurements for selected road project in SSA ...117
Figure 5.3 Creep tests for selected road project in SSA ...117
Figure 5.4 Marshall Stability tests results for selected road project in SSA ...118
Figure 5.5 Binder dosage results for selected road project in SSA ...119
LIST OF ABREVIATIONS AADT Average Annual Daily Traffic
AASHTO American Association of State Highway and Transportation Officials
AC Asphalt Concrete
AM Asphaltic Mix (per HDM-4) ADB Asian Development Bank AfDB African Development Bank DCP Dynamic Cone Penetrometer ERR Economic Rate of Return ESAL Equivalent Single Axle Load
CAD Canadian Dollars
CEBTP Centre Expérimental de Recherches et d’Études du Bâtiments et des Travaux Publics
CGRA Canadian Good Roads Association
CPI Consumer Price Index
EU European Union
FIDIC Fédération Internationale des Ingénieurs Conseils FHWA US Federal Highway Administration
GAO Government Accountability Office GDP Gross Domestic Product
HDM III Highway Development Model, 3rd version
HDM-4 Highway Development Model, 4th version
IID Inspection in Depth
IMF International Monetary Fund IRI International Roughness Index LEF Load Equivalency Factor
LTPP Long Term Pavement Performance Program MEPDG Mechanical-Empirical Design Guide
PCI Pavement Condition Index
PCSE Passenger Car Space Equivalent PDIA Problem Driven Iterative Adaptation
PIARC Permanent International Association Road Congresses PMS Pavement Management System
PSI Present Serviceability Index QA/QC Quality Assurance/Quality Control MCA Millennium Challenge Account MCC Millennium Challenge Corporation MDG Millennium Development Goals
MEPDG Mechanistic Empirical Pavement Design Guide M&R Maintenance and Rehabilitation
NET Net Aid Transfers
NPV Net Present Value
NLPPP Network Level Project Prioritization Phase ODA Overseas Development Assistance
RWE Road Works Effects SNP Adjusted Structural Number SSA Sub-Saharan Africa
SSATP Sub-Saharan African Transport Program ST Surface Treatment (per HDM-4)
USD United States Dollars
WB World Bank
WP Working Paper
INTRODUCTION
Road infrastructure is paramount to economic development; the movement of goods and people are a fundamental component of economic growth, with return on investments demonstrating positive returns (Wilson, 2013, Somerville, 2015). Figure 0.1 below shows a recent Canadian economic finding of positive investment returns on GDP and job growth, with varying positive returns to the private sector.
Discount Rate at:
3% 5% 7% GDP per $ of Spending
ROI based on Zero Benefits for Private Sector 1.10 1.10 1.12 ROI based on Half Benefits for Private Sector 2.46 2.28 2.13 ROI based on Full Benefits for Private Sector 3.83 3.46 3.14 Jobs per $ Million of Spending
ROI based on Zero Benefits for Private Sector 3.0 3.6 4.1 ROI based on Half Benefits for Private Sector 5.0 5.4 5.6 ROI based on Full Benefits for Private Sector 7.1 7.1 7.1 Figure 0.1 Summary of results for public infrastructure spending in Canada in USD$ Taken from Somerville (2015)
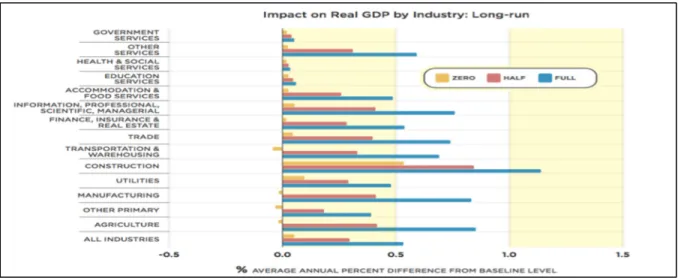
The estimated long run effects on GDP by industry are shown in figure 0.2 below, which are positive.
Figure 0.2 Long run Impact on Real GDP by Industry in Percentage (%) Taken from Somerville (2015)
The primary driver of these investment returns is the multiplier effect generated from the infrastructure investments. Construction spending creates demand for raw materials, labor, supplies, fuel, manufacturing, etc., which in turn has a positive effect on the economy through increased successive spending of the same dollar (the Keynesian multiplier effect). Investment multipliers have been estimated to be around 1 to 3 for the short term and 3 to 7 at least six to eight years out (Wilson, 2013).
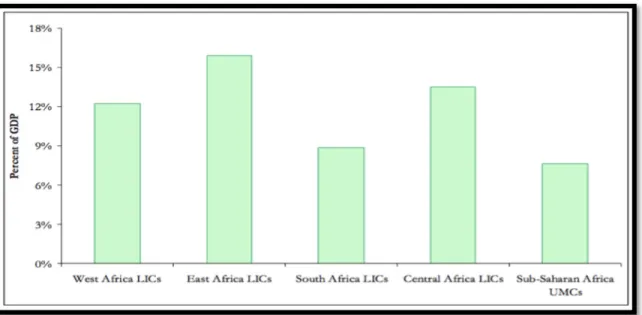
The need for road infrastructure in developing countries is large. The World Bank (Calderon and Serven, 2008) estimated the roads infrastructure investments needs for halving the gap in terms of roads quantity in Sub Saharan Africa (SSA) with other comparable countries outside of Africa as a percentage of GDP of over 6%, as shown in figure 0.3 below.
Figure 0.3 Cost of infrastructure catch-up in SSA as a percent of GDP Taken from Calderon and Serven (2008)
Improving economic growth in poor countries through infrastructure investments is not just an investment in these countries’ economic growth, but also an investment in the expanded opportunities of the people that live there. However, recent literature, which does not review MCC investments (Warner, 2014), suggests that large, publicly funded international road infrastructure investments do not appear to have delivered these types of results; rather, literature suggests that infrastructure investments ex ante socio-economic benefits fail to live up to the ex post socio-economic benefits due to misaligned incentives of key project stakeholders, coupled with poor data, non-existent design optimization and careless project-biased economic analysis. The question that arises is: what explains the infrastructure investment performance gap in developing countries relative to findings in developed countries?
The main objective of this research is to document, analyze, and provide a solution to reduce these shortcomings to deliver the benefits of infrastructure investments in developing countries.
The solution developed and validated for the roads sector and logically applicable to other civil infrastructure projects is three-fold. Part I of this thesis provides a road investment economic framework encompassing the entire or most of the road network, to select, in fast-track mode, the potentially most cost-effective candidate sections for further project-level assessment. Part I rapidly generates the needed potential high-investment return for donor agencies from which to select suitable investments with high economic returns.
Part II of this thesis addresses the project development and implementation cycle for the most cost-effective candidate sections, selected in Part I. Part II is focused on optimizing investment costs through the identification of the cause of deterioration for failed pavements in order to select the appropriate maintenance and rehabilitation (M&R) options that will deliver their expected performance at the lowest investment costs. This identification provides a technically sound and optimal engineering solution, as current efforts presently disregard the cause of failure. This is provided in an implementation performance monitoring graphic framework, or itinerary diagram that will simultaneously: 1) streamline donor agency oversight during construction to focus on the core engineering and economic drivers behind the investment; 2) develop the local road agency pavement management system in the collection of the key empirical based pavement design and management metrics to build local engineering know how; and 3) serve as the basis for the post project HDM-4 economic analysis and assumptions to improve donor transparency and accountability, including realistic assessments of maintenance and rehabilitation strategies based on the constructed product. These solutions have been introduced at MCC given the agency’s goal to maximize economic returns on its investments, while improving overall quality, accountability and transparency.
Part III of this thesis is focused on developing a Bayesian statistical model that can be integrated into the itinerary diagrams and/or pavement management system to determine the most probable cause of deterioration; this model is meant to be a learning model that integrates other findings from across the network for similar families to help improve the pavement design process in developing countries.
The three parts as a whole were designed in line with each party’s (donor and recipient) incentives in mind, while focusing on delivering higher ex post economic benefits for road projects in developing countries.
The thesis is organized as described below.
Chapter 1 provides a focused literature review analyzing major critiques of, limitations to and challenges of development assistance in road infrastructure, while delimitating the research scope. The literature review findings are meant to illustrate the entire whole of development assistance, rather than focusing on any one particular agency.
Chapter 2 formulates the objectives, defines the constraints, and establishes the methodology of this research.
Chapter 3 includes the essence of Part I, namely the road investment economic framework, encompassing the entire road network to select, in fast-track mode, the potentially most cost-effective candidate sections for further project level assessment. This chapter concludes with a validation of the system, wherein an MS Excel sheet is developed and tested on network level data from a sub-Saharan African country to select some 350 km of candidate sections with potential for higher investment returns to match an envelope of approximately one hundred million dollars. This innovative approach has been developed in this thesis to help identify more cost-effective road candidate sections for further study, which is consistent with the need to focus on economic evaluation throughout the project lifecycle.
Chapter 4 includes Part II and III by providing a graphical performance management dashboard, or itinerary diagrams, which are intended to help identify the cause of deterioration to deliver the most economically efficient engineering design to maximize economic benefits and also monitor and evaluate construction and post construction activities. This performance management framework is another innovation of this thesis that aims to set a new standard in overall economic evaluation of foreign aid investments to improve transparency and overall
quality of these investments. A framework for developing a Bayesian statistical model is presented to complement the itinerary diagrams in the identification of the most probable cause(s) of deterioration as determined from other families of roads on the network, with the objective of improving pavement engineering design techniques in developing countries using an empirical approach.
Chapter 5 shows, using data collected in sub-Saharan Africa, how the concept of a graphical performance management dashboard proposed in Part III is useful to: 1) to determine the cause of any distress that would develop post-construction, and how this platform may be used in conjunction with Part II, and 2) determine the most proximate cause of deterioration during a project assessment phase to begin the design optimization process.
Chapter 6 concludes with a summary of the applicability, usefulness, and promises of these tools with reference to increasing the socio-economic benefits of large road investments, and provides a set of recommendations for future work.
CHAPTER 1
LITERATURE REVIEW, JUSTIFICATION AND SCOPE OF RESEARCH Literature review
1.1.1 The promise of economic returns from infrastructure investment
Maximizing economic returns for road investments through improved economic, engineering, and construction information management requires a two-fold description of the problem. This chapter summarizes the literature on the technical and political economy considerations that need to be taken into account to understand the dynamics of road investments in a country-development context.
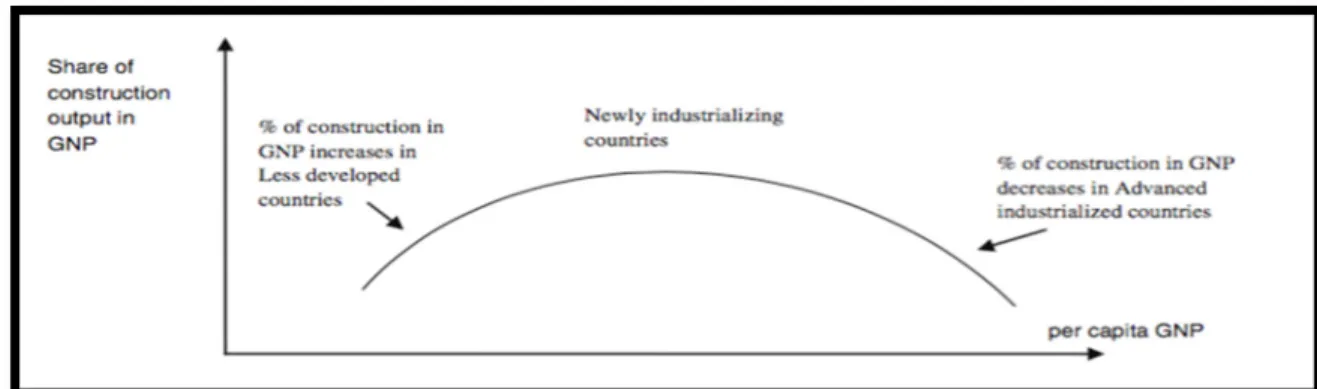
Since Roosevelt’s New Deal, research has established that economic infrastructure such as roads, electricity and water/sanitation, is strongly interconnected with economic growth through activities such as higher employment, better health outcomes (Calderon, 2009, Bhattacharya et al, 2012, Leduc and Wilson, 2013, Inderst and Stewart, 2014), improvement in capital formation, material demand and fabrication, and other supporting services. (Dang and Sui Pheng, 2015).The role of infrastructure construction to the economy has been shown to increase as a country develops, as measured by GNP, but decline in relative terms as the country becomes mature; this is often referred to as the “Bon Curve” as shown in figure 1.1 below.
Figure1.1 Bon Curve for Infrastructure Development Taken from Dang and Sui Pheng (2015)
It is estimated that 3.8% of world GDP has been spent on economic infrastructure, with annual spending trending down in advanced economies (3.6 to 2.8% from 1980 to 2008) and increasing in developing economies (3.5 to 5.7%) as shown in figure 1.2 below.
Figure 1.2 Infrastructure Investment as a percentage share of GDP in Emerging and Developing Economies from 1980 to 2008
Taken from McKinsey (2010)
The estimated infrastructure growth trend in developing economies is 4% of global GDP per annum, or about $3 trillion, until 2030 (Inderst, 2016). Extrapolating from figure 1.3 below, the transport sector will account for between $300 to $600 billion dollars per annum globally with the overwhelming majority going to construction, mostly in East Asia in absolute terms,
but relative to its GDP, sub-Saharan Africa will have a substantial share (Inderst and Stewart, 2014). The World Economic Forum, however, estimates that there will be a $1 trillion shortfall in meeting the estimated demand, or about 33% (World Economic Forum, 2014). The most efficient manner of obviating, or at least reducing, this financing shortfall is through increased infrastructure productivity gains, or optimized infrastructure investments.
Figure 1.3 Estimated Infrastructure Investments
in Developing Countries over the next decade by region, sector and phase Taken from Bhattacharya et al. (2012)
The situation in sub-Saharan Africa is even more dire, given the low level of overall development. The World Bank estimates that if all African countries were able to match the infrastructure stock and quality of Mauritius (the leader in the African group), their rate of economic growth would be higher by an average of 2.2% a year (Calderon, 2009), which could on average double a countries GDP in approximately 30 years alone.
1.1.2 Economic returns for infrastructure investments in developing countries are
not promising
The question is how to invest when the published evidence to date suggests that ex post investment returns in foreign assistance countries are lower than ex ante investment returns (Yasin, 2003, Rajan and Subramanian, 2005, Easterly, 2007, Roodman, 2007, Deaton, 2013,
Easterly, 2014, Warner, 2014). One study has reviewed 106 papers with over 1,217 estimates of growth based foreign assistance1and found “aid is positive but of no economic
significance…with decades of research suggesting that aggregate development aid flows are ineffective at generating growth.” (Doucouliagos and Paldam, 2010). The lesson to draw from this is that foreign aid requires a stringent economic evaluation framework within which projects are developed and implemented to help ensure economic impact.
One of the interesting metrics presented is related to Overseas Development Assistance (ODA) and its effect on growth ; the Nobel economist Angus Deaton has noted that countries like China, India and South Africa have prospered with a tenth of the amount of ODA as a percentage of national income, relative to 36 SSA countries with at least 10% or more, with some of these countries’ budgets made up of up to 75% of ODA (Deaton, 2013). In other words, countries that received less development assistance seem to have done better than those that have received more development assistance.
Considering an estimated $4.6 trillion have been spent to date (Easterly and Williamson, 2011) on overseas development assistance with an estimated 36 to 40% of it devoted to technical assistance mostly provided by expatriates (Riddell, 2008), there is an urgent need to improve performance efficiency if one is to meet the challenge of funding more infrastructure going forward to promote economic growth while truly transferring technical assistance and know-how to these countries.
1.1.3 The primary problems and challenges behind poor economic returns to road
infrastructure investment in developing countries
Looking forward, the challenge for the international development community is improving efficiency to deliver higher economic returns on these investments while making sure that projects put in place the needed environmental and social safeguards. Achieving optimal
outcomes requires a value engineering approach to optimize designs, maximize the use of readily available materials through recycling, and ensure requisite quality standards are met with the use of a simple graphical platform.
Figure 1.4 below outlines the major factors encountered in infrastructure projects from an extensive literature review of developing countries in two distinct phases: the planning stage and the implementation phase.
Figure 1.4 Factors affecting the efficient use of infrastructure investments Taken from Dang and Sui Pheng (2015)
The planning phase mentioned by Dang and Sui (2015) in figure 1.4 above has several primary problems that will be discussed below, notably 1) a poor understanding of pavement asset management planning (inadequate capacity for estimation of rates of return for infrastructure projects and institutional weakness); and 2) political decision-making and a general lack of investment accountability and transparency in the planning and decision-making process (transparency and accountability). These are further described below.
1.1.3.1 Poor understanding/practice of pavement asset management fundamentals The planning phase and the implementation phase both suffer from the same fundamental issues, notably the mismatch between pavement asset management fundamentals and local/donor capacity/willingness to understand and absorb these fundamentals in a locally appropriate manner with a focus on performance.
In order to prioritize network level investments (and their returns), one needs a solid pavement asset management system in place that responds to the technical capacity levels of the road agency, not the latest fads and most recent technological advances, which is where a lot of emphasis is placed by donor agencies (Wood and Metschies, 2006, Asian Development Bank, 2013). Figure 1.5 below illustrates the general spectrum of complexity of a Pavement Management System, however this does not account for the time it takes to build the institutional and educational awareness to progress from database development to the application of engineering logic and economics to simulate risk management models.
Figure 1.5 Information and decision support system, Taken from Asian Development Bank (2013)
Risk Manage me nt Mode l
Hard
Low High
Cost, Comple xity, Knowe ldge re quire d to use , Ability to fore cast and make budge ts Easy
Ease of Imple me ntation and Sustainability Le ve l
Database (Data Colle ction & Storage )
Rule Base d PMS (Engine e ring Logic)
Dr. Bennett has noted that the successful implementation of a pavement asset management system occurs over a period of many years or decades, which does not necessarily match donor-financed programs, nor objectives in spending on large capital programs as indicated in figure 1.6 below.
Figure 1.6 Indicative time scale (in years) to develop a Pavement Management System, Taken from Asian Development Bank (2013)
The indicative timeline assumes that the foreign recipient countries have bought into the idea behind road asset management and have true top-level management support with appropriate resources, which is not always the case. In 2012, the Sub-Saharan Africa Transport Program (SSATP) conducted a review of road management practices in seven sub-Saharan African countries and found that most road agencies surveyed have established some type of road asset management systems with varying levels of sophistication and capability. However, for various reasons, including problems with local calibration of the models, most countries have experienced difficulty in operating these systems in a reliable and sustainable manner. As a result, the agencies are unable to develop strategies for managing the road network in an optimal manner (Pinard, 2012).
Years 1 2 3 4 5 6 7 8 9 10 L evel of E xc el lence BASIC ADVANCED Aware Initiative Competence Best Practice Excellence
An Asian Development Bank report noted few of the countries visited had the needed functional policy structures in place to efficiently allocate resources, much less the institutional and human capacity needed to support a road asset management system in line with higher GDP nations, especially with HDM4 planning and prioritization systems (Wood and Metschies, 2006).
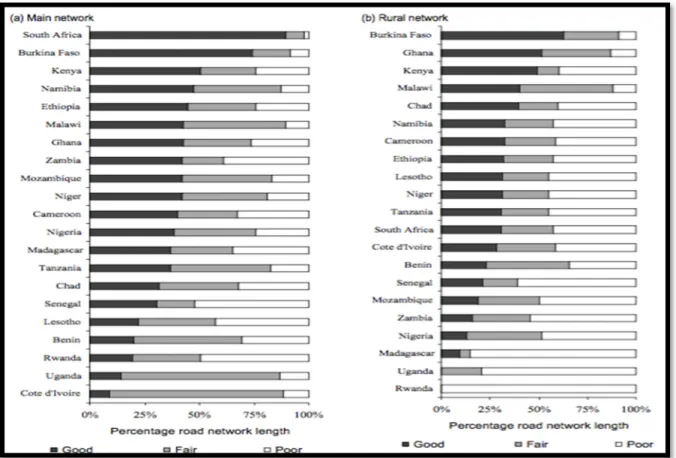
For the transport sector in sub-Saharan Africa, the inability to prioritize network investments has left the overall network condition in 19 out of 21 countries less than “good” (See figure 1.7 below), which results in higher Vehicle Operating Costs (VOCs) for the users and higher infrastructure investment costs for the road agency.
Figure 1.7 Sub-Saharan Africa road network class and condition by percentage of length, Taken from Gwilliam et al. (2008)
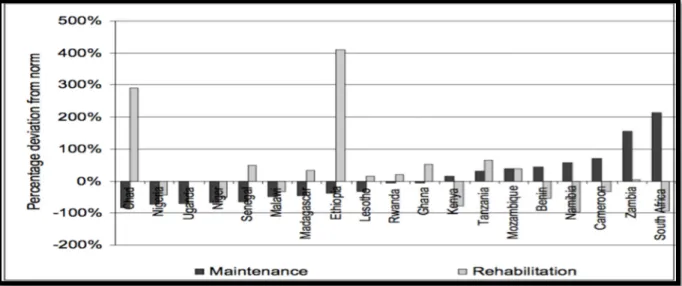
The World Bank estimates that at least half of the countries in sub-Saharan Africa are not providing adequate maintenance for the primary road network, with some not even spending enough for routine maintenance; the World Bank estimates that lower income countries underspend on maintenance, while the better off spend above the maintenance norm. See figure 1.8 below. (Gwilliam et al, 2008).
Figure 1.8 Percentage of maintenance and rehabilitation spending relative to “norms” Taken from Gwilliam et al. (2008)
In a recent audit, the EU noted that countries generally prioritize rehabilitation and upgrading of the road network first, which leaves little money for maintenance, with the result that more rehabilitation work is needed in the future due to the lack of periodic maintenance (European Court of Auditors, 2012). Similar prioritization results were found for ADB financed projects. (Wood and Metschies, 2006) Prioritization of rehabilitation and reconstruction works is in direct contradiction to the principles of pavement asset management, which prioritize maintenance over rehabilitation given the higher economic overall returns to the road agency.
This vicious circle calls into question the economic efficiency of the donor investments in these countries as the prioritization of rehabilitation and upgrading is essentially burdening the country with a larger future liability and worse, increased dependency on limited donor funding. This is analogous to providing someone a brand new car, but no instructions on how
and when to maintain the car, let alone assuring that the person has the financial resources available to pay for the maintenance and upkeep. Due to generally accepted accounting principles that require that an expense not be depreciable and therefore not be capitalized and amortized for over a year so as to justify a loan, donor agencies cannot justify a loan to support maintenance much like a borrower cannot easily borrow to pay a recurring expense. Donor agencies that provide grants may not be limited by these constraints and may invest in maintenance works, which supports the overall health of the countries’ road networks and can complement those donor agencies that provide loans.
Secondly, there is also evidence to suggest that road investments are over-engineered relative to need, which “wastes” scare economic resources needed for these countries’ development. The World Bank has noted that around 30% of the primary network surveyed indicated over-engineering relative to associated traffic levels, which is an inefficient use of scarce resources (Gwilliam et al, 2008); coupled with the lack of maintenance, an even larger inefficient use of resources as the over-engineered roads fail prematurely due to lack of maintenance.
In an extensive review of the Zambian Road Network, despite having a national transport policy mandating the “preservation of investments already made through maintenance as priority for sustainable national development…to promote national socio-economic development” (Zambia, 2002), the Government of Zambia recently undertook a program to increase its quantity of bituminous roads, mostly under 150 vehicles per day (i.e. over-engineered from a traffic perspective), by 8,000 km. This dramatic increase, effectively doubling the paved road network, worth an estimated $6 billion USD, effectively translates to an unfunded liability for the Government that is counter to proper road preservation as the country does not have the means to support the capital (borrowing) or maintenance needs (state budget) of the larger network. (Tembo, 2015) To provide a rough order of magnitude scale, assuming 200 vehicles per day at $0.10USD VOC savings per day per kilometer at 8,000 kilometers over a period of 20 years at 6% annual growth, the maximum benefits to be gained are $2.15 billion USD, which assumes no change to roughness over the 20 years, not to mention the generous VOC savings per vehicle attributed to the analysis, or any additional maintenance
and rehabilitation/construction costs. Investing $6 billion USD to receive $2 billion USD user benefits is not an efficient use of scarce capital.
1.1.3.2 Political decision making and limited investment transparency and accountability Robinson and Torvik (2005) have indicated that there are incentives for key stakeholders to misrepresent the costs and benefits of a project in order to secure funding. Robinson and Torvik have demonstrated that “white elephant projects” are politically attractive in order to influence voters who would otherwise not find them politically appealing; the argument is that socially efficient projects do not allow politicians a way to differentiate themselves from others; white elephants provide some politicians the ability to credibly promise some sort of redistribution to supporters as long as the political benefits are larger relative to the socially efficient projects’ surplus (Robinson and Torvik, 2005). The road agency, as an extension of the state or on its own volition, is incentivized to promote these projects, especially to donors that are not necessarily politically aware of what is occurring.
Reviewing donor performance in the road sector is difficult. The 2016 Aid Transparency Index performed by the International Aid Transparency Initiative found that only 25% of international aid donations are fully transparent (Sharman, 2016), which is also supported by development literature. (Riddell, 2008) One primary issue is that donor agencies’ primary beneficiaries provide minimal feedback (if any at all) and much less in a timely manner (Williamson, 2009) to affect donor behavior. Donor agencies typically rely on some sort of government agency to communicate the needs of the actual beneficiaries, which allows the host government to control the central messaging around the issue vis-a-vis the donor. This reliance on host government agents can be conflicting, especially in the case of state capture and/or corruption. As such, it is essential that any donor agency provide extensive diligence in checking and verifying the reliability of all data at all stages of the project lifecycle to ensure the viability of the investment, and also take appropriate measures to independently review all designs, tender preparation, procurement and execution so that quality, budgets, schedules and benefits are met.
There appears to be a consistent problem across donor agencies with access to high quality, timely and accurate data to make an informed investment decision. Data is hard to collect and the reliability of the data is not always promising. The results show that most donor agencies spend a large degree of time outsourcing the data collection and analysis without always fully verifying the resulting data quality, which leads to less than optimal outcomes in the field (Warner, 2010, GAO, 2012a, GAO, 2012b, Warner, 2014, Rose and Wiebe 2015). This finding suggests that an extensive, yet cost effective, data collection and verification approach is required; or to quote former U.S. President Ronald Reagan “trust, but verify.”
Riddell argues that donors as a whole are more incentivized to show the short-term effects of aid working (number of people helped or served) as opposed to the extent to which they achieved the standards in aid delivery they pledged to meet. (Riddell, 2008) Verification of the investment decision calculations, both ex post and ex ante, are not possible, with some notable exceptions, as the full data sets are rarely provided to the public for review (Rose and Wiebe, 2015, Pritchett, 2002). The MCC model helps counter this problem with extensive post-compact assessments and data transparency requirements.
A thorough review of many economic assessments of road projects performed by numerous consultants in various developing countries show that the determinant assumptions used in the ERR calculations are not always provided, justified, documented or sourced.
One performance metric that donor agencies do use routinely is the level of disbursements relative to the planned or stated goal targets. Williamson notes that this is a rational bureaucratic outcome that is driven by the need to maintain or grow the donor agency budget (Williamson, 2009). Agencies that provide grants are incentivized to obligate funding to a certain country in a certain year to demonstrate the need for full or increased agency funding for future years (Rose and Wiebe, 2015). Agencies that provide loans are incentivized to make loans, which provide interest revenue for the agencies, regardless of investment decision criteria like a cost benefit analysis.(Klein and Harford, 2005) At the end of the day, donor
agencies’ ultimate decisions come down to their ability to spend the allotted money in each fiscal period to meet the agency needs; the problem is that they do not always know where the best investments are in each country. The primary takeaway is that donor agencies need a tool that helps them quickly identify the winner projects early-on to ensure sufficient financial and economic viability, but also provide a sufficient pool of high-quality investments that can adjust based on agency needs; Chapter 3 of this thesis provides one such mechanism.
Warner notes in his review of World Bank projects that the use of cost-benefit tools is made
ex post investment decisions, which places a large amount of pressure on staff to reach
supporting investment conclusions; this, in turn, downplays the importance of the tool in investment decisions (Warner, 2010).
It is important to remember that a lot of time and energy is spent by donor agency staff trying to put together an attractive portfolio, however there are institutional realities like long procurement periods, management check-ins, and the management of other portfolios that make finding a viable investment hard, especially if previous studies are not complete or the donor agency staff is overwhelmed.
This is not to say that these organizations are misplaced for trying to spend large sums of money in developing countries; the problem is in finding the right projects with which to invest these large sums of money, or identifying the venomous snakes from the non-venomous snakes to use the parlance of Pritchett, Woolcock and Andrews and the PDIA process (See section 1.1.4 below). These are the same types of pressures faced by hedge fund investment managers; finding the promising investments out of a thicket of poor investments. This thesis provides an approach, which is described in Chapter 3, of trying to overcome this problem by adapting a fast-track approach to weed out poor investments quickly.
The average cost overruns experienced on over 90 donor financed projects are about 19% from contract award to completion, and 2.35 times from the initial funding authorization phase to final completion, (Alexeeva et al, 2008, Chong and Hopkins, 2016) which suggest lower ex
post economic returns relative to ex ante returns. A recent study of the transport sector covering
over 258 international rail, fixed length and road projects found that project costs are underestimated in 9 out of 10 projects, with cost underestimations more pronounced in developing nations than in North America or Europe. The study has demonstrated the incentives found by rational actors to underestimating costs and overestimating benefits for large infrastructure projects in order to gain approval for their projects and its requisite funding; these projects generally generate the highest cost overruns and provide for larger benefit shortfalls resulting in what the author finds as the “survival of the un-fittest (sic) infrastructure projects” (Flyvbjerg, 2009, Sieber, 2012).
A recent report noted this problem, stating that locally produced models projected higher returns for desired investments compared with results from donor agencies’ review that almost always lowered the estimated returns, sometimes to a point where the investment lacked economic justification (Rose and Wiebe, 2015). The author has had firsthand experience with engineering reports that overestimate certain drivers of the economic models like IRI and traffic; in one case, the stated IRI in the model was about twice the actual field measurement; the correction resulted in a dramatic decrease in the expected investment returns.
Flyvbjerg states that these kinds of cost overruns occur due to the lack of professional accountability or malpractice in project management, much like with doctors, lawyers and engineers. This lack of accountability in the project management profession leads to others, including donor agencies, noting that cost overruns are a normal part of engineering and construction projects, which is not always the case (Flyvbjerg, 2009). One step that MCC is taking to meet this cost overrun problem is to increase its visibility in the design and implementation process; this will be described in more detail in Chapters 4 and 5 of this thesis.
1.1.4 Misaligned incentives
In the roads business, the primary actor is the road agency, which holds more information about the roads sector than the potential investor. The donor agency has limited visibility into the
road agency; will this be a venomous (out to fool the investor) or non-venomous (genuine intentions) road agency is hard for the donor agency and its experts to determine in the short period of time provided to bring the investment forward for decision. Secondly, there is the problem of premature loading, which is having people perform tasks that they are not capable of performing, like learning to run without having learned to walk first (Pritchett, 2002). The application of the Project Driven Iterative Adaption (PDIA) (Pritchett et al, 2010, Andrews, 2011, Andrews et al, 2012) technique to several developing country road agencies suggests the extension of that finding.
A pavement asset management system is primarily engineering know how, which is derived from high-quality education, instruction and experience, and a strong engineering culture to do better in a change-driven and rewarding environment to fight negligence, both of which may be found in small developing countries with limited governmental funding for universities coupled with fairly monopolistic engineering higher education institutions (and seats) with limited to no educational accreditation (Bordia, 2001). This results in a limited pool of engineers with various degrees of quality instruction, the best of which will either join the private sector, donor agency, or move internationally. In fact, in a recent discussion with a road agency official in sub-Saharan Africa, the official noted that the largest problem he faces when training and educating someone is that employee will become employed by the donor agency. There is simply not enough quality road engineering education being offered in developing countries.
Second, the instruction of pavement management principles and techniques is not universal to all engineering curriculums in industrialized economies, let alone emerging countries. Pavement management has only been around since the 1970s and has only really taken off in the industrialized economies over the last few decades. A recent visit to a sub-Saharan university, which is/was considered the most prestigious in the region, showed that pavement management is not a part of the curriculum; civil engineers are trained to do engineering calculations, rather than design an economically efficient engineering solution to a problem. This accords well with previous findings by others previously mentioned concerning the
absence of advancement of the countries’ road agencies; there is simply not enough engineering know how in pavement management.
1.1.5 Isomorphic mimicry and premature loading
That said a lot of road agencies (and donor agency officials) have learned to adapt to the “best practices,” appropriate “forms” and jargon of the donor community and can demonstrate superficial understanding of the main principles and technologies in what is deemed isomorphic mimicry (Pritchett et al, 2010, Andrews, 2011, Andrews et al, 2012). This is the equivalent of creating a paper road agency; looks good on paper with some fancy tools and instruments, but lacks depth to perform the basic road management functions. Isomorphic mimicry allows…
…organizations to maintain legitimacy by adopting the forms of successful organizations and states even without their functions. Societal and institutional structures can create an ecosystem in which isomorphic mimicry is actually the optimal strategy for state organizations, leaders, and managers (Pritchett et al, 2010).
By not understanding the actual level of technological capacity and the road agency organizational capacity, donors run the risk of overwhelming (overloading) the recipients to unsustainable levels, which ensures failure. Worse, premature loading too fast can encourage counterproductive behaviour through reduced morale and frustration and can actually turn the road agency from a service-providing agency to an extractive agency.
This latter behaviour can be reinforced by donor focus on project inputs (disbursements) over project outputs (quality of road constructed) (Pritchett et al, 2010); the road agency actors effectively change their behaviour (function) to match the incentives of the donor agencies (which is to develop a program in a specific timeline to ultimately spend money). The result is that many of these road agencies do not improve, as there is little incentive to perform, with the resulting degradation of the road network and lost returns to investment.
The problem leads to many good, bad options by donor agencies to “fix” the implementation failures with the good options being discarded as they are not “state of the art,” or “ideal,” or “too scaled down.” (Pritchett et al, 2010) The authors point out that they key to resolving this persistent problem is the need to develop low-level performance before building longer-term capacity and performance. This is the equivalent of learning to fly a single engine Cessna before learning to fly a supersonic plane.
There is also a premature loading problem with some of the consultants/consulting firms hired by the donor agency to help assess the road investments; while these consultants have detailed resumes showing plenty of experience, few of them are capable of delivering as they have not been properly trained. It is very hard for donor agencies to discern the good from the bad candidates using existing procurement processes; it is not until the implementation phase that they realize the consultants’ real capacity, by which time it is difficult to remove/replace the consultant.
For example, a consultant was hired by a donor agency to assess a basket of roads in a SSA country, upon which the consultant recommended pursing engineering designs and potential capital investments for the donor agency. These recommended investments from unpaved to paved, bituminous roads were estimated by the consultant to cost around $700,000/per kilometer with several of them having double digit traffic (AADT) levels. When asked to justify the investments, the consultant could not produce the IRI or AADT information, as it was not collected. The resulting ERRs would have been negative on many, if not all, of the proposed investments. While the consultant had attended a prestigious university at a PhD level and had notable experiences in pavement management, the consultant was unable to properly assist the donor agency as expected and would have resulted in a poor investment opportunity for the donor agency. Fortunately the donor agency was able to react quickly to find a more qualified consultant. Having an agency that is focused on learning, including from its past experiences, provides the needed feedback loop for continuous improvement.
1.1.6 Corruption eats away at economic benefits
A review of the incentives at play in the engineering and construction field is not complete without discussing the nefarious effects of corruption. The following section is an extensive review of the literature available. The primary definition of corruption is the misuse of public funds for private gain and or the misuse of public funds, goods, or office for private or political gain. Klitgaard defined corruption in formulaic terms, below:
Corruption = Monopoly + Discretion – Accountability (Klitgaard, 1991)
For the transport sector, monopoly concerns an individual monopoly of goods and services (like a government official), with the discretion to supply the goods or services with minimal or no transparency in the decision making process (World Bank, 2009). See figure 1.9 below. The only deterrent to corruption is the degree of accountability.
Figure 1.9 Causes of corruption, Taken from World Bank (2009)
The global construction market is estimated to be over $3.2 trillion USD per year (Nordin et al, 2011) accounting for between 5% to 7% of GDP in most countries. Construction is estimated to contribute to about a third of gross capital formation with an undeniable role in economic development (Kenny, 2007). The global construction industry is consistently ranked
as one of the most corrupt by Transparency International; annual corruption costs are estimated to be around $500 billion (de Jong et al, 2009, ASCE, 2015), which is larger than the entire GDP of the Quebec province or South Africa. A recent survey shows the percentage of reported bribery and corruption by industry in figure 1.10 below, with engineering and construction leading all industries at 49%.
Figure 1.10 Percentage of reported bribery and corruption (economic crime) by industry Taken from PWC (2014)
Transparency International provides annual corruption perception indexes to evaluate the extent of corruption in countries; the most recently available (2015) is shown in figure 1.1 below with red indicating more corrupt and yellow less corrupt. The developing countries that receive foreign assistance are various shades of red, or corrupt.
Figure 1.11 Corruption Perception Index 2015 Taken from Transparency International (2015)
The effects of corruption on the overall political economy are well-known. Corruption has been linked to increasing income inequality and poverty (Gupta et al, 2002), reduction in private investment (Mauro, 1995), and environmental degradation, (Sieber, 2012), all of which reduce economic growth. Corruption has also been shown to erode confidence in political leaders and institutions, effectively reducing public participation to coercion and force, which leads to civil unrest (Fantaye, 2004), erosion of the rule of law, and harm to the reputation of and trust in the state (Sieber, 2012). Others have shown that corruption can also lead to the formation of extremist parties like the Taliban and ISIS (Chayes, 2015). Corruption, if not properly checked, cannot only erode confidence in the government, but also destroy the government and any opportunities for sustainable economic growth.
Engineering and construction projects provide increased opportunities for rent-seeking from corrupt officials and individuals largely due to the large contract value (Robinson and Torvik, 2005, Wood and Metschies, 2006, Patterson and Chaudhuri, 2007, World Bank, 2009, Sieber, 2012). Donor agencies are aware of the problem and have produced numerous anti-corruption papers, research, and policies (Kenny, 2007, Kenny, 2009a, Kenny, 2009b, World Bank, 2009, World Bank Integrity Vice President, 2011, Sieber, 2012), as have the private sector and academia (Svensson, 2000, Fantaye, 2004, Olken, 2007, de Jong et al, 2009, Boyd and Padilla.,
2009, PWC, 2009, Nordin et al, 2011, Bowen et al, 2012, Gillanders, 2013, PWC, 2013, PWC, 2014).
Moyo notes that the World Bank has estimated that as much as 85% of aid has been misappropriated from its intended use often to unproductive projects (Moyo, 2010). For the transport sector, an estimated 5% to 40% of allocations are estimated to be lost to corruption (Patterson and Chaudhuri, 2006). Olken determined that approximately 24% of the total cost of rural road projects in Indonesia was illicit. (Olken, 2007). It has been noted that after the Charbonneau commission began its hearings on potential corruption in public works contracts in Quebec, the cost of public construction contracts in Montreal decreased by some 20-30 percent (Binette, 2016).
Corruption networks are highly organized and efficient cartels, which operate much like the organized crime syndicates (Green, 2005, K&L Gates, 2014, Gyulai, 2014, Charbonneau and Lachance, 2015). They can control construction contracts, prices, and firm selection, and have shown to have ties to political elites, much as the Charbonneau Commission has uncovered in Quebec.
The standard symptoms of corruption in the transport sector are numerous and are shown in table 1.1 below.
Table 1.1 Symptoms of corruption in the transport sector at the network and project level Adapted from Tanzi and Davoodi (1997), Patterson and Pinki (2007), and Sieber (2012)
Network or Agency Level Project Level
1) The disregard of an objective needs-based assessment planning and funding allocation process
2) Recurrent expenditures like maintenance directed to political supporters and away from an objective allocation scheme
3) Weak agency processes and controls 4) Personnel appointments that support the
corruption
1) Deliberate overdesign by engineer for own interest (more work) or from political or vested interests that may benefit from overdesign
2) Land acquisition, social safeguards and environmental concerns deliberately underestimated
3) Benefit streams intentionally overstated with costs understated
4) Poor quality work
5) Variation Orders above 20% of the original contract
6) Time overruns more than 30% of the original contract
7) Poor oversight, monitoring and control of the works
8) Quantities billed but not placed
The donor agencies, which fund a large amount of roads investments in developing countries, are aware of the problem of corruption in their portfolios; the question is how they choose to manage it.
The first and major problem with many donor agency models is what is referred to as the principal agent issue; namely the donor agencies (principle) typically partner with a local government agency or group (agent) to implement the projects on their behalf with the private sector (firm) (Klitgaard, 1988, Hobbs, 2005). The problem arises with the agent’s self-interest